From Surf Wiki (app.surf) — the open knowledge base
1971 Ontario general election
Canadian provincial election
Canadian provincial election
| Field | Value | |
|---|---|---|
| election_name | 1971 Ontario general election | |
| country | Ontario | |
| type | parliamentary | |
| ongoing | no | |
| party_colour | no | |
| party_name | no | |
| previous_election | 1967 Ontario general election | |
| previous_year | 1967 | |
| previous_mps | 28th Legislative Assembly of Ontario | |
| next_election | 1975 Ontario general election | |
| next_year | 1975 | |
| elected_mps | 29th Legislative Assembly of Ontario | |
| seats_for_election | 117 seats in the [29th Legislative Assembly of Ontario](29th-legislative-assembly-of-ontario) | |
| 59 seats were needed for a majority | ||
| election_date | October 21, 1971 | |
| image1 | [[File:William Davis Empire Club (cropped).jpg | 160x160px]] |
| colour1 | ||
| leader1 | Bill Davis | |
| leader_since1 | [February 12, 1971](1971-progressive-conservative-party-of-ontario-leadership-election) | |
| party1 | ||
| leaders_seat1 | Peel North | |
| last_election1 | 69 | |
| seats1 | 78 | |
| seat_change1 | 9 | |
| popular_vote1 | 1,465,313 | |
| percentage1 | 44.5% | |
| swing1 | 2.2pp | |
| image2 | [[File:Robert Nixon-c1971 (3x4).jpg | 160x160px]] |
| colour2 | ||
| leader2 | Robert Nixon | |
| leader_since2 | January 6, 1967 | |
| party2 | ||
| leaders_seat2 | Brant | |
| last_election2 | 28 | |
| seats2 | 20 | |
| seat_change2 | 8 | |
| popular_vote2 | 913,742 | |
| percentage2 | 27.8% | |
| swing2 | 3.8pp | |
| image3 | [[File:Stephen Lewis circa 1963.jpg | 160x160px]] |
| colour3 | ||
| leader3 | Stephen Lewis | |
| leader_since3 | October 4, 1970 | |
| party3 | ||
| leaders_seat3 | Scarborough West | |
| last_election3 | 20 | |
| seats3 | 19 | |
| seat_change3 | 1 | |
| popular_vote3 | 893,879 | |
| percentage3 | 27.1% | |
| swing3 | 1.2pp | |
| title | Premier | |
| posttitle | Premier after election | |
| before_election | Bill Davis | |
| before_party | ||
| after_election | Bill Davis | |
| after_party |
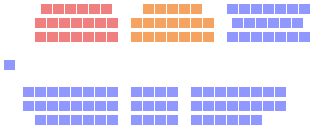
59 seats were needed for a majority |}} The 1971 Ontario general election was held on October 21, 1971, to elect the 117 members of the 29th Legislative Assembly of Ontario (Members of Provincial Parliament, or "MPPs") of the Province of Ontario.
The Ontario Progressive Conservative Party, led by Bill Davis, who had replaced John Robarts as PC leader and premier earlier in the year, won a ninth consecutive term in office, and maintained its majority in the legislature, increasing its caucus in the legislature by eight seats from its result in the previous election.
The Ontario Liberal Party, led by Robert Nixon, lost seven seats, but continued in the role of official opposition.
The social democratic Ontario New Democratic Party, led by Stephen Lewis, lost one seat.
This election marked the first time that the provincial election was held on a Thursday. Subsequently, every provincial election has also been held on a Thursday, with the exception of the 2007 Ontario general election, which was held on a Wednesday.
The electoral franchise was significantly expanded upon the reduction of the voting age from 21 to 18.
Results
Summary
|-
! colspan=2 rowspan=2 | Political party
! rowspan=2 | Party leader
! colspan=4 | MPPs
! colspan=4 | Votes
|-
! Candidates
!1971
!±
!#
! ±
!%
! ± (pp)
| 117 || 69 || 78 || 9 || 1,465,313 || 446,558 || 44.50% || 2.40
includes Liberal-Labour in 1967 totals
| 117 || 28 || 20 || 8 || 913,742 || 146,351 || 27.75% || 3.97
| 117 || 20 || 19 || 1 || 893,879 || 265,482 || 27.15% || 1.18
| || 23 || – || – || – || 16,959 || 14,577 || 0.52% || 0.42
| 5 || – || – || – || 1,620 || 558 || 0.05% || 0.03
| || 5 || – || – || – || 1,204 || 702 || 0.04% || 0.04
|-
! colspan="3" style="text-align:left;" | Total
|384||117
! " colspan="2"|117
! " colspan="2"|3,292,717
! " colspan="2"| 100.00%
|-
| 18,059
| 1,469 |
|---|
| 3,310,776 |
| 871,538 |
| 73.52 |
| 7.34 |
| - |
| 4,503,142 |
| 817,387 |
| } |
Vote and seat summaries
|File:Ternary ON1967.svg |1967 |File:Ternary ON1971.svg |1971
| Party | Seats | Votes | Change (pp) | |
|---|---|---|---|---|
| {{bartable | 2.40 | |||
| {{bartable | -3.97 | |||
| {{bartable | 1.18 | |||
| {{bartable | 0.42 | |||
| {{bartable | -0.03 |
Synopsis of results
| Riding | Winning party | Turnout | ||||||||||||||||
|---|---|---|---|---|---|---|---|---|---|---|---|---|---|---|---|---|---|---|
| including spoilt ballots | Votes | Nameorder is as given in EO reports | **[1967](1967-ontario-general-election)** | Party | Votes | Share | Margin | |||||||||||
| # | Margin | |||||||||||||||||
| % | PC | Lib | NDP | Ind | Comm | SC | Total | |||||||||||
| Algoma | PC | PC | 5,222 | 42.20% | 1,397 | 11.29% | 73.88% | 5,222 | 3,326 | 3,825 | – | – | – | 12,373 | ||||
| Algoma—Manitoulin | Lib | PC | 5,147 | 40.32% | 1,298 | 10.17% | 72.06% | 5,147 | 3,768 | 3,849 | – | – | – | 12,764 | ||||
| Brant | Lib | Lib | 8,846 | 50.98% | 3,699 | 21.32% | 73.31% | 5,147 | 8,846 | 3,359 | – | – | – | 17,352 | ||||
| Brantford | NDP | PC | 16,632 | 45.04% | 4,524 | 12.25% | 80.80% | 16,632 | 8,188 | 12,108 | – | – | – | 36,928 | ||||
| Carleton | PC | PC | 18,538 | 49.95% | 7,622 | 20.54% | 73.78% | 18,538 | 10,916 | 7,656 | – | – | – | 37,110 | ||||
| Carleton East | PC | PC | 13,190 | 46.56% | 4,123 | 14.56% | 65.97% | 13,190 | 9,067 | 6,069 | – | – | – | 28,326 | ||||
| Chatham—Kent | PC | PC | 10,827 | 48.54% | 2,208 | 9.90% | 65.09% | 10,827 | 8,619 | 2,859 | – | – | – | 22,305 | ||||
| Cochrane North | PC | PC | 11,212 | 64.02% | 5,454 | 31.14% | 76.21% | 11,212 | 543 | 5,758 | – | – | – | 17,513 | ||||
| Cochrane South | NDP | NDP | 11,383 | 48.43% | 655 | 2.79% | 74.68% | 10,728 | 1,270 | 11,383 | 122 | – | – | 23,503 | ||||
| Dufferin—Simcoe | PC | PC | 12,063 | 51.97% | 4,454 | 19.19% | 68.28% | 12,063 | 7,609 | 3,540 | – | – | – | 23,212 | ||||
| Durham | PC | PC | 10,628 | 48.22% | 3,454 | 15.67% | 76.47% | 10,628 | 4,239 | 7,174 | – | – | – | 22,041 | ||||
| Elgin | PC | PC | 14,742 | 45.08% | 4,325 | 13.23% | 78.98% | 14,742 | 10,417 | 7,329 | 215 | – | – | 32,703 | ||||
| Essex—Kent | Lib | Lib | 7,087 | 40.30% | 1,035 | 5.89% | 75.52% | 4,446 | 7,087 | 6,052 | – | – | – | 17,585 | ||||
| Essex South | Lib | Lib | 12,217 | 51.75% | 5,696 | 24.13% | 74.77% | 4,872 | 12,217 | 6,521 | – | – | – | 23,610 | ||||
| Fort William | PC | PC | 13,428 | 49.05% | 3,777 | 13.80% | 75.91% | 13,428 | 4,296 | 9,651 | – | – | – | 27,375 | ||||
| Frontenac—Addington | PC | PC | 7,539 | 38.05% | 1,706 | 8.61% | 71.67% | 7,539 | 5,833 | 2,081 | 4,363 | – | – | 19,816 | ||||
| Glengarry | PC | PC | 7,496 | 55.72% | 3,211 | 23.87% | 75.27% | 7,496 | 4,285 | 1,672 | – | – | – | 13,453 | ||||
| Grenville—Dundas | PC | PC | 11,635 | 63.06% | 6,988 | 37.87% | 70.55% | 11,635 | 4,647 | 1,927 | 242 | – | – | 18,451 | ||||
| Grey—Bruce | Lib | Lib | 13,657 | 46.17% | 2,638 | 8.92% | 79.70% | 11,019 | 13,657 | 4,905 | – | – | – | 29,581 | ||||
| Grey South | PC | PC | 10,285 | 54.91% | 4,870 | 26.00% | 77.15% | 10,285 | 5,415 | 3,029 | – | – | – | 18,729 | ||||
| Haldimand—Norfolk | PC | PC | 16,197 | 57.67% | 8,981 | 31.98% | 74.48% | 16,197 | 7,216 | 4,673 | – | – | – | 28,086 | ||||
| Halton East | PC | PC | 21,359 | 55.43% | 11,622 | 30.16% | 75.07% | 21,359 | 9,737 | 7,154 | 284 | – | – | 38,534 | ||||
| Halton West | PC | PC | 25,136 | 59.53% | 16,353 | 38.73% | 76.20% | 25,136 | 8,783 | 8,306 | – | – | – | 42,225 | ||||
| Hamilton Centre | NDP | NDP | 8,018 | 38.32% | 1,422 | 6.80% | 61.61% | 6,596 | 6,310 | 8,018 | – | – | – | 20,924 | ||||
| Hamilton East | NDP | NDP | 11,073 | 40.64% | 2,846 | 10.45% | 71.11% | 8,227 | 7,947 | 11,073 | – | – | – | 27,247 | ||||
| Hamilton Mountain | PC | PC | 17,979 | 50.28% | 7,254 | 20.29% | 78.13% | 17,979 | 7,053 | 10,725 | – | – | – | 35,757 | ||||
| Hamilton West | PC | PC | 12,807 | 43.51% | 4,565 | 15.51% | 73.86% | 12,807 | 8,150 | 8,242 | – | 233 | – | 29,432 | ||||
| Hastings | PC | PC | 9,195 | 59.79% | 4,636 | 30.14% | 70.12% | 9,195 | 4,559 | 1,626 | – | – | – | 15,380 | ||||
| Huron | PC | PC | 9,793 | 57.81% | 6,155 | 36.34% | 78.11% | 9,793 | 3,638 | 3,414 | 94 | – | – | 16,939 | ||||
| Huron—Bruce | Lib | Lib | 12,374 | 67.60% | 8,616 | 47.07% | 79.13% | 3,758 | 12,374 | 2,172 | – | – | – | 18,304 | ||||
| Kenora | PC | PC | 11,226 | 61.44% | 6,331 | 34.65% | 73.05% | 11,226 | 2,150 | 4,895 | – | – | – | 18,271 | ||||
| Kent | Lib | Lib | 8,768 | 49.83% | 1,992 | 11.32% | 80.37% | 6,776 | 8,768 | 2,051 | – | – | – | 17,595 | ||||
| Kingston and the Islands | PC | PC | 12,285 | 43.92% | 187 | 0.67% | 68.30% | 12,285 | 12,098 | 3,587 | – | – | – | 27,970 | ||||
| Kitchener | Lib | Lib | 19,168 | 42.30% | 5,633 | 12.43% | 72.62% | 13,535 | 19,168 | 12,237 | 379 | – | – | 45,319 | ||||
| Lambton | PC | PC | 9,983 | 50.70% | 3,697 | 18.78% | 75.69% | 9,983 | 6,286 | 2,915 | 507 | – | – | 19,691 | ||||
| Lanark | PC | PC | 10,670 | 58.97% | 5,695 | 31.47% | 69.20% | 10,670 | 4,975 | 2,450 | – | – | – | 18,095 | ||||
| Leeds | PC | PC | 15,477 | 65.45% | 10,754 | 45.48% | 75.26% | 15,477 | 3,447 | 4,723 | – | – | – | 23,647 | ||||
| Lincoln | PC | PC | 19,513 | 62.54% | 13,289 | 42.59% | 72.38% | 19,513 | 6,224 | 4,556 | 572 | 336 | – | 31,201 | ||||
| London North | PC | PC | 17,266 | 41.90% | 5,426 | 13.17% | 73.09% | 17,266 | 11,198 | 11,840 | 902 | – | – | 41,206 | ||||
| London South | PC | PC | 24,064 | 50.54% | 11,363 | 23.87% | 77.88% | 24,064 | 12,701 | 10,845 | – | – | – | 47,610 | ||||
| Middlesex North | PC | PC | 8,633 | 52.49% | 4,155 | 25.26% | 78.65% | 8,633 | 3,337 | 4,478 | – | – | – | 16,448 | ||||
| Middlesex South | PC | PC | 12,253 | 42.85% | 3,053 | 10.68% | 77.14% | 12,253 | 7,140 | 9,200 | – | – | – | 28,593 | ||||
| Muskoka | PC | PC | 7,240 | 50.01% | 3,119 | 21.54% | 73.68% | 7,240 | 3,116 | 4,121 | – | – | – | 14,477 | ||||
| Niagara Falls | Lib | PC | 12,221 | 42.25% | 1,833 | 6.34% | 73.46% | 12,221 | 10,388 | 6,319 | – | – | – | 28,928 | ||||
| Nickel Belt | PC | NDP | 9,003 | 49.37% | 1,964 | 10.77% | 79.34% | 7,039 | 2,195 | 9,003 | – | – | – | 18,237 | ||||
| Nipissing | Lib | Lib | 12,166 | 41.95% | 28 | 0.10% | 74.61% | 12,138 | 12,166 | 4,698 | – | – | – | 29,002 | ||||
| Northumberland | PC | PC | 12,277 | 54.43% | 5,560 | 24.65% | 75.74% | 12,277 | 6,717 | 3,563 | – | – | – | 22,557 | ||||
| Ontario | PC | PC | 10,970 | 52.26% | 5,306 | 25.28% | 76.40% | 10,970 | 5,664 | 4,356 | – | – | – | 20,990 | ||||
| Ontario South | PC | PC | 16,561 | 51.14% | 5,614 | 17.34% | 78.42% | 16,561 | 4,876 | 10,947 | – | – | – | 32,384 | ||||
| Oshawa | NDP | PC | 19,207 | 46.73% | 2,726 | 6.63% | 74.99% | 19,207 | 5,413 | 16,481 | – | – | – | 41,101 | ||||
| Ottawa Centre | Lib | NDP | 8,075 | 35.46% | 182 | 0.80% | 62.36% | 7,893 | 6,804 | 8,075 | – | – | – | 22,772 | ||||
| Ottawa East | PC | Lib | 10,827 | 52.52% | 5,127 | 24.87% | 57.10% | 5,700 | 10,827 | 3,590 | 499 | – | – | 20,616 | ||||
| Ottawa South | PC | PC | 22,392 | 51.67% | 11,754 | 27.12% | 72.89% | 22,392 | 10,307 | 10,638 | – | – | – | 43,337 | ||||
| Ottawa West | PC | PC | 18,349 | 45.54% | 6,712 | 16.66% | 74.85% | 18,349 | 10,308 | 11,637 | – | – | – | 40,294 | ||||
| Oxford | Lib | PC | 16,322 | 46.01% | 3,024 | 8.52% | 77.52% | 16,322 | 13,298 | 5,856 | – | – | – | 35,476 | ||||
| Parry Sound | PC | PC | 6,682 | 37.35% | 2,184 | 12.21% | 74.58% | 6,682 | 3,763 | 2,947 | 4,498 | – | – | 17,890 | ||||
| Peel North | PC | PC | 29,851 | 59.48% | 18,592 | 37.04% | 73.38% | 29,851 | 9,080 | 11,259 | – | – | – | 50,190 | ||||
| Peel South | PC | PC | 29,569 | 54.63% | 17,282 | 31.93% | 73.61% | 29,569 | 12,287 | 12,266 | – | – | – | 54,122 | ||||
| Perth | Lib | Lib | 16,265 | 54.31% | 6,815 | 22.76% | 74.35% | 9,450 | 16,265 | 4,231 | – | – | – | 29,946 | ||||
| Peterborough | NDP | PC | 18,632 | 42.69% | 590 | 1.35% | 77.67% | 18,632 | 6,970 | 18,042 | – | – | – | 43,644 | ||||
| Port Arthur | Lib | NDP | 11,461 | 45.06% | 1,369 | 5.38% | 75.47% | 10,092 | 3,880 | 11,461 | – | – | – | 25,433 | ||||
| Prescott and Russell | PC | PC | 10,950 | 51.84% | 5,499 | 26.03% | 75.01% | 10,950 | 5,451 | 4,723 | – | – | – | 21,124 | ||||
| Prince Edward—Lennox | PC | PC | 9,995 | 52.78% | 3,404 | 17.98% | 74.09% | 9,995 | 6,591 | 2,350 | – | – | – | 18,936 | ||||
| Quinte | PC | PC | 15,066 | 57.36% | 7,455 | 28.38% | 67.52% | 15,066 | 7,611 | 3,588 | – | – | – | 26,265 | ||||
| Rainy River | LL | Lib | 6,115 | 50.00% | 2,206 | 18.04% | 72.30% | 2,207 | 6,115 | 3,909 | – | – | – | 12,231 | ||||
| Renfrew North | PC | PC | 11,980 | 51.76% | 3,517 | 15.20% | 71.42% | 11,980 | 8,463 | 2,516 | 185 | – | – | 23,144 | ||||
| Renfrew South | PC | PC | 9,370 | 53.87% | 3,353 | 19.28% | 79.83% | 9,370 | 6,017 | 2,008 | – | – | – | 17,395 | ||||
| St. Catharines | PC | PC | 16,074 | 43.92% | 5,627 | 15.37% | 68.01% | 16,074 | 10,080 | 10,447 | – | – | – | 36,601 | ||||
| Sandwich—Riverside | NDP | NDP | 17,944 | 50.24% | 8,592 | 24.05% | 74.86% | 9,352 | 8,424 | 17,944 | – | – | – | 35,720 | ||||
| Sarnia | Lib | Lib | 14,422 | 52.44% | 6,884 | 25.03% | 67.23% | 7,538 | 14,422 | 5,544 | – | – | – | 27,504 | ||||
| Sault Ste. Marie | PC | PC | 14,983 | 43.00% | 1,035 | 2.97% | 79.24% | 14,983 | 5,915 | 13,948 | – | – | – | 34,846 | ||||
| Simcoe Centre | PC | PC | 17,067 | 55.98% | 9,192 | 30.15% | 72.30% | 17,067 | 7,875 | 5,543 | – | – | – | 30,485 | ||||
| Simcoe East | PC | PC | 12,109 | 48.41% | 5,468 | 21.86% | 73.33% | 12,109 | 6,264 | 6,641 | – | – | – | 25,014 | ||||
| Stormont | PC | PC | 13,378 | 58.09% | 7,099 | 30.83% | 68.46% | 13,378 | 3,372 | 6,279 | – | – | – | 23,029 | ||||
| Sudbury | Lib | NDP | 11,905 | 40.92% | 2,770 | 9.52% | 70.16% | 8,053 | 9,135 | 11,905 | – | – | – | 29,093 | ||||
| Sudbury East | NDP | NDP | 15,522 | 53.62% | 8,457 | 29.21% | 71.69% | 6,363 | 7,065 | 15,522 | – | – | – | 28,950 | ||||
| Thunder Bay | NDP | NDP | 6,996 | 55.03% | 3,882 | 30.54% | 75.38% | 3,114 | 2,602 | 6,996 | – | – | – | 12,712 | ||||
| Temiskaming | NDP | PC | 9,695 | 47.22% | 2,154 | 10.49% | 74.88% | 9,695 | 3,297 | 7,541 | – | – | – | 20,533 | ||||
| Victoria—Haliburton | PC | PC | 10,368 | 48.88% | 2,119 | 9.99% | 74.78% | 10,368 | 8,249 | 2,595 | – | – | – | 21,212 | ||||
| Waterloo North | Lib | Lib | 15,035 | 39.41% | 2,438 | 6.39% | 72.90% | 12,597 | 15,035 | 10,162 | 359 | – | – | 38,153 | ||||
| Waterloo South | PC | PC | 15,165 | 50.40% | 4,543 | 15.10% | 76.08% | 15,165 | 4,302 | 10,622 | – | – | – | 30,089 | ||||
| Welland | PC | PC | 15,044 | 50.19% | 5,157 | 17.20% | 79.87% | 15,044 | 5,046 | 9,887 | – | – | – | 29,977 | ||||
| Welland South | Lib | Lib | 8,845 | 36.35% | 438 | 1.80% | 74.09% | 8,407 | 8,845 | 7,082 | – | – | – | 24,334 | ||||
| Wellington—Dufferin | PC | PC | 8,250 | 51.11% | 3,383 | 20.96% | 71.41% | 8,250 | 4,867 | 2,559 | 467 | – | – | 16,143 | ||||
| Wellington South | Lib | Lib | 16,606 | 45.94% | 6,856 | 18.97% | 74.54% | 9,750 | 16,606 | 9,161 | 630 | – | – | 36,147 | ||||
| Wentworth | NDP | NDP | 14,128 | 43.82% | 3,937 | 12.21% | 70.84% | 10,191 | 7,920 | 14,128 | – | – | – | 32,239 | ||||
| Wentworth North | PC | PC | 12,489 | 45.35% | 4,279 | 15.54% | 80.74% | 12,489 | 8,210 | 6,842 | – | – | – | 27,541 | ||||
| Windsor—Walkerville | Lib | Lib | 12,986 | 44.83% | 976 | 3.37% | 74.84% | 3,974 | 12,986 | 12,010 | – | – | – | 28,970 | ||||
| Windsor West | NDP | NDP | 13,119 | 42.98% | 3,444 | 11.28% | 72.33% | 9,675 | 7,731 | 13,119 | – | – | – | 30,525 | ||||
| York Centre | Lib | Lib | 14,885 | 42.28% | 212 | 0.60% | 73.79% | 14,673 | 14,885 | 5,645 | – | – | – | 35,203 | ||||
| York North | PC | PC | 15,557 | 52.39% | 7,514 | 25.30% | 73.16% | 15,557 | 6,094 | 8,043 | – | – | – | 29,694 | ||||
| Armourdale | PC | PC | 16,055 | 49.99% | 7,511 | 23.39% | 74.05% | 16,055 | 8,544 | 7,519 | – | – | – | 32,118 | ||||
| Beaches—Woodbine | NDP | PC | 13,768 | 49.25% | 2,630 | 9.41% | 73.73% | 13,768 | 2,819 | 11,138 | 88 | – | 145 | 27,958 | ||||
| Bellwoods | PC | PC | 7,443 | 51.71% | 3,839 | 26.67% | 69.73% | 7,443 | 3,347 | 3,604 | – | – | – | 14,394 | ||||
| Don Mills | PC | PC | 16,102 | 50.80% | 5,986 | 18.88% | 74.18% | 16,102 | 5,481 | 10,116 | – | – | – | 31,699 | ||||
| Dovercourt | Lib | PC | 6,183 | 34.60% | 39 | 0.22% | 66.65% | 6,183 | 5,116 | 6,144 | – | 429 | – | 17,872 | ||||
| Downsview | Lib | Lib | 17,140 | 52.25% | 6,219 | 18.96% | 68.42% | 4,740 | 17,140 | 10,921 | – | – | – | 32,801 | ||||
| Eglinton | PC | PC | 20,242 | 57.06% | 10,005 | 28.20% | 78.82% | 20,242 | 10,237 | 4,819 | 180 | – | – | 35,478 | ||||
| Etobicoke | Lib | Lib | 16,676 | 39.79% | 943 | 2.25% | 75.56% | 15,733 | 16,676 | 9,072 | 432 | – | – | 41,913 | ||||
| High Park | NDP | NDP | 16,509 | 54.58% | 7,282 | 24.07% | 74.39% | 9,227 | 4,284 | 16,509 | – | – | 229 | 30,249 | ||||
| Humber | Lib | PC | 11,235 | 41.48% | 3,055 | 11.28% | 72.61% | 11,235 | 7,673 | 8,180 | – | – | – | 27,088 | ||||
| Lakeshore | NDP | NDP | 10,867 | 42.36% | 735 | 2.87% | 75.42% | 10,132 | 4,653 | 10,867 | – | – | – | 25,652 | ||||
| Parkdale | Lib | NDP | 5,994 | 36.37% | 436 | 2.65% | 66.60% | 4,930 | 5,558 | 5,994 | – | – | – | 16,482 | ||||
| Riverdale | NDP | NDP | 11,132 | 49.27% | 2,518 | 11.14% | 65.04% | 8,614 | 2,503 | 11,132 | – | – | 346 | 22,595 | ||||
| St. Andrew—St. Patrick | PC | PC | 9,588 | 46.61% | 1,137 | 5.53% | 68.33% | 9,588 | 1,860 | 8,451 | 275 | 231 | 164 | 20,569 | ||||
| St. David | PC | PC | 13,320 | 50.07% | 5,291 | 19.89% | 70.46% | 13,320 | 4,934 | 8,029 | – | – | 320 | 26,603 | ||||
| St. George | PC | PC | 16,916 | 55.44% | 9,492 | 31.11% | 67.58% | 16,916 | 7,424 | 5,801 | 374 | – | – | 30,515 | ||||
| Scarborough Centre | NDP | PC | 15,781 | 48.36% | 4,873 | 14.93% | 73.04% | 15,781 | 4,962 | 10,908 | 984 | – | – | 32,635 | ||||
| Scarborough East | Lib | PC | 13,206 | 40.94% | 670 | 2.08% | 73.51% | 13,206 | 12,536 | 6,514 | – | – | – | 32,256 | ||||
| Scarborough North | PC | PC | 24,982 | 56.16% | 12,023 | 27.03% | 80.39% | 24,982 | 6,235 | 12,959 | 308 | – | – | 44,484 | ||||
| Scarborough West | NDP | NDP | 13,092 | 38.96% | 170 | 0.51% | 73.50% | 12,922 | 7,594 | 13,092 | – | – | – | 33,608 | ||||
| York East | PC | PC | 17,830 | 50.69% | 7,890 | 22.43% | 74.83% | 17,830 | 9,940 | 7,402 | – | – | – | 35,172 | ||||
| York-Forest Hill | PC | Lib | 13,870 | 41.52% | 1,300 | 3.89% | 72.89% | 12,570 | 13,870 | 6,963 | – | – | – | 33,403 | ||||
| York Mills | PC | PC | 41,629 | 59.12% | 23,007 | 32.68% | 73.87% | 41,629 | 18,622 | 10,159 | – | – | – | 70,410 | ||||
| York South | NDP | NDP | 12,915 | 48.01% | 2,877 | 10.69% | 69.53% | 10,038 | 3,949 | 12,915 | – | – | – | 26,902 | ||||
| York West | PC | PC | 26,034 | 59.41% | 13,582 | 30.99% | 77.66% | 26,034 | 12,452 | 5,335 | – | – | – | 43,821 | ||||
| Yorkview | NDP | NDP | 20,660 | 43.38% | 6,630 | 13.92% | 71.37% | 12,550 | 14,030 | 20,660 | – | 391 | – | 47,631 |
: = open seat : = turnout is above provincial average : = winning candidate was in previous Legislature : = not incumbent; was previously elected to the Legislature : = incumbent had switched allegiance : = incumbency arose from byelection gain : = previously incumbent in another riding : = other incumbents renominated
Analysis
| Party in 1st place | Party in 2nd place | Total | PC | Lib | NDP | Ind |
|---|---|---|---|---|---|---|
| 40 | 37 | 1 | 78 | |||
| 15 | 5 | 20 | ||||
| 15 | 4 | 19 | ||||
| Total | 30 | 44 | 42 | 1 | 117 |
| Parties | 1st | 2nd | 3rd | 4th | 5th |
|---|---|---|---|---|---|
| 78 | 30 | 9 | |||
| 20 | 44 | 53 | |||
| 19 | 42 | 54 | 2 | ||
| 1 | 1 | 20 | 1 | ||
| 4 | |||||
| 3 | 2 |
| Source | Party | Total | |||
|---|---|---|---|---|---|
| align="center" | **PC** | align="center" | **Lib** | align="center" | **NDP** |
| Seats retained | Incumbents returned | 50 | |||
| Open seats held | 15 | ||||
| Byelection loss reversed | 1 | ||||
| Seats changing hands | Incumbents defeated | 10 | |||
| Open seats gained | 2 | 1 | |||
| Incumbent changed allegiance | 1 | ||||
| **Total** | 78 | 20 |
Seats changing hands
Of the 117 seats, 22 were open because of MPPs who chose not to stand for reelection, and voters in only 19 seats changed allegiance from the previous election in 2018.
Tom Reid (Rainy River) had previously campaigned on the Liberal-Labour ticket, but sat with the Liberal caucus. In 1971, he opted to stand as a Liberal instead.
| Party | 1967 | Gain from (loss to) | 1971 | PC | Lib | NDP |
|---|---|---|---|---|---|---|
| 69 | 6 | (1) | 6 | (2) | ||
| **Total** | 117 | 3 | (12) | 10 | (1) | 6 |
There were 19 seats that changed allegiance in the election:
; PC to Liberal
- Ottawa East
- York-Forest Hill
; PC to NDP
- Nickel Belt
; Liberal to PC
- Algoma—Manitoulin
- Niagara Falls
- Oxford
- Dovercourt
- Humber
- Scarborough East
; Liberal to NDP
- Ottawa Centre
- Port Arthur
- Sudbury
- Parkdale
; NDP to PC
- Brantford
- Oshawa
- Peterborough
- Temiskaming
- Beaches—Woodbine
- Scarborough Centre
References
References
- "1971 General Election".
- {{Cite canlaw. (1971)
- . ["1971 general election results"](https://results.elections.on.ca/en/data-explorer?fromYear=1867&toYear=2019&electionType=GE&electionId=275). *[[Elections Ontario]]*.
This article was imported from Wikipedia and is available under the Creative Commons Attribution-ShareAlike 4.0 License. Content has been adapted to SurfDoc format. Original contributors can be found on the article history page.
Ask Mako anything about 1971 Ontario general election — get instant answers, deeper analysis, and related topics.
Research with MakoFree with your Surf account
Create a free account to save articles, ask Mako questions, and organize your research.
Sign up freeThis content may have been generated or modified by AI. CloudSurf Software LLC is not responsible for the accuracy, completeness, or reliability of AI-generated content. Always verify important information from primary sources.
Report