From Surf Wiki (app.surf) — the open knowledge base
1967 Ontario general election
Canadian provincial election
Canadian provincial election
| Field | Value | |
|---|---|---|
| election_name | 1967 Ontario general election | |
| country | Ontario | |
| type | parliamentary | |
| ongoing | no | |
| party_colour | no | |
| party_name | no | |
| previous_election | 1963 Ontario general election | |
| previous_year | 1963 | |
| previous_mps | 27th Legislative Assembly of Ontario | |
| next_election | 1971 Ontario general election | |
| next_year | 1971 | |
| elected_mps | 28th Legislative Assembly of Ontario | |
| seats_for_election | 117 seats in the [28th Legislative Assembly of Ontario](28th-legislative-assembly-of-ontario) | |
| 59 seats were needed for a majority | ||
| election_date | October 17, 1967 | |
| image1 | [[File:John Robarts, Premier of Ontario (cropped).jpg | 160x160px]] |
| colour1 | ||
| leader1 | John Robarts | |
| leader_since1 | [October 25, 1961](1961-progressive-conservative-party-of-ontario-leadership-election) | |
| party1 | ||
| leaders_seat1 | London North | |
| last_election1 | 77 | |
| seats1 | 69 | |
| seat_change1 | 8 | |
| percentage1 | 42.3% | |
| swing1 | 6.6pp | |
| image2 | [[File:Robert Nixon-c1971 (3x4).jpg | 160x160px]] |
| colour2 | ||
| leader2 | Robert Nixon | |
| leader_since2 | January 6, 1967 | |
| party2 | ||
| leaders_seat2 | Brant | |
| last_election2 | 24 | |
| seats2 | 28 | |
| seat_change2 | 4 | |
| percentage2 | 31.6% | |
| swing2 | 3.7pp | |
| image3 | [[File:Donald c macdonald (cropped).PNG | x160px]] |
| colour3 | ||
| leader3 | Donald C. MacDonald | |
| leader_since3 | November 21, 1953 | |
| party3 | ||
| leaders_seat3 | York South | |
| last_election3 | 7 | |
| seats3 | 20 | |
| seat_change3 | 13 | |
| percentage3 | 25.9% | |
| swing3 | 10.4pp | |
| title | Premier | |
| posttitle | Premier after election | |
| before_election | John Robarts | |
| before_party | ||
| after_election | John Robarts | |
| after_party |
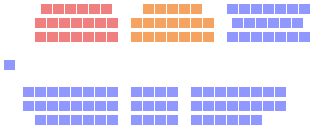
59 seats were needed for a majority |}} The 1967 Ontario general election was held on October 17, 1967, to elect the 117 members of the 28th Legislative Assembly of Ontario (Members of Provincial Parliament, or "MPPs") of the Province of Ontario, Canada.
The Ontario Progressive Conservative Party, led by John Robarts, won an eighth consecutive term in office, and maintained its majority in the legislature despite losing eight seats from its result in the previous election.
The Ontario Liberal Party, led by Robert Nixon, increased its caucus from 24 to 28 members, and continued in the role of official opposition. T. Patrick Reid of Rainy River was elected as a Liberal-Labour MPP. He replaced Robert Gibson, the late MPP for Kenora as the legislature's sole Liberal-Labour MPP.
The social democratic Ontario New Democratic Party, led by Donald C. MacDonald, increased its caucus in the legislature from 7 members to 20.
Expansion of the Legislative Assembly
The size of the Legislative Assembly was increased from 108 to 117 members, mainly through the reorganization of ridings outside Toronto:
| Abolished ridings | New ridings | *Drawn from parts of other ridings* | *Abolished ridings* | *Reorganization of ridings* | *Merger of ridings* | *Division of ridings* | *Renaming of ridings* |
|---|
Results
Summary
|-
! colspan=2 rowspan=2 | Political party
! rowspan=2 | Party leader
! colspan=4 | MNAs
! colspan=4 | Votes
|-
! Candidates
!1967
!±
!#
! ±
!%
! ± (pp)
| 117 || 77 || 69 || 8 || 1,018,755 || 33,985 || 42.10% || 6.51
| 115 || 23 || 27 || 4 || 762,340 || 8,308 || 31.51% || 3.31
| 2 || 1 || 1 || || 5,051 || 1,723 || 0.21% || 0.10
| 117 || 7 || 20 || 13 || 628,397 || 288,189 || 25.97% || 10.26
| || 5 || – || – || – || 2,382 || 377 || 0.10% || 0.03
| 2 || – || – || – || 592 || 1,062 || 0.02% || 0.06
| || 1 || – || – || – || 287 || 184 || 0.01% || 0.01
|-
! colspan="3" style="text-align:left;" | Total
|366||108
! " colspan="2"|117
! " colspan="2"|2,419,710
! " colspan="2"| 100.00%
|-
| 19,528
| 1.223 |
|---|
| 2,439,238 |
| 255,160 |
| 66.18 |
| 2.65 |
| - |
| 3,685,755 |
| 247,921 |
| } |
Vote and seat summaries
|File:Ternary ON1963.svg |1963 |File:Ternary ON1967.svg |1967
| Party | Seats | Votes | Change (pp) | |
|---|---|---|---|---|
| {{bartable | -6.51 | |||
| {{bartable | -3.31 | |||
| {{bartable | -0.10 | |||
| {{bartable | 10.26 | |||
| {{bartable | -0.03 | |||
| {{bartable | -0.31 |
Synopsis of results
| Riding | Winning party | Turnout | |||||||||||||||
|---|---|---|---|---|---|---|---|---|---|---|---|---|---|---|---|---|---|
| including spoilt ballots | Votes | Nameorder is as given in EO reports | **[1963](1963-ontario-general-election)** | Party | Votes | Share | Margin | ||||||||||
| # | Margin | ||||||||||||||||
| % | PC | Lib/LL | NDP | Ind | Oth | Total | |||||||||||
| Algoma | *New* | PC | 3,956 | 40.25% | 888 | 9.03% | 66.73% | 3,956 | 3,068 | 2,805 | – | – | 9,829 | ||||
| Algoma—Manitoulin | Lib | Lib | 4,424 | 45.12% | 1,402 | 14.30% | 67.62% | 3,022 | 4,424 | 2,358 | – | – | 9,804 | ||||
| Brant | Lib | Lib | 7,859 | 57.21% | 3,683 | 26.81% | 67.44% | 4,176 | 7,859 | 1,702 | – | – | 13,737 | ||||
| Brantford | Lib | NDP | 10,465 | 35.84% | 497 | 1.70% | 74.63% | 9,968 | 8,764 | 10,465 | – | – | 29,197 | ||||
| Carleton | PC | PC | 10,506 | 50.99% | 3,810 | 18.49% | 62.08% | 10,506 | 6,696 | 3,404 | – | – | 20,606 | ||||
| Carleton East | *New* | PC | 9,111 | 60.24% | 4,172 | 27.58% | 52.49% | 9,111 | 4,939 | 1,075 | – | – | 15,125 | ||||
| Chatham—Kent | *New* | PC | 8,575 | 48.18% | 1,396 | 7.84% | 60.58% | 8,575 | 7,179 | 2,044 | – | – | 17,798 | ||||
| Cochrane North | PC | PC | 7,536 | 58.63% | 3,998 | 31.10% | 67.18% | 7,536 | 1,780 | 3,538 | – | – | 12,854 | ||||
| Cochrane South | PC | NDP | 8,377 | 43.51% | 801 | 4.16% | 71.51% | 7,576 | 3,302 | 8,377 | – | – | 19,255 | ||||
| Dufferin—Simcoe | PC | PC | 7,973 | 57.88% | 4,115 | 29.88% | 52.77% | 7,973 | 3,858 | 1,943 | – | – | 13,774 | ||||
| Durham | PC | PC | 7,650 | 45.27% | 2,567 | 15.19% | 72.35% | 7,650 | 5,083 | 4,164 | – | – | 16,897 | ||||
| Elgin | PC | PC | 10,662 | 44.95% | 485 | 2.04% | 68.23% | 10,662 | 10,177 | 1,535 | 1,348 | – | 23,722 | ||||
| Essex—Kent | *New* | Lib | 5,829 | 47.48% | 991 | 8.07% | 66.36% | 4,838 | 5,829 | 1,609 | – | – | 12,276 | ||||
| Essex South | Lib | Lib | 10,476 | 59.85% | 5,054 | 28.88% | 66.16% | 5,422 | 10,476 | 1,605 | – | – | 17,503 | ||||
| Fort William | NDP | PC | 7,744 | 34.32% | 208 | 0.92% | 75.76% | 7,744 | 7,536 | 7,282 | – | – | 22,562 | ||||
| Frontenac—Addington | PC | PC | 6,888 | 52.79% | 3,013 | 23.09% | 61.29% | 6,888 | 3,875 | 2,285 | – | – | 13,048 | ||||
| Glengarry | PC | PC | 6,214 | 52.97% | 1,441 | 12.28% | 74.31% | 6,214 | 4,773 | 745 | – | – | 11,732 | ||||
| Grenville—Dundas | PC | PC | 7,905 | 59.54% | 3,009 | 22.66% | 58.52% | 7,905 | 4,896 | 475 | – | – | 13,276 | ||||
| Grey—Bruce | *New* | Lib | 10,837 | 46.62% | 2,298 | 9.89% | 75.72% | 8,539 | 10,837 | 3,869 | – | – | 23,245 | ||||
| Grey South | Lib | PC | 8,872 | 59.68% | 4,116 | 27.69% | 71.02% | 8,872 | 4,756 | 1,126 | 111 | – | 14,865 | ||||
| Haldimand—Norfolk | PC | PC | 11,768 | 53.28% | 4,272 | 19.34% | 69.75% | 11,768 | 7,496 | 2,603 | – | 221 | 22,088 | ||||
| Halton East | *New* | PC | 9,867 | 38.05% | 164 | 0.63% | 66.87% | 9,867 | 9,703 | 6,359 | – | – | 25,929 | ||||
| Halton West | *New* | PC | 13,709 | 49.10% | 5,886 | 21.08% | 66.79% | 13,709 | 6,389 | 7,823 | – | – | 27,921 | ||||
| Hamilton Centre | PC | NDP | 8,922 | 45.47% | 2,309 | 11.77% | 61.89% | 4,086 | 6,613 | 8,922 | – | – | 19,621 | ||||
| Hamilton East | NDP | NDP | 11,843 | 51.95% | 6,084 | 26.69% | 64.82% | 5,759 | 5,193 | 11,843 | – | – | 22,795 | ||||
| Hamilton Mountain | *New* | PC | 12,105 | 44.60% | 1,083 | 3.99% | 67.98% | 12,105 | 3,846 | 11,022 | – | 166 | 27,139 | ||||
| Hamilton West | PC | PC | 8,625 | 37.73% | 1,398 | 6.12% | 64.61% | 8,625 | 7,227 | 7,005 | – | – | 22,857 | ||||
| Hastings | *New* | PC | 8,575 | 68.64% | 6,032 | 48.29% | 67.98% | 8,575 | 2,543 | 1,374 | – | – | 12,492 | ||||
| Huron | PC | PC | 8,353 | 62.20% | 4,619 | 34.39% | 72.03% | 8,353 | 3,734 | 1,343 | – | – | 13,430 | ||||
| Huron—Bruce | Lib | Lib | 9,166 | 57.10% | 3,188 | 19.86% | 82.07% | 5,978 | 9,166 | 908 | – | – | 16,052 | ||||
| Kenora | LL | PC | 8,297 | 58.00% | 4,211 | 29.44% | 64.83% | 8,297 | 1,921 | 4,086 | – | – | 14,304 | ||||
| Kent | *New* | Lib | 7,668 | 51.02% | 913 | 6.07% | 76.94% | 6,755 | 7,668 | 606 | – | – | 15,029 | ||||
| Kingston and the Islands | PC | PC | 10,246 | 47.12% | 2,365 | 10.88% | 66.05% | 10,246 | 7,881 | 3,617 | – | – | 21,744 | ||||
| Kitchener | *New* | Lib | 10,350 | 34.29% | 52 | 0.17% | 64.69% | 9,096 | 10,350 | 10,298 | – | 441 | 30,185 | ||||
| Lambton | *New* | PC | 8,481 | 54.29% | 2,374 | 15.20% | 69.62% | 8,481 | 6,107 | 1,035 | – | – | 15,623 | ||||
| Lanark | PC | PC | 9,505 | 70.14% | 6,379 | 47.07% | 59.88% | 9,505 | 3,126 | 921 | – | – | 13,552 | ||||
| Leeds | PC | PC | 12,127 | 68.38% | 7,413 | 41.80% | 64.81% | 12,127 | 4,714 | 895 | – | – | 17,736 | ||||
| Lincoln | PC | PC | 13,334 | 59.28% | 8,597 | 38.22% | 64.89% | 13,334 | 4,737 | 4,424 | – | – | 22,495 | ||||
| London North | PC | PC | 13,087 | 49.14% | 4,100 | 15.39% | 56.86% | 13,087 | 8,987 | 4,559 | – | – | 26,633 | ||||
| London South | PC | PC | 15,116 | 53.85% | 6,999 | 24.93% | 64.19% | 15,116 | 8,117 | 4,836 | – | – | 28,069 | ||||
| Middlesex North | PC | PC | 5,744 | 52.78% | 2,425 | 22.28% | 67.01% | 5,744 | 3,319 | 1,819 | – | – | 10,882 | ||||
| Middlesex South | PC | PC | 8,423 | 44.47% | 2,558 | 13.50% | 63.19% | 8,423 | 5,865 | 4,654 | – | – | 18,942 | ||||
| Muskoka | PC | PC | 6,458 | 61.99% | 4,457 | 42.78% | 67.13% | 6,458 | 2,001 | 1,959 | – | – | 10,418 | ||||
| Niagara Falls | Lib | Lib | 10,451 | 51.16% | 3,763 | 18.42% | 60.29% | 6,688 | 10,451 | 3,291 | – | – | 20,430 | ||||
| Nickel Belt | PC | PC | 6,210 | 47.63% | 1,234 | 9.47% | 75.43% | 6,210 | 1,851 | 4,976 | – | – | 13,037 | ||||
| Nipissing | Lib | Lib | 9,471 | 42.98% | 321 | 1.46% | 70.95% | 9,150 | 9,471 | 3,417 | – | – | 22,038 | ||||
| Northumberland | PC | PC | 10,411 | 57.62% | 3,819 | 21.14% | 73.01% | 10,411 | 6,592 | 1,066 | – | – | 18,069 | ||||
| Ontario | PC | PC | 7,513 | 55.15% | 3,931 | 28.86% | 65.14% | 7,513 | 3,582 | 2,528 | – | – | 13,623 | ||||
| Ontario South | *New* | PC | 9,190 | 39.57% | 1,296 | 5.58% | 71.74% | 9,190 | 5,975 | 7,894 | – | 166 | 23,225 | ||||
| Oshawa | PC | NDP | 13,182 | 43.79% | 2,080 | 6.91% | 70.02% | 11,102 | 5,821 | 13,182 | – | – | 30,105 | ||||
| Ottawa Centre | *New* | Lib | 7,688 | 43.07% | 715 | 4.01% | 52.83% | 6,973 | 7,688 | 3,190 | – | – | 17,851 | ||||
| Ottawa East | Lib | PC | 8,155 | 46.44% | 12 | 0.07% | 50.70% | 8,155 | 8,143 | 1,263 | – | – | 17,561 | ||||
| Ottawa South | PC | PC | 13,472 | 47.51% | 1,121 | 3.95% | 61.78% | 13,472 | 12,351 | 2,531 | – | – | 28,354 | ||||
| Ottawa West | PC | PC | 12,707 | 49.41% | 5,964 | 23.19% | 60.81% | 12,707 | 6,743 | 6,266 | – | – | 25,716 | ||||
| Oxford | PC | Lib | 12,323 | 44.35% | 1,368 | 4.92% | 72.59% | 10,955 | 12,323 | 4,507 | – | – | 27,785 | ||||
| Parry Sound | PC | PC | 7,813 | 56.15% | 2,794 | 20.08% | 67.60% | 7,813 | 5,019 | 1,083 | – | – | 13,915 | ||||
| Peel North | *New* | PC | 15,651 | 52.30% | 8,236 | 27.52% | 65.27% | 15,651 | 6,861 | 7,415 | – | – | 29,927 | ||||
| Peel South | *New* | PC | 13,377 | 42.13% | 3,618 | 11.39% | 67.94% | 13,377 | 9,759 | 8,616 | – | – | 31,752 | ||||
| Perth | PC | Lib | 9,971 | 43.45% | 187 | 0.81% | 65.70% | 9,784 | 9,971 | 3,191 | – | – | 22,946 | ||||
| Peterborough | PC | NDP | 15,432 | 45.34% | 2,759 | 8.11% | 74.64% | 12,673 | 5,930 | 15,432 | – | – | 34,035 | ||||
| Port Arthur | PC | Lib | 7,636 | 37.56% | 810 | 3.98% | 71.21% | 6,826 | 7,636 | 5,866 | – | – | 20,328 | ||||
| Prescott and Russell | *New* | PC | 8,406 | 58.48% | 3,274 | 22.78% | 66.46% | 8,406 | 5,132 | 835 | – | – | 14,373 | ||||
| Prince Edward—Lennox | PC | PC | 7,471 | 57.76% | 3,371 | 26.06% | 60.54% | 7,471 | 4,100 | 1,363 | – | – | 12,934 | ||||
| Quinte | *New* | PC | 11,410 | 52.23% | 4,091 | 18.73% | 74.41% | 11,410 | 7,319 | 3,117 | – | – | 21,846 | ||||
| Rainy River | PC | LL | 3,130 | 34.29% | 41 | 0.45% | 63.93% | 3,089 | 3,130 | 2,908 | – | – | 9,127 | ||||
| Renfrew North | PC | PC | 10,401 | 62.15% | 4,916 | 29.37% | 66.33% | 10,401 | 5,485 | 850 | – | – | 16,736 | ||||
| Renfrew South | PC | PC | 7,776 | 52.77% | 1,389 | 9.43% | 75.85% | 7,776 | 6,387 | 572 | – | – | 14,735 | ||||
| St. Catharines | *New* | PC | 12,235 | 45.90% | 3,948 | 14.81% | 60.99% | 12,235 | 8,287 | 6,134 | – | – | 26,656 | ||||
| Sandwich—Riverside | *New* | NDP | 8,312 | 35.65% | 799 | 3.43% | 65.50% | 7,492 | 7,513 | 8,312 | – | – | 23,317 | ||||
| Sarnia | *New* | Lib | 9,590 | 44.20% | 1,092 | 5.03% | 60.68% | 8,498 | 9,590 | 3,611 | – | – | 21,699 | ||||
| Sault Ste. Marie | PC | PC | 11,807 | 42.21% | 2,010 | 7.18% | 77.85% | 11,807 | 6,371 | 9,797 | – | – | 27,975 | ||||
| Simcoe Centre | PC | PC | 10,814 | 52.03% | 2,530 | 12.17% | 66.22% | 10,814 | 8,284 | 1,686 | – | – | 20,784 | ||||
| Simcoe East | PC | PC | 9,057 | 54.54% | 4,717 | 28.41% | 61.19% | 9,057 | 4,340 | 3,208 | – | – | 16,605 | ||||
| Stormont | PC | PC | 10,942 | 57.63% | 5,268 | 27.75% | 66.36% | 10,942 | 5,674 | 2,371 | – | – | 18,987 | ||||
| Sudbury | Lib | Lib | 9,945 | 40.13% | 2,540 | 10.25% | 69.05% | 7,405 | 9,945 | 7,266 | – | 167 | 24,783 | ||||
| Sudbury East | *New* | NDP | 7,454 | 37.06% | 1,200 | 5.97% | 72.90% | 6,254 | 6,088 | 7,454 | – | 319 | 20,115 | ||||
| Thunder Bay | *New* | NDP | 4,064 | 37.57% | 310 | 2.87% | 68.40% | 3,000 | 3,754 | 4,064 | – | – | 10,818 | ||||
| Temiskaming | PC | NDP | 7,328 | 41.89% | 293 | 1.67% | 72.75% | 7,035 | 3,131 | 7,328 | – | – | 17,494 | ||||
| Victoria—Haliburton | PC | PC | 7,683 | 45.42% | 1,836 | 10.85% | 71.44% | 7,683 | 5,847 | 3,384 | – | – | 16,914 | ||||
| Waterloo North | PC | Lib | 8,336 | 36.79% | 1,272 | 5.61% | 59.37% | 7,064 | 8,336 | 6,890 | – | 370 | 22,660 | ||||
| Waterloo South | PC | PC | 10,044 | 44.68% | 721 | 3.21% | 70.49% | 10,044 | 3,112 | 9,323 | – | – | 22,479 | ||||
| Welland | PC | PC | 9,970 | 42.15% | 260 | 1.10% | 73.42% | 9,970 | 3,971 | 9,710 | – | – | 23,651 | ||||
| Welland South | *New* | Lib | 7,322 | 38.47% | 107 | 0.56% | 68.80% | 7,215 | 7,322 | 4,497 | – | – | 19,034 | ||||
| Wellington—Dufferin | PC | PC | 7,068 | 60.76% | 3,809 | 32.74% | 61.41% | 7,068 | 3,259 | 1,306 | – | – | 11,633 | ||||
| Wellington South | Lib | Lib | 12,553 | 46.91% | 4,427 | 16.54% | 73.97% | 8,126 | 12,553 | 6,082 | – | – | 26,761 | ||||
| Wentworth | PC | NDP | 9,183 | 43.83% | 1,984 | 9.47% | 66.69% | 7,199 | 4,571 | 9,183 | – | – | 20,953 | ||||
| Wentworth North | *New* | PC | 10,002 | 48.80% | 3,660 | 17.86% | 73.73% | 10,002 | 4,152 | 6,342 | – | – | 20,496 | ||||
| Windsor—Walkerville | Lib | Lib | 10,001 | 44.07% | 1,799 | 7.93% | 62.21% | 4,490 | 10,001 | 8,202 | – | – | 22,693 | ||||
| Windsor West | *New* | NDP | 8,618 | 37.66% | 986 | 4.31% | 59.73% | 6,633 | 7,632 | 8,618 | – | – | 22,883 | ||||
| York Centre | *New* | Lib | 10,025 | 40.77% | 1,068 | 4.34% | 68.17% | 8,957 | 10,025 | 5,605 | – | – | 24,587 | ||||
| York North | PC | PC | 8,394 | 42.46% | 2,127 | 10.76% | 63.52% | 8,394 | 6,267 | 5,109 | – | – | 19,770 | ||||
| Armourdale | PC | PC | 10,721 | 44.32% | 3,855 | 15.94% | 66.38% | 10,721 | 6,866 | 6,602 | – | – | 24,189 | ||||
| Beaches—Woodbine | *New* | NDP | 10,522 | 43.58% | 545 | 2.26% | 66.78% | 9,977 | 3,646 | 10,522 | – | – | 24,145 | ||||
| Bellwoods | PC | PC | 6,647 | 47.34% | 2,429 | 17.30% | 64.74% | 6,647 | 4,218 | 2,684 | 491 | – | 14,040 | ||||
| Don Mills | PC | PC | 9,646 | 41.45% | 899 | 3.86% | 66.43% | 9,646 | 4,656 | 8,747 | – | 222 | 23,271 | ||||
| Dovercourt | Lib | Lib | 6,053 | 37.93% | 1,169 | 7.33% | 57.38% | 4,884 | 6,053 | 4,594 | – | 426 | 15,957 | ||||
| Downsview | Lib | Lib | 8,876 | 36.56% | 21 | 0.09% | 58.90% | 6,290 | 8,876 | 8,855 | 260 | – | 24,281 | ||||
| Eglinton | PC | PC | 15,220 | 54.24% | 6,827 | 24.33% | 77.88% | 15,220 | 8,393 | 4,449 | – | – | 28,062 | ||||
| Etobicoke | Lib | Lib | 13,120 | 42.79% | 3,982 | 12.99% | 69.64% | 8,402 | 13,120 | 9,138 | – | – | 30,660 | ||||
| High Park | PC | NDP | 12,892 | 49.61% | 6,275 | 24.15% | 70.63% | 6,477 | 6,617 | 12,892 | – | – | 25,986 | ||||
| Humber | PC | Lib | 8,038 | 34.50% | 149 | 0.64% | 64.79% | 7,370 | 8,038 | 7,889 | – | – | 23,297 | ||||
| Lakeshore | PC | NDP | 10,029 | 48.45% | 2,993 | 14.46% | 64.39% | 7,036 | 3,633 | 10,029 | – | – | 20,698 | ||||
| Parkdale | Lib | Lib | 5,588 | 38.63% | 810 | 5.60% | 61.40% | 4,099 | 5,588 | 4,778 | – | – | 14,465 | ||||
| Riverdale | PC | NDP | 10,716 | 53.96% | 4,549 | 22.91% | 60.11% | 6,167 | 2,690 | 10,716 | – | 287 | 19,860 | ||||
| St. Andrew—St. Patrick | *New* | PC | 6,142 | 40.97% | 1,172 | 7.82% | 58.45% | 6,142 | 4,970 | 3,707 | 172 | – | 14,991 | ||||
| St. David | PC | PC | 7,581 | 36.62% | 815 | 3.94% | 64.28% | 7,581 | 6,766 | 6,354 | – | – | 20,701 | ||||
| St. George | PC | PC | 9,708 | 44.17% | 2,482 | 11.29% | 58.82% | 9,708 | 7,226 | 5,046 | – | – | 21,980 | ||||
| Scarborough Centre | PC | NDP | 12,892 | 49.61% | 6,275 | 24.15% | 71.26% | 6,477 | 6,617 | 12,892 | – | – | 25,986 | ||||
| Scarborough East | PC | Lib | 6,538 | 34.20% | 220 | 1.15% | 67.67% | 6,318 | 6,538 | 6,260 | – | – | 19,116 | ||||
| Scarborough North | PC | PC | 11,729 | 42.03% | 1,527 | 5.47% | 70.66% | 11,729 | 5,977 | 10,202 | – | – | 27,908 | ||||
| Scarborough West | NDP | NDP | 13,225 | 48.12% | 4,821 | 17.54% | 69.11% | 8,404 | 5,856 | 13,225 | – | – | 27,485 | ||||
| York East | PC | PC | 12,691 | 44.80% | 4,456 | 15.73% | 64.92% | 12,691 | 8,235 | 7,402 | – | – | 28,328 | ||||
| York-Forest Hill | PC | PC | 12,087 | 43.86% | 3,644 | 13.22% | 62.19% | 12,087 | 7,030 | 8,443 | – | – | 27,560 | ||||
| York Mills | PC | PC | 22,192 | 50.08% | 6,490 | 14.65% | 64.60% | 22,192 | 15,702 | 6,418 | – | – | 44,312 | ||||
| York South | NDP | NDP | 13,073 | 62.59% | 7,990 | 38.25% | 59.78% | 5,083 | 2,732 | 13,073 | – | – | 20,888 | ||||
| York West | PC | PC | 14,780 | 47.53% | 2,351 | 7.56% | 65.77% | 14,780 | 12,429 | 3,885 | – | – | 31,094 | ||||
| Yorkview | NDP | NDP | 13,437 | 46.00% | 3,073 | 10.52% | 62.27% | 5,413 | 10,364 | 13,437 | – | – | 29,214 |
: = open seat : = turnout is above provincial average : = winning candidate was in previous Legislature : = not incumbent; was previously elected to the Legislature : = incumbent had switched allegiance : = incumbency arose from byelection gain : = previously incumbent in another riding : = other incumbents renominated : = previously an MP in the House of Commons of Canada : = Liberal-Labour candidate : = multiple candidates
Analysis
| Party in 1st place | Party in 2nd place | Total | PC | Lib | NDP |
|---|---|---|---|---|---|
| 55 | 14 | 69 | |||
| 21 | 6 | 27 | |||
| 1 | 1 | ||||
| 13 | 7 | 20 | |||
| Total | 35 | 62 | 20 | 117 |
| Parties | 1st | 2nd | 3rd | 4th |
|---|---|---|---|---|
| 69 | 35 | 13 | ||
| 27 | 62 | 26 | ||
| 20 | 20 | 77 | ||
| 1 | 1 | |||
| 7 | ||||
| 5 | ||||
| 2 | ||||
| 1 |
| Source | Party | Total | |||
|---|---|---|---|---|---|
| align="center" | **PC** | align="center" | **Lib** | align="center" | **Lib-Lab** |
| Seats retained | Incumbents returned | 45 | |||
| Open seats held | 4 | 1 | |||
| Seats changing hands | Incumbents defeated | 2 | |||
| Open seats gained | 1 | 1 | |||
| Byelection gains held | 1 | ||||
| New ridings | New MPPs | 9 | |||
| Won by previous incumbent from another riding | 7 | 2 | |||
| **Total** | 69 | 27 |
Incumbents standing in other ridings
Eleven MPPs lost their seats in the current redistribution and sought reelection elsewhere. A further four chose to campaign in another riding.
| Member | From | To | *Original riding abolished* | *Moved over to other riding* | *Failed to secure reelection* | |
|---|---|---|---|---|---|---|
| Bert Lawrence | Russell | Carleton East | ||||
| Darcy McKeough | Kent West | Chatham—Kent | ||||
| Eddie Sargent | Grey North | Grey—Bruce | ||||
| George Kerr | Halton | Halton West | ||||
| Reg Gisborn | Wentworth East | Hamilton Eastnot a new riding | ||||
| Jack Spence | Kent East | Kent | ||||
| Lorne Henderson | Lambton East | Lambton | ||||
| Bill Davis | Peel | Peel North | ||||
| Allan Grossman | St. Andrew | St. Andrew—St. Patrick | ||||
| Norman Davison | Hamilton East | Hamilton Centre | ||||
| Ada Pritchard | Hamilton Centre | Hamilton West | ||||
| Ray Connell | Hamilton—Wentworthname changed to Hamilton West | Wentworth Northnew riding | ||||
| Keith Butler | Waterloo North | Kitchenerdefeated by Jim Breithaupt (Liberal) | ||||
| Ivan Thrasher | Windsor—Sandwichabolished riding | Windsor Westdefeated by Hugh Peacock (NDP) | ||||
| Jack Harris | Beaches | Beaches—Woodbinedefeated by John L. Brown (NDP) |
References
References
- "1967 General Election".
- {{Cite canlaw. (1966)
- . ["1967 general election results"](https://results.elections.on.ca/en/data-explorer?fromYear=1867&toYear=2019&electionType=GE&electionId=273). *[[Elections Ontario]]*.
This article was imported from Wikipedia and is available under the Creative Commons Attribution-ShareAlike 4.0 License. Content has been adapted to SurfDoc format. Original contributors can be found on the article history page.
Ask Mako anything about 1967 Ontario general election — get instant answers, deeper analysis, and related topics.
Research with MakoFree with your Surf account
Create a free account to save articles, ask Mako questions, and organize your research.
Sign up freeThis content may have been generated or modified by AI. CloudSurf Software LLC is not responsible for the accuracy, completeness, or reliability of AI-generated content. Always verify important information from primary sources.
Report