From Surf Wiki (app.surf) — the open knowledge base
1974 United States House of Representatives elections
House elections for the 94th U.S. Congress

House elections for the 94th U.S. Congress
| Field | Value | |
|---|---|---|
| election_name | 1974 United States House of Representatives elections | |
| country | United States | |
| flag_year | 1960 | |
| type | legislative | |
| ongoing | no | |
| previous_election | 1972 United States House of Representatives elections | |
| previous_year | 1972 | |
| election_date | November 5, 1974 | |
| next_election | 1976 United States House of Representatives elections | |
| next_year | 1976 | |
| outgoing_members | 93rd United States Congress#House of Representatives_3 | |
| elected_members | 94th United States Congress#House of Representatives_3 | |
| seats_for_election | All 435 seats in the United States House of Representatives | |
| majority_seats | 218 | |
| image_size | x180px | |
| party1 | Democratic Party (US) | |
| image1 | Speaker Carl Albert (cropped).jpg | |
| leader1 | Carl Albert | |
| leader_since1 | January 21, 1971 | |
| leaders_seat1 | ||
| last_election1 | 242 seats | |
| seats1 | **291** | |
| seat_change1 | 49 | |
| popular_vote1 | **30,054,097** | |
| percentage1 | **57.5%** | |
| swing1 | 5.4 | |
| party2 | Republican Party (US) | |
| image2 | John Jacob Rhodes (cropped).jpg | |
| leader2 | John Rhodes | |
| leader_since2 | December 7, 1973 | |
| leaders_seat2 | ||
| last_election2 | 192 seats | |
| seats2 | 144 | |
| seat_change2 | 48 | |
| popular_vote2 | 21,271,332 | |
| percentage2 | 40.7% | |
| swing2 | 5.8 | |
| map_image | [[File:1974 United States House of Representatives election results by congressional district.svg | 350px]] |
| map_caption | **Results:** | |
| title | Speaker | |
| before_election | Carl Albert | |
| before_party | Democratic Party (US) | |
| after_election | Carl Albert | |
| after_party | Democratic Party (US) |
The 1974 United States House of Representatives elections were elections for the United States House of Representatives on November 5, 1974, to elect members to serve in the 94th United States Congress. They occurred in the wake of the Watergate scandal, which had forced President Richard Nixon to resign in favor of Gerald Ford. This scandal, along with high inflation, allowed the Democrats to make large gains in the midterm elections, taking 48 seats from the Republicans (an additional seat was gained, for a net gain of 49, when Representative Joe Moakley from Massachusetts switched his party affiliation back to Democrat after winning his 1972 election as an independent), and increasing their majority above the two-thirds mark. Altogether, there were 93 freshmen representatives in the 94th Congress when it convened on January 3, 1975 (76 of them Democrats). Those elected to office that year later came to be known collectively as "Watergate Babies." The gain of 49 Democratic seats was the largest pickup by the party since 1958. Only four Democratic incumbents lost their seats.
, this was the last time the Democrats gained 45 or more seats in a House election.
Overall results
391 incumbent members sought reelection, but 8 were defeated in primaries and 40 defeated in the general election for a total of 343 incumbents winning. This was the lowest number and percentage of incumbents who won reelection between 1954 and 1992.
| Democratic Party (US)}}"**Democratic** | Republican Party (US)}}"**Republican** |
|---|
Summary of the November 5, 1974, United States House of Representatives election results
| Parties | Seats | Popular vote | [1972](1972-united-states-house-of-representatives-elections) | 1974 | +/- | Strength | Vote | % | Change | Total | 435 | 435 | 0 | 100.0% | 52,313,457 | 100.0% | - |
|---|---|---|---|---|---|---|---|---|---|---|---|---|---|---|---|---|---|
| Democratic Party | 242 | **291** | +49 | 66.9% | 30,054,097 | 57.5% | +5.4% | ||||||||||
| Republican Party | 192 | **144** | -48 | 33.1% | 21,271,332 | 40.7% | -5.8% | ||||||||||
| Independents | 1 | **0** | -1 | - | 340,501 | 0.7% | +0.5% | ||||||||||
| American Party | 0 | **0** | - | - | 238,265 | 0.5% | +0.2% | ||||||||||
| Conservative Party | 0 | **0** | - | - | 115,980 | 0.2% | -0.1% | ||||||||||
| Liberal Party | 0 | **0** | - | - | 56,714 | 0.1% | -0.1% | ||||||||||
| Peace and Freedom Party | 0 | **0** | - | - | 35,984 | 0.1% | - | ||||||||||
| U.S. Labor Party | 0 | **0** | - | - | 26,342 | 0.1% | +0.1% | ||||||||||
| Economic Justice Party | 0 | **0** | - | - | 16,932 | - | |||||||||||
| Constitution Party | 0 | **0** | - | - | 16,822 | - | |||||||||||
| Socialist Workers Party | 0 | **0** | - | - | 13,982 | -0.1% | |||||||||||
| George Wallace Party | 0 | **0** | - | - | 11,943 | - | |||||||||||
| Communist Party | 0 | **0** | - | - | 10,627 | - | |||||||||||
| Socialist Labor Party | 0 | **0** | - | - | 10,564 | - | |||||||||||
| Liberty Union Party | 0 | **0** | - | - | 9,961 | - | |||||||||||
| Independent Citizens' Action Party | 0 | **0** | - | - | 9,520 | - | |||||||||||
| Prohibition Party | 0 | **0** | - | - | 8,387 | - | |||||||||||
| Life, Liberty, Justice Party | 0 | **0** | - | - | 8,199 | - | |||||||||||
| Human Rights Party | 0 | **0** | - | - | 6,700 | - | |||||||||||
| National Democratic Party | 0 | **0** | - | - | 5,723 | -0.1% | |||||||||||
| Good Neighbor Party | 0 | **0** | - | - | 4,266 | - | |||||||||||
| Politicians Are Crooks Party | 0 | **0** | - | - | 3,460 | - | |||||||||||
| Libertarian Party | 0 | **0** | - | - | 3,099 | - | |||||||||||
| Independent Vermonters Party | 0 | **0** | - | - | 2,641 | - | |||||||||||
| New Leadership Party | 0 | **0** | - | - | 1,778 | - | |||||||||||
| Regular Democracy Party | 0 | **0** | - | - | 1,451 | - | |||||||||||
| Public Congress Party | 0 | **0** | - | - | 1,241 | - | |||||||||||
| Integrity in Government Party | 0 | **0** | - | - | 1,182 | - | |||||||||||
| Anti-monopoly Party | 0 | **0** | - | - | 1,177 | - | |||||||||||
| Christian Party | 0 | **0** | - | - | 583 | - | |||||||||||
| United Citizens Party | 0 | **0** | - | - | 529 | - | |||||||||||
| Others | 0 | **0** | - | - | 6,543 | - |

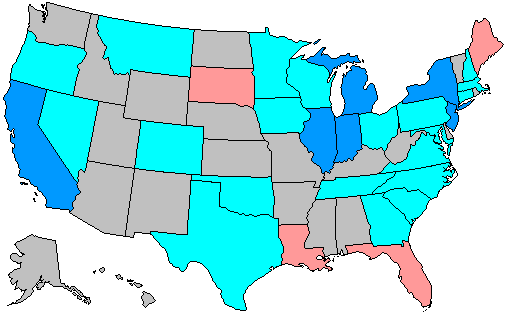
| House seats by party holding plurality in state |
|---|
Special elections
These elections were for the remainder of the term ending January 3, 1975.
|- ! | John Saylor | | Republican | 1952 | | Incumbent died October 28, 1973. A special election was held February 5, 1974. Democratic gain. | nowrap | {{Plainlist|
- John Murtha (Democratic) 49.9%
- Harry M. Fox (Republican) 49.7%
- Duane H. McCormick (Constitution) 0.4%
|- ! | Gerald Ford | | Republican | 1948 | | Incumbent resigned December 6, 1973, to become Vice President of the United States. A special election was held February 18, 1974. Democratic gain. | nowrap | {{Plainlist|
- Richard VanderVeen (Democratic) 50.9%
- Robert VanderLaan (Republican) 44.3%
- Dwight W. Johnson (American Independent) 4.4%
- Frank Girard (Socialist Labor) 0.4%
|- ! | Bill Keating | | Republican | 1970 | | Incumbent resigned January 3, 1974, to take a position as president of The Cincinnati Enquirer. A special election was held March 5, 1974. Democratic gain. | nowrap | {{Plainlist|
- Tom Luken (Democratic) 51.9%
- Bill Gradison (Republican) 48.1%
|- ! | James Harvey | | Republican | 1960 | | Incumbent resigned January 31, 1974, to become judge for the United States District Court for the Eastern District of Michigan. A special election was held April 16, 1974. Democratic gain. | nowrap | {{Plainlist|
- Bob Traxler (Democratic) 51.5%
- James M. Sparling Jr. (Republican) 48.5%
|- ! | Bill Mailliard | | Republican | 1952 | | Incumbent resigned March 5, 1974, to become United States Ambassador to the Organization of American States. A special election was held June 4, 1974. Democratic gain. | nowrap | {{Plainlist|
- John Burton (Democratic) 50.0
- Thomas Caylor (Republican) 21.2%
- Terrence McGuire (Democratic) 8.7%
- Jean Wall (Republican) 5.8%
- Sean McCarthy (Republican) 5.3%
- Alan F. Reeves (Democratic) 4.1%
- Wesley Wilkes (Republican) 2.8%
- Leslie A. Grant (Democratic) 2.1%
|- ! | Charles Teague | | Republican | 1954 | | Incumbent died January 1, 1974. A special election was held June 4, 1974. Republican hold. | nowrap | {{Plainlist|
- Bob Lagomarsino (Republican) 53.6%
- James D. Loebl (Democratic) 18.8%
- James A. Browning (Democratic) 7.8%
- Roger A. Ikola (Democratic) 6.3%
- E. T. Jolicouer (Democratic) 6.0%
- David H. Miller (Democratic) 3.2%
- R. W. Handley (Democratic) 2.4%
- F. Joe Beauchamp (Democratic) 1.9% |}
Alabama
|- ! | Jack Edwards | | Republican | 1964 | Incumbent re-elected. | nowrap | {{Plainlist|
- Jack Edwards (Republican) 59.5%
- Augusta A. Wilson (Democratic) 37.0%
- Mary B. McCarthy (Nat Dem) 3.6%
|- ! | William Louis Dickinson | | Republican | 1964 | Incumbent re-elected. | nowrap | {{Plainlist|
- William Louis Dickinson (Republican) 66.1%
- Clair Chisler (Democratic) 33.9%
|- ! | William Flynt Nichols | | Democratic | 1966 | Incumbent re-elected. | nowrap | {{Plainlist|
- William Flynt Nichols (Democratic) 95.9%
- James R. Connell (Prohibition) 4.1%
|- ! | Tom Bevill | | Democratic | 1966 | Incumbent re-elected. | nowrap | {{Plainlist|
- Tom Bevill (Democratic)
- Unopposed
|- ! | Robert E. Jones Jr. | | Democratic | 1947 (Special) | Incumbent re-elected. | nowrap | {{Plainlist|
- Robert E. Jones Jr. (Democratic)
- Unopposed
|- ! | John Hall Buchanan Jr. | | Republican | 1964 | Incumbent re-elected. | nowrap | {{Plainlist|
- John Hall Buchanan Jr. (Republican) 57.0%
- Nina Miglionico (Democratic) 41.3%
- Elizabeth S. Dillard (Prohibition) 1.7%
|- ! | Walter Flowers | | Democratic | 1968 | Incumbent re-elected. | nowrap | {{Plainlist|
- Walter Flowers (Democratic) 91.0%
- Frank P. Walls (Con) 6.4%
- Lewis Black (Nat Dem) 2.6%
|}
Alaska
Main article: 1974 United States House of Representatives election in Alaska
|- ! | Don Young | | Republican | 1973 (special) | Incumbent re-elected. | nowrap | {{Plainlist|
- Don Young (Republican) 53.8%
- William L. Hensley (Democratic) 46.2%
|}
Arizona
|- ! | John Jacob Rhodes | | Republican | 1952 | Incumbent re-elected. | nowrap | {{Plainlist|
- John Jacob Rhodes (Republican) 51.1%
- Pat Fullinwider (Democratic) 42.3%
- J. M. Sanders (Independent) 6.6%
|- ! | Mo Udall | | Democratic | 1961 (Special) | Incumbent re-elected. | nowrap | {{Plainlist|
- Mo Udall (Democratic) 62.0%
- Keith Dolgaard (Republican) 38.0%
|- ! | Sam Steiger | | Republican | 1966 | Incumbent re-elected. | nowrap | {{Plainlist|
- Sam Steiger (Republican) 51.1%
- Pat Bosch (Democratic) 48.9%
|- ! | John Bertrand Conlan | | Republican | 1972 | Incumbent re-elected. | nowrap | {{Plainlist|
- John Bertrand Conlan (Republican) 55.3%
- Byron T. "Bud" Brown (Democratic) 44.7%
|}
Arkansas
|- ! | William Vollie Alexander Jr. | | Democratic | 1968 | Incumbent re-elected. | nowrap | {{Plainlist|
- William Vollie Alexander Jr. (Democratic) 90.6%
- James Lawrence Dauer (Republican) 9.4%
|- ! | Wilbur Mills | | Democratic | 1938 | Incumbent re-elected. | nowrap | {{Plainlist|
- Wilbur Mills (Democratic) 58.9%
- Judy Petty (Republican) 41.1%
|- ! | John Paul Hammerschmidt | | Republican | 1966 | Incumbent re-elected. | nowrap | {{Plainlist|
- John Paul Hammerschmidt (Republican) 51.8%
- Bill Clinton (Democratic) 48.2%
|- ! | Ray Thornton | | Democratic | 1972 | Incumbent re-elected. | nowrap | {{Plainlist|
- Ray Thornton (Democratic)
- Unopposed
|}
California
Main article: 1974 United States House of Representatives elections in California
|- ! | Bizz Johnson Redistricted from the 2nd district | | Democratic | 1958 | Incumbent re-elected. | nowrap | {{Plainlist|
- Bizz Johnson (Democratic) 85.9%
- Dorothy D. Paradis (American Independent) 14.1%
|- ! | Don Clausen Redistricted from the 1st district | | Republican | 1963 (Special) | Incumbent re-elected. | nowrap | {{Plainlist|
- Don Clausen (Republican) 53.0%
- Oscar Klee (Democratic) 42.7%
- Carole J. Glass (Peace and Freedom) 4.3%
|- ! | John E. Moss | | Democratic | 1952 | Incumbent re-elected. | nowrap | {{Plainlist|
- John E. Moss (Democratic) 72.3%
- Ivaldo Lenci (Republican) 27.7%
|- ! | Robert Leggett | | Democratic | 1962 | Incumbent re-elected. | nowrap | {{Plainlist|
- Robert Leggett (Democratic)
- Unopposed
|- ! | John Burton Redistricted from the 6th district | | Democratic | 1974 | Incumbent re-elected. | nowrap | {{Plainlist|
- John Burton (Democratic) 59.3%
- Thomas Caylor (Republican) 38.0%
- Raymond Broshears (Peace and Freedom) 2.7%
|- ! | Phillip Burton Redistricted from the 5th district | | Democratic | 1964 | Incumbent re-elected. | nowrap | {{Plainlist|
- Phillip Burton (Democratic) 71.4%
- Tom Spinosa (Republican) 21.7%
- Emily L. Siegel (Peace and Freedom) 4.0%
- Carl Richard Davis (American Independent) 2.9%
|- ! | Jerome Waldie Redistricted from the 14th district | | Democratic | 1966 | | Incumbent retired to run for Governor of California. Democratic hold. | nowrap | {{Plainlist|
- George Miller (Democratic) 55.6%
- Gary Fernandez (Republican) 44.4%
|- ! | Ron Dellums Redistricted from the 7th district | | Democratic | 1970 | Incumbent re-elected. | nowrap | {{Plainlist|
- Ron Dellums (Democratic) 56.5%
- Jack Redden (Republican) 39.7%
- John Holland (American Independent) 3.8%
|- ! | Pete Stark Redistricted from the 8th district | | Democratic | 1972 | Incumbent re-elected. | nowrap | {{Plainlist|
- Pete Stark (Democratic) 70.6%
- Edson Adams (Republican) 29.4%
|- ! | Don Edwards Redistricted from the 9th district | | Democratic | 1962 | Incumbent re-elected. | nowrap | {{Plainlist|
- Don Edwards (Democratic) 77.0%
- John M. Enright (Republican) 23.0%
|- ! | Leo Ryan | | Democratic | 1972 | Incumbent re-elected. | nowrap | {{Plainlist|
- Leo Ryan (Democratic) 75.7%
- Brainard "Bee" Merdinger (Republican) 21.3%
- Nicholas W. Kudrovzeff (American Independent) 3.1%
|- ! | Pete McCloskey Redistricted from the 17th district | | Republican | 1967 (Special) | Incumbent re-elected. | nowrap | {{Plainlist|
- Pete McCloskey (Republican) 69.1%
- Gary G. Gillmor (Democratic) 30.9%
|- ! | Charles Gubser Redistricted from the 10th district | | Republican | 1952 | | Incumbent retired. Democratic gain. | nowrap | {{Plainlist|
- Norman Mineta (Democratic) 52.6%
- George W. Milias (Republican) 42.4%
- Elizabeth Cervantes Barron (Peace and Freedom) 2.6%
- Floyd S. Stancliffe (American Independent) 2.5%
|- ! | John J. McFall Redistricted from the 15th district | | Democratic | 1956 | Incumbent re-elected. | nowrap | {{Plainlist|
- John J. McFall (Democratic) 70.8%
- Charles M. "Chuck" Gibson (Republican) 24.1%
- Roger A. Blain (American Independent) 5.1%
|- ! | B. F. Sisk Redistricted from the 16th district | | Democratic | 1954 | Incumbent re-elected. | nowrap | {{Plainlist|
- B. F. Sisk (Democratic) 71.9%
- Carol O. Harner (Republican) 28.1%
|- ! | Burt Talcott Redistricted from the 12th district | | Republican | 1962 | Incumbent re-elected. | nowrap | {{Plainlist|
- Burt Talcott (Republican) 49.2%
- Julian Camacho (Democratic) 47.9%
- D. Jeff Mauro (American Independent) 3.0%
|- ! | Bob Mathias Redistricted from the 18th district | | Republican | 1966 | | Incumbent lost re-election. Democratic gain. | nowrap | {{Plainlist|
- John Hans Krebs (Democratic) 51.9%
- Bob Mathias (Republican) 48.1%
|- ! | William M. Ketchum Redistricted from the 36th district | | Republican | 1972 | Incumbent re-elected. | nowrap | {{Plainlist|
- William M. Ketchum (Republican) 52.6%
- George A. Seielstad (Democratic) 47.4%
|- ! | Robert Lagomarsino Redistricted from the 13th district | | Republican | 1974 | Incumbent re-elected. | nowrap | {{Plainlist|
- Robert Lagomarsino (Republican) 56.5%
- James D. Loebl (Democratic) 43.5%
|- ! | Barry Goldwater Jr. Redistricted from the 27th district | | Republican | 1969 (Special) | Incumbent re-elected. | nowrap | {{Plainlist|
- Barry Goldwater Jr. (Republican) 61.2%
- Arline Mathews (Democratic) 38.8%
|- ! | James C. Corman Redistricted from the 22nd district | | Democratic | 1960 | Incumbent re-elected. | nowrap | {{Plainlist|
- James C. Corman (Democratic) 73.5%
- Mel Nadell (Republican) 26.5%
|- ! | Carlos Moorhead Redistricted from the 20th district | | Republican | 1972 | Incumbent re-elected. | nowrap | {{Plainlist|
- Carlos Moorhead (Republican) 55.7%
- Richard Hallin (Democratic) 44.3%
|- ! | Thomas M. Rees Redistricted from the 26th district | | Democratic | 1965 (Special) | Incumbent re-elected. | nowrap | {{Plainlist|
- Thomas M. Rees (Democratic) 71.5%
- Jack E. Roberts (Republican) 28.5%
|- ! | | New seat. Democratic gain. | nowrap | {{Plainlist|
- Henry Waxman (Democratic) 64.2%
- Elliott Stone Graham (Republican) 32.8%
- David E. Davis (American Independent) 3.0%
|- ! | Edward R. Roybal Redistricted from the 30th district | | Democratic | 1962 | Incumbent re-elected. | nowrap | {{Plainlist|
- Edward R. Roybal (Democratic)
- Unopposed
|- ! | John H. Rousselot Redistricted from the 24th district | | Republican | 1960 1962 (defeated) 1970 (Special) | Incumbent re-elected. | nowrap | {{Plainlist|
- John H. Rousselot (Republican) 58.8%
- Paul A. Conforti (Democratic) 41.2%
|- ! | Alphonzo E. Bell Jr. Redistricted from the 28th district | | Republican | 1960 | Incumbent re-elected. | nowrap | {{Plainlist|
- Alphonzo E. Bell Jr. (Republican) 63.8%
- Michael Shapiro (Democratic) 32.6%
- Jack Hampton (Peace and Freedom) 3.6%
|- ! | Yvonne Brathwaite Burke Redistricted from the 37th district | | Democratic | 1972 | Incumbent re-elected. | nowrap | {{Plainlist|
- Yvonne Brathwaite Burke (Democratic) 80.3%
- Tom Neddy (Republican) 19.7%
|- ! | Augustus Hawkins Redistricted from the 21st district | | Democratic | 1962 | Incumbent re-elected. | nowrap | {{Plainlist|
- Augustus Hawkins (Democratic)
- Unopposed
|- ! rowspan=2 | | George E. Danielson Redistricted from the 29th district | | Democratic | 1970 | Incumbent re-elected.
- George E. Danielson (Democratic) 74.2%
- Richard E. Ferraro Jr. (Republican) 25.8%
|- | Chet Holifield Redistricted from the 19th district | | Democratic | 1942 | | Incumbent retired. Democratic loss.
|- ! | Charles H. Wilson | | Democratic | 1962 | Incumbent re-elected. | nowrap | {{Plainlist|
- Charles H. Wilson (Democratic) 70.5%
- Norman A. Hodges (Republican) 26.8%
- William C. Taylor (Peace and Freedom) 2.7%
|- ! | Glenn M. Anderson Redistricted from the 35th district | | Democratic | 1968 | Incumbent re-elected. | nowrap | {{Plainlist|
- Glenn M. Anderson (Democratic) 87.7%
- Virgil V. Badalich (American Independent) 9.3%
- Frank H. Walker (Peace and Freedom) 3.1%
|- ! | Del M. Clawson Redistricted from the 23rd district | | Republican | 1963 (Special) | Incumbent re-elected. | nowrap | {{Plainlist|
- Del M. Clawson (Republican) 53.4%
- Robert E. White (Democratic) 43.1%
- James C. Griffin (American Independent) 3.5%
|- ! | Craig Hosmer Redistricted from the 32nd district | | Republican | 1952 | | Incumbent retired. Democratic gain. | nowrap | {{Plainlist|
- Mark W. Hannaford (Democratic) 49.7%
- Bill Bond (Republican) 46.3%
- James Manis (American Independent) 2.0%
- John S. Donohue (Peace and Freedom) 1.9%
|- ! | Victor Veysey Redistricted from the 43rd district | | Republican | 1970 | | Incumbent lost re-election. Democratic gain. | nowrap | {{Plainlist|
- James F. Lloyd (Democratic) 50.3%
- Victor Veysey (Republican) 49.7%
|- ! | George Brown Jr. Redistricted from the 38th district | | Democratic | 1962 1970 (Retired) 1972 | Incumbent re-elected. | nowrap | {{Plainlist|
- George Brown Jr. (Democratic) 62.6%
- Jim Osgood (Republican) 32.3%
- William Emery Pasley (American Independent) 5.1%
|- ! | Jerry Pettis Redistricted from the 33rd district | | Republican | 1966 | Incumbent re-elected. | nowrap | {{Plainlist|
- Jerry Pettis (Republican) 63.0%
- Bobby Ray Vincent (Democratic) 33.1%
- John H. Ortman (American Independent) 3.9%
|- ! | Richard T. Hanna Redistricted from the 34th district | | Democratic | 1962 | | Incumbent retired. Democratic hold. | nowrap | {{Plainlist|
- Jerry M. Patterson (Democratic) 54.0%
- David Rehmann (Republican) 41.3%
- Lee R. Rayburn (American Independent) 3.2%
- Larry B. Kallenberger (Peace and Freedom) 1.5%
|- ! | Charles E. Wiggins Redistricted from the 25th district | | Republican | 1966 | Incumbent re-elected. | nowrap | {{Plainlist|
- Charles E. Wiggins (Republican) 55.2%
- William E. "Bill" Farris (Democratic) 40.4%
- Pat P. Scalera (American Independent) 4.4%
|- ! | Andrew J. Hinshaw Redistricted from the 39th district | | Republican | 1972 | Incumbent re-elected. | nowrap | {{Plainlist|
- Andrew J. Hinshaw (Republican) 63.3%
- Roderick J. "Rod" Wilson (Democratic) 31.0%
- Grayson L. Watkins (American Independent) 5.7%
|- ! | Bob Wilson Redistricted from the 40th district | | Republican | 1952 | Incumbent re-elected. | nowrap | {{Plainlist|
- Bob Wilson (Republican) 54.4%
- Colleen Marie O'Connor (Democratic) 43.1%
- Robert W. Franson (American Independent) 2.5%
|- ! | Lionel Van Deerlin Redistricted from the 41st district | | Democratic | 1962 | Incumbent re-elected. | nowrap | {{Plainlist|
- Lionel Van Deerlin (Democratic) 68.9%
- Wes Marden (Republican) 31.1%
|- ! | Clair Burgener Redistricted from the 42nd district | | Republican | 1972 | Incumbent re-elected. | nowrap | {{Plainlist|
- Clair Burgener (Republican) 60.4%
- Bill Bandes (Democratic) 39.6%
|}
Colorado
|- ! | Patricia Schroeder | | Democratic | 1972 | Incumbent re-elected. | nowrap | {{Plainlist|
- Patricia Schroeder (Democratic) 58.5%
- Frank Southworth (Republican) 40.8%
- Elmer B. Sachs (American) 0.7%
|- ! | Donald G. Brotzman | | Republican | 1962 1964 (defeated) 1966 | | Incumbent lost re-election. Democratic gain. | nowrap | {{Plainlist|
- Tim Wirth (Democratic) 51.9%
- Donald G. Brotzman (Republican) 48.1%
|- ! | Frank Evans | | Democratic | 1964 | Incumbent re-elected. | nowrap | {{Plainlist|
- Frank Evans (Democratic) 67.9%
- E. Keith Records (Republican) 32.1%
|- ! | James Paul Johnson | | Republican | 1972 | Incumbent re-elected. | nowrap | {{Plainlist|
- James Paul Johnson (Republican) 52.0%
- John Carroll (Democratic) 48.0%
|- ! | William L. Armstrong | | Republican | 1972 | Incumbent re-elected. | nowrap | {{Plainlist|
- William L. Armstrong (Republican) 57.7%
- Ben Galloway (Democratic) 38.5%
- Stan Johnson (Independent) 3.8%
|}
Connecticut
|- ! | William R. Cotter | | Democratic | 1970 | Incumbent re-elected. | nowrap | {{Plainlist|
- William R. Cotter (Democratic) 62.7%
- Francis M. Buckley (Republican) 35.9%
- Charlie A. Burke (George Wallace) 1.4%
|- ! | Robert H. Steele | | Republican | 1970 | | Incumbent retired to run for Governor of Connecticut. Democratic gain. | nowrap | {{Plainlist|
- Chris Dodd (Democratic) 59.0%
- Samuel B. Hellier (Republican) 39.2%
- Anthony Discepolo (Republican) 1.8%
|- ! | Robert Giaimo | | Democratic | 1958 | Incumbent re-elected. | nowrap | {{Plainlist|
- Robert Giaimo (Democratic) 65.1%
- James Altham Jr. (Republican) 31.4%
- Peter Koltypin (George Wallace) 2.1%
- Joelle R. Fishman (Communist) 1.3%
|- ! | Stewart McKinney | | Republican | 1970 | Incumbent re-elected. | nowrap | {{Plainlist|
- Stewart McKinney (Republican) 53.2%
- James G. Kellis (Democratic) 45.2%
- Alan B. Fodeman (George Wallace) 1.6%
|- ! | Ronald A. Sarasin | | Republican | 1972 | Incumbent re-elected. | nowrap | {{Plainlist|
- Ronald A. Sarasin (Republican) 50.4%
- William Ratchford (Democratic) 48.0%
- Virginia A. Knauf (George Wallace) 1.6%
|- ! | Ella T. Grasso | | Democratic | 1970 | | Incumbent retired to run for Governor of Connecticut. Democratic hold. | nowrap | {{Plainlist|
- Toby Moffett (Democratic) 63.4%
- Patsy J. Piscopo (Republican) 36.1%
- Louis J. Marietta (Independent) 0.4%
|}
Delaware
|- ! | Pierre S. du Pont IV | | Republican | 1970 | Incumbent re-elected. | nowrap | {{Plainlist|
- Pierre S. du Pont IV (Republican) 58.5%
- James R. Soles (Democratic) 39.6%
- Donald G. Gies (American Independent) 0.8%
- John Trager (Public Congress) 0.8%
- George C. Brown (Prohibition) 0.2%
- Melvin Dillard (Labor) 0.09%
|}
Florida
|- ! | Bob Sikes | | Democratic | 1940 1944 (resigned) 1974 | Incumbent re-elected. | nowrap | {{Plainlist|
- Bob Sikes (Democratic)
- Unopposed
|- ! | Don Fuqua | | Democratic | 1962 | Incumbent re-elected. | nowrap | {{Plainlist|
- Don Fuqua (Democratic)
- Unopposed
|- ! | Charles Edward Bennett | | Democratic | 1948 | Incumbent re-elected. | nowrap | {{Plainlist|
- Charles Edward Bennett (Democratic)
- Unopposed
|- ! | Bill Chappell | | Democratic | 1968 | Incumbent re-elected. | nowrap | {{Plainlist|
- Bill Chappell (Democratic) 68.2%
- Warren Hauser (Republican) 31.8%
|- ! | Bill Gunter | | Democratic | 1972 | | Incumbent retired to run for U.S. senator. Republican gain. | nowrap | {{Plainlist|
- Richard Kelly (Republican) 52.8%
- JoAnn Saunders (Democratic) 44.8%
- Others (Write-in) 2.5%
|- ! | Bill Young | | Republican | 1970 | Incumbent re-elected. | nowrap | {{Plainlist|
- Bill Young (Republican) 75.8%
- Mickey Monrose (Democratic) 24.2%
|- ! | Sam M. Gibbons | | Democratic | 1962 | Incumbent re-elected. | nowrap | {{Plainlist|
- Sam M. Gibbons (Democratic)
- Unopposed
|- ! | James A. Haley | | Democratic | 1952 | Incumbent re-elected. | nowrap | {{Plainlist|
- James A. Haley (Democratic) 56.7%
- Joe Z. Lovingood (Republican) 43.3%
|- ! | Louis Frey Jr. | | Republican | 1968 | Incumbent re-elected. | nowrap | {{Plainlist|
- Louis Frey Jr. (Republican) 76.7%
- William D. Rowland (Democratic) 23.3%
|- ! | Skip Bafalis | | Republican | 1972 | Incumbent re-elected. | nowrap | {{Plainlist|
- Skip Bafalis (Republican) 73.7%
- Evelyn Tucker (Democratic) 26.3%
|- ! | Paul Rogers | | Democratic | 1954 | Incumbent re-elected. | nowrap | {{Plainlist|
- Paul Rogers (Democratic)
- Unopposed
|- ! | J. Herbert Burke | | Republican | 1966 | Incumbent re-elected. | nowrap | {{Plainlist|
- J. Herbert Burke (Republican) 51.0%
- Charles Friedman (Democratic) 49.0%
|- ! | William Lehman | | Democratic | 1972 | Incumbent re-elected. | nowrap | {{Plainlist|
- William Lehman (Democratic)
- Unopposed
|- ! | Claude Pepper | | Democratic | 1962 | Incumbent re-elected. | nowrap | {{Plainlist|
- Claude Pepper (Democratic) 69.1%
- Michael A. Carricarte (Republican) 30.9%
|- ! | Dante Fascell | | Democratic | 1954 | Incumbent re-elected. | nowrap | {{Plainlist|
- Dante Fascell (Democratic) 70.5%
- S. Peter Capua (Republican) 29.5%
|}
Georgia
|- ! | Ronald "Bo" Ginn | | Democratic | 1972 | Incumbent re-elected. | nowrap | {{Plainlist|
- Ronald "Bo" Ginn (Democratic) 86.1%
- Bill Gowan (Republican) 13.9%
|- ! | Dawson Mathis | | Democratic | 1970 | Incumbent re-elected. | nowrap | {{Plainlist|
- Dawson Mathis (Democratic)
- Unopposed
|- ! | Jack Thomas Brinkley | | Democratic | 1966 | Incumbent re-elected. | nowrap | {{Plainlist|
- Jack Thomas Brinkley (Democratic) 87.7%
- Carl P. Savage Jr. (Republican) 12.3%
|- ! | Benjamin B. Blackburn | | Republican | 1966 | | Incumbent lost re-election. Democratic gain. | nowrap | {{Plainlist|
- Elliott H. Levitas (Democratic) 55.1%
- Benjamin B. Blackburn (Republican) 44.9%
|- ! | Andrew Young | | Democratic | 1972 | Incumbent re-elected. | nowrap | {{Plainlist|
- Andrew Young (Democratic) 71.6%
- Wyman C. Lowe (Republican) 28.4%
|- ! | Jack Flynt | | Democratic | 1954 | Incumbent re-elected. | nowrap | {{Plainlist|
- Jack Flynt (Democratic) 51.5%
- Newt Gingrich (Republican) 48.5%
|- ! | John W. Davis | | Democratic | 1960 | | Incumbent lost renomination. Democratic hold. | nowrap | {{Plainlist|
- Larry McDonald (Democratic) 50.3%
- Quincy Collins (Republican) 49.7%
|- ! | W. S. Stuckey Jr. | | Democratic | 1966 | Incumbent re-elected. | nowrap | {{Plainlist|
- W. S. Stuckey Jr. (Democratic)
- Unopposed
|- ! | Phillip M. Landrum | | Democratic | 1952 | Incumbent re-elected. | nowrap | {{Plainlist|
- Phillip M. Landrum (Democratic) 74.8%
- Ronald D. Reeves (Republican) 25.2%
|- ! | Robert Grier Stephens Jr. | | Democratic | 1960 | Incumbent re-elected. | nowrap | {{Plainlist|
- Robert Grier Stephens Jr. (Democratic) 68.4%
- Gary Pleger (Republican) 31.6%
|}
Hawaii
|- ! | Spark Matsunaga | | Democratic | 1962 | Incumbent re-elected. | nowrap | {{Plainlist|
- Spark Matsunaga (Democratic) 59.3%
- William B. Paul (Republican) 40.7%
|- ! | Patsy Mink | | Democratic | 1964 | Incumbent re-elected. | nowrap | {{Plainlist|
- Patsy Mink (Democratic) 62.6%
- Carla W. Coray (Republican) 37.4%
|}
Idaho
|- ! | Steve Symms | | Republican | 1972 | Incumbent re-elected. | nowrap | {{Plainlist|
- Steve Symms (Republican) 58.3%
- J. Ray Cox (Democratic) 41.7%
|- ! | Orval H. Hansen | | Republican | 1968 | | Incumbent lost renomination. Republican hold. | nowrap | {{Plainlist|
- George V. Hansen (Republican) 55.7%
- Max Hanson (Democratic) 44.3%
|}
Illinois
|- ! | Ralph H. Metcalfe | | Democratic | 1970 | Incumbent re-elected. | nowrap | {{Plainlist|
- Ralph H. Metcalfe (Democratic) 93.7%
- Oscar H. Haynes (Republican) 5.5%
- Willie Mae Reid (Socialist Workers) 0.8%
|- ! | Morgan F. Murphy | | Democratic | 1970 | Incumbent re-elected. | nowrap | {{Plainlist|
- Morgan F. Murphy (Democratic) 87.5%
- James J. Ginderske (Republican) 12.5%
|- ! | Robert P. Hanrahan | | Republican | 1972 | | Incumbent lost re-election. Democratic gain. | nowrap | {{Plainlist|
- Marty Russo (Democratic) 52.6%
- Robert P. Hanrahan (Republican) 47.4%
|- ! | Ed Derwinski | | Republican | 1958 | Incumbent re-elected. | nowrap | {{Plainlist|
- Ed Derwinski (Republican) 59.2%
- Ronald A. Rodger (Democratic) 40.8%
|- ! | John C. Kluczynski | | Democratic | 1950 | Incumbent re-elected. | nowrap | {{Plainlist|
- John C. Kluczynski (Democratic) 86.0%
- William H. G. Toms (Republican) 14.0%
|- ! | Harold R. Collier | | Republican | 1956 | | Incumbent retired. Republican hold. | nowrap | {{Plainlist|
- Henry Hyde (Republican) 53.4%
- Edward V. Hanrahan (Democratic) 46.6%
|- ! | Cardiss Collins | | Democratic | 1973 (Special) | Incumbent re-elected. | nowrap | {{Plainlist|
- Cardiss Collins (Democratic) 87.9%
- Donald L. Metzger (Republican) 12.1%
|- ! | Dan Rostenkowski | | Democratic | 1958 | Incumbent re-elected. | nowrap | {{Plainlist|
- Dan Rostenkowski (Democratic) 86.5%
- Salvatore E. Oddo (Republican) 13.5%
|- ! | Sidney R. Yates | | Democratic | 1948 1962 (retired) 1964 | Incumbent re-elected. | nowrap | {{Plainlist|
- Sidney R. Yates (Democratic)
- Unopposed
|- ! | Samuel H. Young | | Republican | 1972 | | Incumbent lost re-election. Democratic gain. | nowrap | {{Plainlist|
- Abner J. Mikva (Democratic) 50.9%
- Samuel H. Young (Republican) 49.1%
|- ! | Frank Annunzio | | Democratic | 1964 | Incumbent re-elected. | nowrap | {{Plainlist|
- Frank Annunzio (Democratic) 72.4%
- Mitchell G. Zadrozny (Republican) 27.6%
|- ! | Phil Crane | | Republican | 1969 (Special) | Incumbent re-elected. | nowrap | {{Plainlist|
- Phil Crane (Republican) 61.1%
- Betty C. Spence (Democratic) 38.9%
|- ! | Robert McClory | | Republican | 1962 | Incumbent re-elected. | nowrap | {{Plainlist|
- Robert McClory (Republican) 54.5%
- Stanley W. Beetham (Democratic) 45.5%
|- ! | John N. Erlenborn | | Republican | 1964 | Incumbent re-elected. | nowrap | {{Plainlist|
- John N. Erlenborn (Republican) 66.6%
- Robert H. Renshaw (Democratic) 33.4%
|- ! | Leslie C. Arends | | Republican | 1934 | | Incumbent retired. Democratic gain. | nowrap | {{Plainlist|
- Tim Lee Hall (Democratic) 52.0%
- Cliffard D. Carlson (Republican) 45.6%
- K. Douglas Lassiter (Independent) 2.4%
|- ! | John B. Anderson | | Republican | 1960 | Incumbent re-elected. | nowrap | {{Plainlist|
- John B. Anderson (Republican) 55.5%
- Marshall Hungness (Democratic) 28.7%
- W. John Schade Jr. (Independent) 15.8%
|- ! | George M. O'Brien | | Republican | 1972 | Incumbent re-elected. | nowrap | {{Plainlist|
- George M. O'Brien (Republican) 51.5%
- John J. Houlihan (Democratic) 48.5%
|- ! | Robert H. Michel | | Republican | 1956 | Incumbent re-elected. | nowrap | {{Plainlist|
- Robert H. Michel (Republican) 54.8%
- Steven L. Nordvall (Democratic) 45.2%
|- ! | Tom Railsback | | Republican | 1966 | Incumbent re-elected. | nowrap | {{Plainlist|
- Tom Railsback (Republican) 65.3%
- Jim Gende (Democratic) 34.7%
|- ! | Paul Findley | | Republican | 1960 | Incumbent re-elected. | nowrap | {{Plainlist|
- Paul Findley (Republican) 54.8%
- Peter F. Mack (Democratic) 45.2%
|- ! | Edward Rell Madigan | | Republican | 1972 | Incumbent re-elected. | nowrap | {{Plainlist|
- Edward Rell Madigan (Republican) 65.8%
- Richard N. Small (Democratic) 34.2%
|- ! | George E. Shipley | | Democratic | 1958 | Incumbent re-elected. | nowrap | {{Plainlist|
- George E. Shipley (Democratic) 59.8%
- William A. Young (Republican) 40.2%
|- ! | Melvin Price | | Democratic | 1944 | Incumbent re-elected. | nowrap | {{Plainlist|
- Melvin Price (Democratic) 80.5%
- Scott Randolph (Republican) 19.5%
|- ! | Kenneth J. Gray | | Democratic | 1954 | | Incumbent retired. Democratic hold. | nowrap | {{Plainlist|
- Paul Simon (Democratic) 59.5%
- Val Oshel (Republican) 40.5%
|}
Indiana

|- ! | Ray J. Madden | | Democratic | 1942 | Incumbent re-elected. | nowrap | {{Plainlist|
- Ray J. Madden (Democratic) 68.6%
- Joseph D. Harkin (Republican) 31.4%
|- ! | Earl F. Landgrebe | | Republican | 1968 | | Incumbent lost re-election. Democratic gain. | nowrap | {{Plainlist|
- Floyd Fithian (Democratic) 61.1%
- Earl F. Landgrebe (Republican) 38.9%
|- ! | John Brademas | | Democratic | 1958 | Incumbent re-elected. | nowrap | {{Plainlist|
- John Brademas (Democratic) 64.1%
- Virginia R. Black (Republican) 35.9%
|- ! | J. Edward Roush | | Democratic | 1958 1968 (defeated) 1970 | Incumbent re-elected. | nowrap | {{Plainlist|
- J. Edward Roush (Democratic) 51.9%
- Walter P. Helmke (Republican) 46.5%
- Donald L. Harris (American) 1.6%
|- ! | Elwood Hillis | | Republican | 1970 | Incumbent re-elected. | nowrap | {{Plainlist|
- Elwood Hillis (Republican) 56.6%
- William T. Sebree (Democratic) 43.4%
|- ! | William G. Bray | | Republican | 1950 | | Incumbent lost re-election. Democratic gain. | nowrap | {{Plainlist|
- David W. Evans (Democratic) 52.4%
- William G. Bray (Republican) 47.6%
|- ! | John T. Myers | | Republican | 1966 | Incumbent re-elected. | nowrap | {{Plainlist|
- John T. Myers (Republican) 57.1%
- Eldon Creasy Tipton (Democratic) 42.1%
- Harold P. Schlechtweg (Socialist Workers) 0.8%
|- ! | Roger H. Zion | | Republican | 1966 | | Incumbent lost re-election. Democratic gain. | nowrap | {{Plainlist|
- Philip H. Hayes (Democratic) 53.4%
- Roger H. Zion (Republican) 46.6%
|- ! | Lee H. Hamilton | | Democratic | 1964 | Incumbent re-elected. | nowrap | {{Plainlist|
- Lee H. Hamilton (Democratic) 71.1%
- Delson Cox Jr. (Republican) 28.9%
|- ! | David W. Dennis | | Republican | 1968 | | Incumbent lost re-election. Democratic gain. | nowrap | {{Plainlist|
- Philip R. Sharp (Democratic) 54.4%
- David W. Dennis (Republican) 45.6%
|- ! | William H. Hudnut III | | Republican | 1972 | | Incumbent lost re-election. Democratic gain. | nowrap | {{Plainlist|
- Andrew Jacobs Jr. (Democratic) 52.5%
- William H. Hudnut III (Republican) 47.5%
|}
Iowa
|- ! | Edward Mezvinsky | | Democratic | 1972 | Incumbent re-elected. | nowrap | {{Plainlist|
- Edward Mezvinsky (Democratic) 54.4%
- Jim Leach (Republican) 45.6%
|- ! | John C. Culver | | Democratic | 1964 | | Incumbent retired to run for U.S. senator. Democratic hold. | nowrap | {{Plainlist|
- Mike Blouin (Democratic) 51.1%
- Tom Riley (Republican) 48.1%
- James W. Whitford (American) 0.8%
|- ! | H. R. Gross | | Republican | 1948 | | Incumbent retired. Republican hold. | nowrap | {{Plainlist|
- Chuck Grassley (Republican) 50.8%
- Stephen J. Rapp (Democratic) 49.2%
|- ! | Neal Smith | | Democratic | 1958 | Incumbent re-elected. | nowrap | {{Plainlist|
- Neal Smith (Democratic) 63.9%
- Chuck Dick (Republican) 35.5%
- Donna Le Porte (American) 0.6%
|- ! | William J. Scherle | | Republican | 1966 | | Incumbent lost re-election. Democratic gain. | nowrap | {{Plainlist|
- Tom Harkin (Democratic) 51.1%
- William J. Scherle (Republican) 48.9%
|- ! | Wiley Mayne | | Republican | 1966 | | Incumbent lost re-election. Democratic gain. | nowrap | {{Plainlist|
- Berkley Bedell (Democratic) 54.6%
- Wiley Mayne (Republican) 45.4%
|}
Kansas
|- ! | Keith Sebelius | | Republican | 1968 | Incumbent re-elected. | nowrap | {{Plainlist|
- Keith Sebelius (Republican) 58.4%
- Don Smith (Democratic) 33.0%
- Thelma Morgan (American) 7.5%
- Lorin P. Miller (Prohibition) 1.1%
|- ! | William R. Roy | | Democratic | 1970 | | Incumbent retired to run for U.S. senator. Democratic hold. | nowrap | {{Plainlist|
- Martha Keys (Democratic) 55.0%
- John C. Peterson (Republican) 43.9%
- David Scoggin (Prohibition) 1.1%
|- ! | Larry Winn | | Republican | 1966 | Incumbent re-elected. | nowrap | {{Plainlist|
- Larry Winn (Republican) 62.9%
- Samuel J. Wells (Democratic) 35.0%
- Ted E. Oakes (American) 2.1%
|- ! | Garner E. Shriver | | Republican | 1960 | Incumbent re-elected. | nowrap | {{Plainlist|
- Garner E. Shriver (Republican) 48.8%
- Bert Chaney (Democratic) 42.5%
- John S. Stevens (American) 8.7%
|- ! | Joe Skubitz | | Republican | 1962 | Incumbent re-elected. | nowrap | {{Plainlist|
- Joe Skubitz (Republican) 55.2%
- Frank Gaines (Democratic) 44.8%
|}
Kentucky
Main article: 1974 United States House of Representatives elections in Kentucky
|- ! | Frank Stubblefield | | Democratic | 1958 | | Incumbent lost renomination. Democratic hold. | nowrap | {{Plainlist|
- Carroll Hubbard (Democratic) 78.2%
- Charles Thurman Banken Jr. (Republican) 18.7%
- Robert W. Yoak (American) 3.1%
|- ! | William Natcher | | Democratic | 1953 (Special) | Incumbent re-elected. | nowrap | {{Plainlist|
- William Natcher (Democratic) 73.0%
- Art Eddleman (Republican) 23.7%
- Leland Neville (American) 3.3%
|- ! | Romano L. Mazzoli | | Democratic | 1970 | Incumbent re-elected. | nowrap | {{Plainlist|
- Romano L. Mazzoli (Democratic) 69.7%
- Vincent N. Barclay (Republican) 26.6%
- William P. Chambers (American) 3.1%
- Luther J. Wilson (Independent) 0.7%
|- ! | Gene Snyder | | Republican | 1962 1964 (defeated) 1966 | Incumbent re-elected. | nowrap | {{Plainlist|
- Gene Snyder (Republican) 51.7%
- Kyle T. Hubbard (Democratic) 48.3%
|- ! | Tim Lee Carter | | Republican | 1964 | Incumbent re-elected. | nowrap | {{Plainlist|
- Tim Lee Carter (Republican) 68.2%
- Lyle L. Willis (Democratic) 29.3%
- Albert G. J. Cullum (American) 2.5%
|- ! | John B. Breckinridge | | Democratic | 1972 | Incumbent re-elected. | nowrap | {{Plainlist|
- John B. Breckinridge (Democratic) 72.1%
- Thomas F. Rogers III (Republican) 24.1%
- Fred Kerestesy (American) 3.9%
|- ! | Carl D. Perkins | | Democratic | 1948 | Incumbent re-elected. | nowrap | {{Plainlist|
- Carl D. Perkins (Democratic) 75.6%
- Granville Thomas (Republican) 24.4%
|}
Louisiana
Main article: 1974 United States House of Representatives elections in Louisiana
|- ! | F. Edward Hébert | | Democratic | 1940 | Incumbent re-elected. | nowrap | {{Plainlist|
- F. Edward Hébert (Democratic)
- Unopposed
|- ! | Lindy Boggs | | Democratic | 1973 (Special) | Incumbent re-elected. | nowrap | {{Plainlist|
- Lindy Boggs (Democratic) 81.8%
- Diane Morphos (Republican) 14.6%
- Jules W. "Ted" Hillery (Independent) 3.5%
|- ! | Dave Treen | | Republican | 1972 | Incumbent re-elected. | nowrap | {{Plainlist|
- Dave Treen (Republican) 58.5%
- Charles Grisbaum Jr. (Democratic) 41.5%
|- ! | Joe Waggonner | | Democratic | 1961 (Special) | Incumbent re-elected. | nowrap | {{Plainlist|
- Joe Waggonner (Democratic)
- Unopposed
|- ! | Otto Passman | | Democratic | 1946 | Incumbent re-elected. | nowrap | {{Plainlist|
- Otto Passman (Democratic)
- Unopposed
|- ! | John Rarick | | Democratic | 1966 | | Incumbent lost renomination. Republican gain. | nowrap | {{Plainlist|
- Henson Moore (Republican) 54.1%
- Jeff La Caze (Democratic) 45.9%
|- ! | John Breaux | | Democratic | 1972 | Incumbent re-elected. | nowrap | {{Plainlist|
- John Breaux (Democratic) 89.3%
- Jeremy J. Millett (Independent) 10.7%
|- ! | Gillis William Long | | Democratic | 1962 1964 (lost renomination) 1972 | Incumbent re-elected. | nowrap | {{Plainlist|
- Gillis William Long (Democratic)
- Unopposed
|}
Maine
Main article: 1974 United States House of Representatives elections in Maine
|- ! | Peter N. Kyros | | Democratic | 1966 | | Incumbent lost re-election. Republican gain. | nowrap | {{Plainlist|
- David F. Emery (Republican) 50.2%
- Peter N. Kyros (Democratic) 49.8%
|- ! | William Cohen | | Republican | 1972 | Incumbent re-elected. | nowrap | {{Plainlist|
- William Cohen (Republican) 71.4%
- Markham L. Gartley (Democratic) 28.6%
|}
Maryland
Main article: 1974 United States House of Representatives elections in Maryland
|- ! | Robert Bauman | | Republican | 1973 (Special) | Incumbent re-elected. | nowrap | {{Plainlist|
- Robert Bauman (Republican) 53.0%
- Thomas J. Hatem (Democratic) 47.0%
|- ! | Clarence Long | | Democratic | 1962 | Incumbent re-elected. | nowrap | {{Plainlist|
- Clarence Long (Democratic) 77.1%
- John M. Seney (Republican) 22.9%
|- ! | Paul Sarbanes | | Democratic | 1970 | Incumbent re-elected. | nowrap | {{Plainlist|
- Paul Sarbanes (Democratic) 83.8%
- William H. Mathews (Republican) 16.2%
|- ! | Marjorie Holt | | Republican | 1972 | Incumbent re-elected. | nowrap | {{Plainlist|
- Marjorie Holt (Republican) 58.1%
- Fred L. Wineland (Democratic) 41.9%
|- ! | Lawrence Hogan | | Republican | 1968 | | Incumbent retired to run for Governor of Maryland. Democratic gain. | nowrap | {{Plainlist|
- Gladys Spellman (Democratic) 52.6%
- John B. Burcham Jr. (Republican) 47.4%
|- ! | Goodloe Byron | | Democratic | 1970 | Incumbent re-elected. | nowrap | {{Plainlist|
- Goodloe Byron (Democratic) 73.7%
- Elton R. Wampler (Republican) 26.3%
|- ! | Parren Mitchell | | Democratic | 1970 | Incumbent re-elected. | nowrap | {{Plainlist|
- Parren Mitchell (Democratic)
- Unopposed
|- ! | Gilbert Gude | | Republican | 1966 | Incumbent re-elected. | nowrap | {{Plainlist|
- Gilbert Gude (Republican) 65.9%
- Sidney Kramer (Democratic) 34.1%
|}
Massachusetts
Main article: 1974 United States House of Representatives elections in Massachusetts
|- ! | Silvio Conte | | Republican | 1958 | Incumbent re-elected. | nowrap | {{Plainlist|
- Silvio Conte (Republican) 71.1%
- Thomas R. Manning (Democratic) 28.9%
|- ! | Edward Boland | | Democratic | 1952 | Incumbent re-elected. | nowrap | {{Plainlist|
- Edward Boland (Democratic)
- Unopposed
|- ! | Harold Donohue | | Democratic | 1946 | | Incumbent retired. Democratic hold. | nowrap | {{Plainlist|
- Joseph D. Early (Democratic) 49.5%
- David J. Lionett (Republican) 38.4%
- Douglas J. Rowe (Independent) 12.0%
|- ! | Robert Drinan | | Democratic | 1970 | Incumbent re-elected. | nowrap | {{Plainlist|
- Robert Drinan (Democratic) 50.8%
- Jon Rotenberg (Independent) 34.7%
- Alvin Mandell (Republican) 14.4%
|- ! | Paul W. Cronin | | Republican | 1972 | | Incumbent lost re-election. Democratic gain. | nowrap | {{Plainlist|
- Paul Tsongas (Democratic) 60.6%
- Paul W. Cronin (Republican) 39.4%
|- ! | Michael J. Harrington | | Democratic | 1969 (Special) | Incumbent re-elected. | nowrap | {{Plainlist|
- Michael J. Harrington (Democratic)
- Unopposed
|- ! | Torbert H. MacDonald | | Democratic | 1954 | Incumbent re-elected. | nowrap | {{Plainlist|
- Torbert H. MacDonald (Democratic) 79.8%
- James J. Murphy (Independent) 20.2%
|- ! | Tip O'Neill | | Democratic | 1952 | Incumbent re-elected. | nowrap | {{Plainlist|
- Tip O'Neill (Democratic) 87.9%
- James H. Kiggen (Labor) 6.9%
- Laura Ross (Communist) 5.3%
|- ! | Joe Moakley | | Democratic | 1972 | Incumbent re-elected. | nowrap | {{Plainlist|
- Joe Moakley (Democratic) 89.3%
- Laurence R. Sherman (Labor) 10.7%
|- ! | Margaret Heckler | | Republican | 1966 | Incumbent re-elected. | nowrap | {{Plainlist|
- Margaret Heckler (Republican) 64.2%
- Barry F. Monahan (Democratic) 35.8%
|- ! | James A. Burke | | Democratic | 1958 | Incumbent re-elected. | nowrap | {{Plainlist|
- James A. Burke (Democratic)
- Unopposed
|- ! | Gerry E. Studds | | Democratic | 1972 | Incumbent re-elected. | nowrap | {{Plainlist|
- Gerry E. Studds (Democratic) 74.8%
- J. Alan Mackay (Republican) 25.2%
|}
Michigan
|- ! | John Conyers Jr. | | Democratic | 1964 | Incumbent re-elected. | nowrap | {{Plainlist|
- John Conyers Jr. (Democratic) 90.7%
- Walter F. Girardot (Republican) 8.7%
- Hattie L. McCutcheon (Socialist Workers) 0.4%
- Jacqueline M. Cotton (Labor) 0.2%
|- ! | Marvin L. Esch | | Republican | 1966 | Incumbent re-elected. | nowrap | {{Plainlist|
- Marvin L. Esch (Republican) 52.3%
- John S. Reuther (Democratic) 45.4%
- Philip S. Carroll (Human Rights) 1.3%
- Roy S. Jones (American Independent) 0.7%
- Martha E. Pettit (Socialist Workers) 0.1%
- Ronald G. Ziegler (Labor) 0.1%
|- ! | Garry E. Brown | | Republican | 1966 | Incumbent re-elected. | nowrap | {{Plainlist|
- Garry E. Brown (Republican) 51.2%
- Paul H. Todd Jr. (Democratic) 47.6%
- Marvin P. Lightvoet (American Independent) 0.7%
- Bryce F. Zender Jr. (Human Rights) 0.6%
- Steve Beumer (Socialist Workers) 0.07%
|- ! | J. Edward Hutchinson | | Republican | 1962 | Incumbent re-elected. | nowrap | {{Plainlist|
- J. Edward Hutchinson (Republican) 53.1%
- Charles Jameson (Democratic) 45.5%
- Harold Snyder (American Independent) 1.3%
- Leslie E. Craine (Socialist Workers) 0.1%
|- ! | Richard F. Vander Veen | | Democratic | 1974 | Incumbent re-elected. | nowrap | {{Plainlist|
- Richard F. Vander Veen (Democratic) 52.6%
- Paul G. Goebel Jr. (Republican) 43.4%
- Dwight W. Johnson (American Independent) 3.7%
- Frank Girard (Socialist Labor) 0.1%
- Ann Riley Owens (Socialist Workers) 0.1%
|- ! | Charles E. Chamberlain | | Republican | 1956 | | Incumbent retired. Democratic gain. | nowrap | {{Plainlist|
- Milton Robert Carr (Democratic) 49.3%
- Clifford W. Taylor (Republican) 48.9%
- Howard Jones (Human Rights) 1.4%
- Margaret M. Hayes (Socialist Workers) 0.2%
- Michael Ballard (Socialist Labor) 0.1%
- Randolph A. Wedler (Labor) 0.06%
|- ! | Donald W. Riegle Jr. | | Democratic | 1966 | Incumbent re-elected. | nowrap | {{Plainlist|
- Donald W. Riegle Jr. (Democratic) 64.7%
- Robert E. Eastman (Republican) 33.2%
- Jimmy L. Sabin (American Independent) 1.0%
- John P. Freeman (Human Rights) 0.8%
- John F. Dicks (Labor) 0.1%
- Sheila Ostrow (Socialist Workers) 0.1%
|- ! | J. Bob Traxler | | Democratic | 1974 | Incumbent re-elected. | nowrap | {{Plainlist|
- J. Bob Traxler (Democratic) 54.8%
- James M. Sparling Jr. (Republican) 43.4%
- Mark Nelson (American Independent) 1.7%
- Nicolee E. Brorsen (Socialist Workers) 0.06%
|- ! | Guy Vander Jagt | | Republican | 1966 | Incumbent re-elected. | nowrap | {{Plainlist|
- Guy Vander Jagt (Republican) 56.6%
- Norman Halbower (Democratic) 42.1%
- Craig R. Kessler (American Independent) 1.1%
- Connie Allen (Socialist Workers) 0.2%
|- ! | Elford Albin Cederberg | | Republican | 1952 | Incumbent re-elected. | nowrap | {{Plainlist|
- Elford Albin Cederberg (Republican) 52.5%
- Samuel D. Marble (Democratic) 47.1%
- Kathryn Ropert (Socialist Workers) 0.4%
|- ! | Philip Ruppe | | Republican | 1966 | Incumbent re-elected. | nowrap | {{Plainlist|
- Philip Ruppe (Republican) 50.9%
- Francis D. Brouillette (Democratic) 48.8%
- Theodore G. Albert (Human Rights) 0.2%
- Brian Elam (Socialist Workers) 0.05%
|- ! | James G. O'Hara | | Democratic | 1958 | Incumbent re-elected. | nowrap | {{Plainlist|
- James G. O'Hara (Democratic) 72.2%
- Eugene J. Tyza (Republican) 27.6%
- Richard Orawiec (Socialist Workers) 0.2%
|- ! | Charles Diggs | | Democratic | 1954 | Incumbent re-elected. | nowrap | {{Plainlist|
- Charles Diggs (Democratic) 87.4%
- George E. McCall (Republican) 11.1%
- Judith Hagans (Socialist Workers) 1.1%
- Percy Ray Wheeler (American Labor) 0.4%
|- ! | Lucien Nedzi | | Democratic | 1961 (Special) | Incumbent re-elected. | nowrap | {{Plainlist|
- Lucien Nedzi (Democratic) 71.2%
- Herbert O. Steiger (Republican) 27.1%
- Leonard J. Lukomski (American Independent) 1.3%
- Mark Severs (Socialist Workers) 0.2%
- Joseph A. Spaniolo (Labor) 0.1%
|- ! | William D. Ford | | Democratic | 1964 | Incumbent re-elected. | nowrap | {{Plainlist|
- William D. Ford (Democratic) 78.1%
- Jack A. Underwood (Republican) 20.8%
- Aldi C. Fuhrmann (American Independent) 0.9%
- James R. Eades (Labor) 0.1%
- Claytee O. Artz (Socialist Workers) 0.1%
|- ! | John D. Dingell Jr. | | Democratic | 1955 (Special) | Incumbent re-elected. | nowrap | {{Plainlist|
- John D. Dingell Jr. (Democratic) 77.7%
- Wallace D. English (Republican) 20.5%
- Virginia Crawford (American Independent) 1.3%
- Donald A. Bechler (Socialist Workers) 0.3%
- Lewis Steinhardt (Labor) 0.2%
|- ! | Martha W. Griffiths | | Democratic | 1954 | | Incumbent retired. Democratic hold. | nowrap | {{Plainlist|
- William M. Brodhead (Democratic) 69.5%
- Kenneth C. Gallagher (Republican) 29.4%
- Bruce E. Duke (American Independent) 0.8%
- Christy L. Wallace (Socialist Workers) 0.3%
- Harry Jock (Labor) 0.07%
|- ! | Robert J. Huber | | Republican | 1972 | | Incumbent lost re-election. Democratic gain. | nowrap | {{Plainlist|
- James J. Blanchard (Democratic) 59.0%
- Robert J. Huber (Republican) 40.4%
- James Gordon Lott (American Independent) 0.4%
- Sandra L. Peck (Socialist Workers) 0.2%
|- ! | William Broomfield | | Republican | 1956 | Incumbent re-elected. | nowrap | {{Plainlist|
- William Broomfield (Republican) 62.6%
- George Montgomery (Democratic) 36.7%
- Maurice Geary (Human Rights) 0.4%
- Rudolf Zeller (Socialist Workers) 0.1%
- James Jaber (Labor) 0.08%
- Matthew Moriarty (Labor) 0.07%
|}
Minnesota
Main article: 1974 United States House of Representatives elections in Minnesota
|- ! | Al Quie | | Republican | 1958 | Incumbent re-elected. | nowrap | {{Plainlist|
|- ! | Ancher Nelsen | | Republican | 1958 | | Incumbent retired. Republican hold. | nowrap | {{Plainlist|
|- ! | Bill Frenzel | | Republican | 1970 | Incumbent re-elected. | nowrap | {{Plainlist|
|- ! | Joseph Karth | | | 1958 | Incumbent re-elected. | nowrap | {{Plainlist|
|- ! | Donald M. Fraser | | | 1962 | Incumbent re-elected. | nowrap | {{Plainlist|
|- ! | John Zwach | | Republican | 1966 | | Incumbent retired. ** gain.** | nowrap | {{Plainlist|
|- ! | Bob Bergland | | | 1970 | Incumbent re-elected. | nowrap | {{Plainlist|
|- ! | John Blatnik | | | 1946 | | Incumbent retired. Democratic hold. | nowrap | {{Plainlist|
- Jim Oberstar () 62.0%
- Jerome Arnold (Republican) 26.2%
- William R. Ojala (Justice) 10.0%
- Robert C. Bester (Independent) 1.8%
|}
Mississippi
|- ! | Jamie Whitten | | Democratic | 1941 (Special) | Incumbent re-elected. | nowrap | {{Plainlist|
- Jamie Whitten (Democratic) 88.2%
- Jack Benney (Independent) 11.8%
|- ! | David R. Bowen | | Democratic | 1972 | Incumbent re-elected. | nowrap | {{Plainlist|
- David R. Bowen (Democratic) 66.1%
- Ben F. Hilbun Jr. (Republican) 27.7%
- H. B. Wells (Independent) 6.2%
|- ! | Gillespie V. Montgomery | | Democratic | 1966 | Incumbent re-elected. | nowrap | {{Plainlist|
- Gillespie V. Montgomery (Democratic)
- Unopposed
|- ! | Thad Cochran | | Republican | 1972 | Incumbent re-elected. | nowrap | {{Plainlist|
- Thad Cochran (Republican) 70.2%
- Kenneth L. Dean (Democratic) 28.8%
- Leonard R. Young (Independent) 1.0%
|- ! | Trent Lott | | Republican | 1972 | Incumbent re-elected. | nowrap | {{Plainlist|
- Trent Lott (Republican) 73.0%
- Walter Wilson Murphey (Democratic) 14.4%
- Karl Mertz (Independent) 8.9%
- Glenn E. Gilley (Independent) 2.7%
- Earnest J. Creel (Independent) 1.0%
|}
Missouri
|- ! | Bill Clay | | Democratic | 1968 | Incumbent re-elected. | nowrap | {{Plainlist|
- Bill Clay (Democratic) 68.3%
- Arthur O. Martin (Republican) 31.7%
|- ! | James W. Symington | | Democratic | 1968 | Incumbent re-elected. | nowrap | {{Plainlist|
- James W. Symington (Democratic) 61.0%
- Howard C. Ohlendorf (Republican) 39.0%
|- ! | Leonor Sullivan | | Democratic | 1952 | Incumbent re-elected. | nowrap | {{Plainlist|
- Leonor Sullivan (Democratic) 74.3%
- Jo Ann P. Raisch (Republican) 24.3%
- Marie S. Nowak (Independent) 1.4%
|- ! | William J. Randall | | Democratic | 1959 (Special) | Incumbent re-elected. | nowrap | {{Plainlist|
- William J. Randall (Democratic) 67.9%
- Claude Patterson (Republican) 32.1%
|- ! | Richard Bolling | | Democratic | 1948 | Incumbent re-elected. | nowrap | {{Plainlist|
- Richard Bolling (Democratic) 69.1%
- John McDonough (Republican) 29.9%
- Edward Verburg (Independent) 1.0%
|- ! | Jerry Litton | | Democratic | 1972 | Incumbent re-elected. | nowrap | {{Plainlist|
- Jerry Litton (Democratic) 78.9%
- Grover H. Speers (Republican) 21.1%
|- ! | Gene Taylor | | Republican | 1972 | Incumbent re-elected. | nowrap | {{Plainlist|
- Gene Taylor (Republican) 52.3%
- Richard L. Franks (Democratic) 47.7%
|- ! | Richard Howard Ichord Jr. | | Democratic | 1960 | Incumbent re-elected. | nowrap | {{Plainlist|
- Richard Howard Ichord Jr. (Democratic) 69.9%
- James A. Noland Jr. (Republican) 30.1%
|- ! | William L. Hungate | | Democratic | 1964 | Incumbent re-elected. | nowrap | {{Plainlist|
- William L. Hungate (Democratic) 66.4%
- Milton Bischof Jr. (Republican) 33.6%
|- ! | Bill Burlison | | Democratic | 1968 | Incumbent re-elected. | nowrap | {{Plainlist|
- Bill Burlison (Democratic) 72.8%
- Truman Farrow (Republican) 27.2%
|}
Montana
|- ! | Richard G. Shoup | | Republican | 1970 | | Incumbent lost re-election. Democratic gain. | nowrap | {{Plainlist|
- Max Baucus (Democratic) 54.8%
- Richard G. Shoup (Republican) 45.2%
|- ! | John Melcher | | Democratic | 1969 (Special) | Incumbent re-elected. | nowrap | {{Plainlist|
- John Melcher (Democratic) 63.0%
- Jack McDonald (Republican) 37.0%
|}
Nebraska
|- ! | Charles Thone | | Republican | 1970 | Incumbent re-elected. | nowrap | {{Plainlist|
- Charles Thone (Republican) 53.3%
- Hess Dyas (Democratic) 46.7%
|- ! | John Y. McCollister | | Republican | 1970 | Incumbent re-elected. | nowrap | {{Plainlist|
- John Y. McCollister (Republican) 55.2%
- Daniel C. Lynch (Democratic) 44.8%
|- ! | David T. Martin | | Republican | 1960 | | Incumbent retired. Republican hold. | nowrap | {{Plainlist|
- Virginia D. Smith (Republican) 50.2%
- Wayne W. Ziebarth (Democratic) 49.8%
|}
Nevada
Main article: 1974 United States House of Representatives election in Nevada
|- ! | David Towell | | Republican | 1972 | | Incumbent lost re-election. Democratic gain. | nowrap | {{Plainlist|
- James David Santini (Democratic) 55.8%
- David Towell (Republican) 36.4%
- Joel F. Hansen (Independent) 7.8%
|}
New Hampshire
|- ! | Louis C. Wyman | | Republican | 1962 1964 (defeated) 1966 | | Incumbent retired to run for U.S. senator. Democratic gain. | nowrap | {{Plainlist|
- Norman D'Amours (Democratic) 52.1%
- David A. Banks (Republican) 47.9%
|- ! | James Colgate Cleveland | | Republican | 1962 | Incumbent re-elected. | nowrap | {{Plainlist|
- James Colgate Cleveland (Republican) 64.2%
- Helen L. Bliss (Democratic) 35.8%
|}
New Jersey
|- ! | John E. Hunt | | Republican | 1966 | | Incumbent lost re-election. Democratic gain. | nowrap | {{Plainlist|
- James J. Florio (Democratic) 57.5%
- John E. Hunt (Republican) 38.5%
- James Perry (Independent) 2.3%
- Bradley L. Kirsch (Independent) 0.6%
- Elizabeth L. Drevs (Independent) 0.5%
- Raymond Carotenuto (Independent) 0.3%
- Julius Levin (Socialist Labor) 0.2%
- Pedro J. Torres (Independent) 0.1%
|- ! | Charles W. Sandman Jr. | | Republican | 1966 | | Incumbent lost re-election. Democratic gain. | nowrap | {{Plainlist|
- William J. Hughes (Democratic) 57.3%
- Charles W. Sandman Jr. (Republican) 41.3%
- Andrew Wender (Independent) 1.4%
|- ! | James J. Howard | | Democratic | 1964 | Incumbent re-elected. | nowrap | {{Plainlist|
- James J. Howard (Democratic) 68.9%
- Kenneth W. Clark (Republican) 29.8%
- Joseph A. Rogers (Independent) 0.8%
- Thomas W. Palven (Independent) 0.5%
|- ! | Frank Thompson | | Democratic | 1954 | Incumbent re-elected. | nowrap | {{Plainlist|
- Frank Thompson (Democratic) 66.8%
- Henry J. Keller (Republican) 33.2%
|- ! | Peter Frelinghuysen Jr. | | Republican | 1952 | | Incumbent retired. Republican hold. | nowrap | {{Plainlist|
- Millicent Fenwick (Republican) 53.4%
- Frederick M. Bohen (Democratic) 43.5%
- John Giammarco (American Independent) 2.0%
- Leonard F. Newton (Independent) 1.2%
|- ! | Edwin B. Forsythe | | Republican | 1970 | Incumbent re-elected. | nowrap | {{Plainlist|
- Edwin B. Forsythe (Republican) 52.5%
- Charles B. Yates (Democratic) 45.5%
- John V. Mahalchik (Independent) 0.9%
- Bernardo S. Doganiero (Socialist Labor) 0.7%
- Joseph Alfons Nowak (Christian) 0.4%
|- ! | William B. Widnall | | Republican | 1950 | | Incumbent lost re-election. Democratic gain. | nowrap | {{Plainlist|
- Andrew Maguire (Democratic) 49.7%
- William B. Widnall (Republican) 44.4%
- Milton Gralla (Independent) 5.9%
|- ! | Robert A. Roe | | Democratic | 1970 | Incumbent re-elected. | nowrap | {{Plainlist|
- Robert A. Roe (Democratic) 73.9%
- Herman Schmidt (Republican) 24.6%
- Kenneth Kowalczyk (Socialist Labor) 1.6%
|- ! | Henry Helstoski | | Democratic | 1964 | Incumbent re-elected. | nowrap | {{Plainlist|
- Henry Helstoski (Democratic) 64.5%
- Harold A. Pareti (Republican) 32.9%
- Herbert H. Shaw (Independent) 2.2%
- Robert W. Funsch (Independent) 0.3%
|- ! | Peter W. Rodino | | Democratic | 1948 | Incumbent re-elected. | nowrap | {{Plainlist|
- Peter W. Rodino (Democratic) 81.0%
- John R. Taliferro (Republican) 15.2%
- Sandra Hill (Independent) 3.8%
|- ! | Joseph G. Minish | | Democratic | 1962 | Incumbent re-elected. | nowrap | {{Plainlist|
- Joseph G. Minish (Democratic) 69.2%
- William B. Grant (Republican) 29.4%
- Robert Clement (Socialist Labor) 1.3%
|- ! | Matthew John Rinaldo | | Republican | 1972 | Incumbent re-elected. | nowrap | {{Plainlist|
- Matthew John Rinaldo (Republican) 65.0%
- Adam K. Levin (Democratic) 32.4%
- Anthony Carbone (Independent) 1.1%
- Catherine O'Toole French (Independent) 0.8%
- Robert A. Steiner (Independent) 0.7%
|- ! | Joseph J. Maraziti | | Republican | 1972 | | Incumbent lost re-election. Democratic gain. | nowrap | {{Plainlist|
- Helen Stevenson Meyner (Democratic) 57.3%
- Joseph J. Maraziti (Republican) 42.7%
|- ! | Dominick V. Daniels | | Democratic | 1958 | Incumbent re-elected. | nowrap | {{Plainlist|
- Dominick V. Daniels (Democratic) 79.9%
- Claire J. Sheridan (Republican) 16.1%
- John A. Alston (Independent) 4.0%
|- ! | Edward J. Patten | | Democratic | 1962 | Incumbent re-elected. | nowrap | {{Plainlist|
- Edward J. Patten (Democratic) 71.0%
- Ernest J. Hammesfahr (Republican) 27.5%
- Paul M. Schiff (Communist) 1.5%
|}
New Mexico
Main article: 1974 United States House of Representatives elections in New Mexico
|- ! | Manuel Lujan Jr. | | Republican | 1968 | Incumbent re-elected. | {{Plainlist|
- Manuel Lujan Jr. (Republican) 58.6%
- Roberto A. Mondragón (Democratic) 39.7%
- Martin Molloy (American Independent) 1.7%
|- ! | Harold L. Runnels | | Democratic | 1970 | Incumbent re-elected. | {{Plainlist|
- Harold L. Runnels (Democratic) 66.7%
- Donald W. Trubey (Republican) 31.9%
- Herbert "Hub" Horton (American Independent) 1.4%
|}
New York
Main article: 1974 United States House of Representatives elections in New York
|- ! | Otis G. Pike | | Democratic | 1960 | Incumbent re-elected. | nowrap | {{Plainlist|
- Otis G. Pike (Democratic) 65.0%
- Donald R. Sallah (Republican) 28.6%
- Seth Morgan (Conservative) 6.4%
|- ! | James R. Grover Jr. | | Republican | 1962 | | Incumbent lost re-election. Democratic gain. | nowrap | {{Plainlist|
- Thomas J. Downey (Democratic) 48.8%
- James R. Grover Jr. (Republican) 44.7%
- Neil Greene (Conservative) 6.5%
|- ! | Angelo D. Roncallo | | Republican | 1972 | | Incumbent lost re-election. Democratic gain. | nowrap | {{Plainlist|
- Jerome Ambro (Democratic) 51.8%
- Angelo D. Roncallo (Republican) 46.1%
- Arthur Hoffer (Liberal) 2.2%
|- ! | Norman F. Lent | | Republican | 1970 | Incumbent re-elected. | nowrap | {{Plainlist|
- Norman F. Lent (Republican) 56.3%
- Franklin Ornstein (Democratic) 43.7%
|- ! | John W. Wydler | | Republican | 1962 | Incumbent re-elected. | nowrap | {{Plainlist|
- John W. Wydler (Republican) 57.1%
- Allard K. Lowenstein (Democratic) 42.9%
|- ! | Lester L. Wolff | | Democratic | 1964 | Incumbent re-elected. | nowrap | {{Plainlist|
- Lester L. Wolff (Democratic) 61.0%
- Edythe Layne (Republican) 39.0%
|- ! | Joseph P. Addabbo | | Democratic | 1960 | Incumbent re-elected. | nowrap | {{Plainlist|
- Joseph P. Addabbo (Democratic)
- Unopposed
|- ! | Benjamin Stanley Rosenthal | | Democratic | 1962 | Incumbent re-elected. | nowrap | {{Plainlist|
- Benjamin Stanley Rosenthal (Democratic) 68.8%
- Albert Lemishow (Republican) 31.2%
|- ! | James J. Delaney | | Democratic | 1944 1946 (defeated) 1948 | Incumbent re-elected. | nowrap | {{Plainlist|
- James J. Delaney (Democratic) 93.0%
- Theodore E. Garrison (Liberal) 7.0%
|- ! | Mario Biaggi | | Democratic | 1968 | Incumbent re-elected. | nowrap | {{Plainlist|
- Mario Biaggi (Democratic) 82.4%
- Francis L. McHugh (Conservative) 11.2%
- Michael S. Bank (Liberal) 6.3%
|- ! | Frank J. Brasco | | Democratic | 1966 | | Incumbent retired. Democratic hold. | nowrap | {{Plainlist|
- James H. Scheuer (Democratic) 72.2%
- Edward G. Desborough (Republican) 14.2%
- Christopher T. Acer (Conservative) 8.3%
- Tibby Blum (Liberal) 5.2%
|- ! | Shirley Chisholm | | Democratic | 1968 | Incumbent re-elected. | nowrap | {{Plainlist|
- Shirley Chisholm (Democratic) 80.2%
- Francis J. Voyticky (Republican) 13.9%
- Martin S. Shepherd Jr. (Conservative) 4.6%
- Teresa Delgado (Socialist Labor) 0.9%
- Maxine Williams (Socialist Workers) 0.4%
|- ! | Bertram L. Podell | | Democratic | 1968 | | Incumbent lost renomination. Democratic hold. | nowrap | {{Plainlist|
- Stephen J. Solarz (Democratic) 81.8%
- Jack N. Dobosh (Republican) 18.2%
|- ! | John J. Rooney | | Democratic | 1944 | | Incumbent retired. Democratic hold. | nowrap | {{Plainlist|
- Fred Richmond (Democratic) 71.3%
- Donald H. Elliott (Liberal) 13.3%
- Michael Carbajal Jr. (Republican) 11.5%
- Alexander W. Nojovits (Conservative) 3.1%
- Helen Halyard (Socialist Workers) 0.8%
|- ! | Hugh L. Carey | | Democratic | 1960 | | Incumbent retired to run for Governor of New York. Democratic hold. | nowrap | {{Plainlist|
- Leo C. Zeferetti (Democratic) 49.9%
- Austen D. Canade (Republican) 37.9%
- Herbert M. Feinsod (Liberal) 12.2%
|- ! | Elizabeth Holtzman | | Democratic | 1972 | Incumbent re-elected. | nowrap | {{Plainlist|
- Elizabeth Holtzman (Democratic) 78.9%
- Joseph L. Gentili (Republican) 21.1%
|- ! | John M. Murphy | | Democratic | 1962 | Incumbent re-elected. | nowrap | {{Plainlist|
- John M. Murphy (Democratic) 57.7%
- Frank J. Biondolillo (Republican) 25.6%
- Jerome Kretchmer (Liberal) 9.6%
- Michael Ajello (Conservative) 7.1%
|- ! | Ed Koch | | Democratic | 1968 | Incumbent re-elected. | nowrap | {{Plainlist|
- Ed Koch (Democratic) 76.7%
- John Boogaerts Jr. (Republican) 18.8%
- Gilliam M. Drummond (Conservative) 3.7%
- Katherine Sojourner (Socialist Workers) 0.8%
|- ! | Charles B. Rangel | | Democratic | 1970 | Incumbent re-elected. | nowrap | {{Plainlist|
- Charles B. Rangel (Democratic) 96.9%
- Charles G. Mills IV (Conservative) 3.1%
|- ! | Bella Abzug | | Democratic | 1970 | Incumbent re-elected. | nowrap | {{Plainlist|
- Bella Abzug (Democratic) 78.7%
- Stephen Posner (Republican) 15.6%
- Timothy A. Mitchell (Conservative) 4.9%
- Christiana A. Nelson (Socialist Labor) 0.4%
- Claire Moriarty (Socialist Workers) 0.4%
|- ! | Herman Badillo | | Democratic | 1970 | Incumbent re-elected. | nowrap | {{Plainlist|
- Herman Badillo (Democratic) 96.7%
- Mary C. Lynch (Conservative) 3.3%
|- ! | Jonathan Brewster Bingham | | Democratic | 1964 | Incumbent re-elected. | nowrap | {{Plainlist|
- Jonathan Brewster Bingham (Democratic) 76.6%
- John DiGiovanni (Conservative) 14.4%
- Robert Black (Republican) 9.0%
|- ! | Peter A. Peyser | | Republican | 1970 | Incumbent re-elected. | nowrap | {{Plainlist|
- Peter A. Peyser (Republican) 57.6%
- William S. Greenawalt (Democratic) 42.4%
|- ! | Ogden R. Reid | | Democratic | 1962 | | Incumbent retired to run for Governor of New York. Democratic hold. | nowrap | {{Plainlist|
- Richard Ottinger (Democratic) 57.8%
- Charles Stephens (Republican) 42.2%
|- ! | Hamilton Fish IV | | Republican | 1968 | Incumbent re-elected. | nowrap | {{Plainlist|
- Hamilton Fish IV (Republican) 65.3%
- Nicholas Angell (Democratic) 33.6%
- Sanford P. Cohen (Liberal) 1.2%
|- ! | Benjamin A. Gilman | | Republican | 1972 | Incumbent re-elected. | nowrap | {{Plainlist|
- Benjamin A. Gilman (Republican) 54.0%
- John G. Dow (Democratic) 38.5%
- Thomas Moore (Conservative) 7.5%
|- ! | Howard W. Robison | | Republican | 1958 | | Incumbent retired. Democratic gain. | nowrap | {{Plainlist|
- Matthew F. McHugh (Democratic) 52.8%
- Alfred J. Libous (Republican) 43.1%
- Franklin B. Resseguie (Conservative) 4.1%
|- ! | Samuel S. Stratton | | Democratic | 1958 | Incumbent re-elected. | nowrap | {{Plainlist|
- Samuel S. Stratton (Democratic) 80.6%
- Wayne E. Wagner (Republican) 17.3%
- Edward Breitenbach (Conservative) 2.1%
|- ! | Carleton J. King | | Republican | 1960 | | Incumbent lost re-election. Democratic gain. | nowrap | {{Plainlist|
- Edward W. Pattison (Democratic) 54.2%
- Carleton J. King (Republican) 45.8%
|- ! | Robert C. McEwen | | Republican | 1964 | Incumbent re-elected. | nowrap | {{Plainlist|
- Robert C. McEwen (Republican) 55.0%
- Roger W. Tubby (Democratic) 45.0%
|- ! | Donald J. Mitchell | | Republican | 1972 | Incumbent re-elected. | nowrap | {{Plainlist|
- Donald J. Mitchell (Republican) 59.6%
- Donald J. Reile (Democratic) 37.7%
- Theodore L. Tolles (Liberal) 2.7%
|- ! | James M. Hanley | | Democratic | 1964 | Incumbent re-elected. | nowrap | {{Plainlist|
- James M. Hanley (Democratic) 59.1%
- William E. Bush (Republican) 40.9%
|- ! | William F. Walsh | | Republican | 1972 | Incumbent re-elected. | nowrap | {{Plainlist|
- William F. Walsh (Republican) 65.3%
- Robert H. Bockman (Democratic) 30.2%
- Francis H. Aspinwall (Conservative) 3.3%
- Bessie C. Noble (Liberal) 1.2%
|- ! | Frank Horton | | Republican | 1962 | Incumbent re-elected. | nowrap | {{Plainlist|
- Frank Horton (Republican) 67.5%
- Irene Gossin (Democratic) 29.0%
- J. Warren McGee (Conservative) 2.8%
- Virginia Tadio (Liberal) 0.7%
|- ! | Barber Conable | | Republican | 1964 | Incumbent re-elected. | nowrap | {{Plainlist|
- Barber Conable (Republican) 56.8%
- Margaret Costanza (Democratic) 39.6%
- Clarence E. Carman Jr. (Conservative) 2.9%
- David L. MacAdam (Liberal) 0.7%
|- ! | Henry P. Smith III | | Republican | 1964 | | Incumbent retired. Democratic gain. | nowrap | {{Plainlist|
- John J. LaFalce (Democratic) 59.6%
- Russell A. Rourke (Republican) 40.4%
|- ! | Thaddeus J. Dulski | | Democratic | 1958 | | Incumbent retired. Democratic hold. | nowrap | {{Plainlist|
- Henry J. Nowak (Democratic) 75.0%
- Joseph R. Bala (Republican) 24.6%
- Ira Liebowitz (Socialist Labor) 0.5%
|- ! | Jack Kemp | | Republican | 1970 | Incumbent re-elected. | nowrap | {{Plainlist|
- Jack Kemp (Republican) 72.1%
- Barbara C. Wicks (Democratic) 27.9%
|- ! | James F. Hastings | | Republican | 1968 | Incumbent re-elected. | nowrap | {{Plainlist|
- James F. Hastings (Republican) 60.2%
- William L. Parment (Democratic) 37.1%
- Joseph V. Damiano (Conservative) 2.6%
|}
North Carolina
|- ! | Walter B. Jones Sr. | | Democratic | 1966 | Incumbent re-elected. | nowrap | {{Plainlist|
- Walter B. Jones Sr. (Democratic) 77.5%
- Harry McMullan (Republican) 22.5%
|- ! | Lawrence H. Fountain | | Democratic | 1952 | Incumbent re-elected. | nowrap | {{Plainlist|
- Lawrence H. Fountain (Democratic)
- Unopposed
|- ! | David N. Henderson | | Democratic | 1960 | Incumbent re-elected. | nowrap | {{Plainlist|
- David N. Henderson (Democratic)
- Unopposed
|- ! | Ike Franklin Andrews | | Democratic | 1972 | Incumbent re-elected. | nowrap | {{Plainlist|
- Ike Franklin Andrews (Democratic) 64.7%
- Ward Purrington (Republican) 34.6%
- Michael Henderson Smedberg (Socialist Labor) 0.7%
|- ! | Wilmer Mizell | | Republican | 1968 | | Incumbent lost re-election. Democratic gain. | nowrap | {{Plainlist|
- Stephen L. Neal (Democratic) 52.0%
- Wilmer Mizell (Republican) 47.6%
- Lauren Eugene Brubaker (Socialist Labor) 0.3%
|- ! | L. Richardson Preyer | | Democratic | 1968 | Incumbent re-elected. | nowrap | {{Plainlist|
- L. Richardson Preyer (Democratic) 63.7%
- R. S. "Steve" Ritchie (Republican) 35.9%
- Harry Allen Frigg (Socialist Labor) 0.4%
|- ! | Charlie Rose | | Democratic | 1972 | Incumbent re-elected. | nowrap | {{Plainlist|
- Charlie Rose (Democratic)
- Unopposed
|- ! | Earl B. Ruth | | Republican | 1968 | | Incumbent lost re-election. Democratic gain. | nowrap | {{Plainlist|
- Bill Hefner (Democratic) 57.0%
- Earl B. Ruth (Republican) 43.0%
|- ! | James G. Martin | | Republican | 1972 | Incumbent re-elected. | nowrap | {{Plainlist|
- James G. Martin (Republican) 54.4%
- Milton Short (Democratic) 44.1%
- Geoffrey Michael Hooks (Socialist Labor) 1.6%
|- ! | James T. Broyhill | | Republican | 1962 | Incumbent re-elected. | nowrap | {{Plainlist|
- James T. Broyhill (Republican) 54.4%
- Jack L. Rhyne (Democratic) 45.6%
|- ! | Roy A. Taylor | | Democratic | 1960 | Incumbent re-elected. | nowrap | {{Plainlist|
- Roy A. Taylor (Democratic) 66.0%
- Albert F. "Doc" Gilman (Republican) 34.0%
|}
North Dakota
|- ! | Mark Andrews | | Republican | 1963 (Special) | Incumbent re-elected. | nowrap | {{Plainlist|
- Mark Andrews (Republican) 55.7%
- Byron Dorgan (Democratic) 44.3%
|}
Ohio
Main article: 1974 United States House of Representatives elections in Ohio
|- ! | Tom Luken | | Democratic | 1974 Special | | Incumbent lost re-election. Republican gain. | nowrap | {{Plainlist|
- Bill Gradison (Republican) 50.9%
- Tom Luken (Democratic) 49.1%
|- ! | Donald D. Clancy | | Republican | 1960 | Incumbent re-elected. | nowrap | {{Plainlist|
- Donald D. Clancy (Republican) 53.4%
- Edward W. Wolterman (Democratic) 46.6%
|- ! | Charles W. Whalen Jr. | | Republican | 1966 | Incumbent re-elected. | nowrap | {{Plainlist|
- Charles W. Whalen Jr. (Republican)
- Unopposed
|- ! | Tennyson Guyer | | Republican | 1972 | Incumbent re-elected. | nowrap | {{Plainlist|
- Tennyson Guyer (Republican) 61.5%
- James L. Gehrlich (Democratic) 38.5%
|- ! | Del Latta | | Republican | 1958 | Incumbent re-elected. | nowrap | {{Plainlist|
- Del Latta (Republican) 62.5%
- Bruce Edwards (Democratic) 37.5%
|- ! | Bill Harsha | | Republican | 1960 | Incumbent re-elected. | nowrap | {{Plainlist|
- Bill Harsha (Republican) 68.8%
- Lloyd Allan Wood (Democratic) 31.2%
|- ! | Bud Brown | | Republican | 1965 (Special) | Incumbent re-elected. | nowrap | {{Plainlist|
- Bud Brown (Republican) 60.5%
- Patrick L. Nelson (Democratic) 28.7%
- Dorothy Franke (Independent) 10.8%
|- ! | Walter E. Powell | | Republican | 1970 | | Incumbent retired. Republican hold. | nowrap | {{Plainlist|
- Tom Kindness (Republican) 42.4%
- T. Edward Strinko (Democratic) 38.0%
- Don Gingerich (Independent) 19.6%
|- ! | Thomas L. Ashley | | Democratic | 1954 | Incumbent re-elected. | nowrap | {{Plainlist|
- Thomas L. Ashley (Democratic) 52.8%
- Carleton S. Finkbeiner Jr. (Republican) 47.2%
|- ! | Clarence E. Miller | | Republican | 1966 | Incumbent re-elected. | nowrap | {{Plainlist|
- Clarence E. Miller (Republican) 70.4%
- H. Kent Bumpass (Democratic) 29.6%
|- ! | J. William Stanton | | Republican | 1964 | Incumbent re-elected. | nowrap | {{Plainlist|
- J. William Stanton (Republican) 60.5%
- Michael D. Coffey (Democratic) 39.5%
|- ! | Samuel L. Devine | | Republican | 1958 | Incumbent re-elected. | nowrap | {{Plainlist|
- Samuel L. Devine (Republican) 50.9%
- Fran Ryan (Democratic) 49.1%
|- ! | Charles Adams Mosher | | Republican | 1960 | Incumbent re-elected. | nowrap | {{Plainlist|
- Charles Adams Mosher (Republican) 57.5%
- Fred M. Ritenauer (Democratic) 42.5%
|- ! | John F. Seiberling | | Democratic | 1970 | Incumbent re-elected. | nowrap | {{Plainlist|
- John F. Seiberling (Democratic) 75.4%
- Mark Figetakis (Republican) 24.6%
|- ! | Chalmers P. Wylie | | Republican | 1966 | Incumbent re-elected. | nowrap | {{Plainlist|
- Chalmers P. Wylie (Republican) 61.5%
- Manley L. McGee (Republican) 38.5%
|- ! | Ralph Regula | | Republican | 1972 | Incumbent re-elected. | nowrap | {{Plainlist|
- Ralph Regula (Republican) 65.6%
- John G. Freedom (Democratic) 34.4%
|- ! | John M. Ashbrook | | Republican | 1960 | Incumbent re-elected. | nowrap | {{Plainlist|
- John M. Ashbrook (Republican) 52.7%
- David D. Noble (Democratic) 47.3%
- Clifford J. Simpson (Independent) 0.002%
|- ! | Wayne L. Hays | | Democratic | 1948 | Incumbent re-elected. | nowrap | {{Plainlist|
- Wayne L. Hays (Democratic) 65.6%
- Ralph H. Romig (Republican) 34.4%
|- ! | Charles J. Carney | | Democratic | 1970 | Incumbent re-elected. | nowrap | {{Plainlist|
- Charles J. Carney (Democratic) 72.7%
- James L. Ripple (Republican) 27.3%
|- ! | James V. Stanton | | Democratic | 1970 | Incumbent re-elected. | nowrap | {{Plainlist|
- James V. Stanton (Democratic) 86.9%
- Robert A. Frantz (Republican) 13.1%
|- ! | Louis Stokes | | Democratic | 1968 | Incumbent re-elected. | nowrap | {{Plainlist|
- Louis Stokes (Democratic) 82.0%
- Bill Mack (Republican) 18.0%
|- ! | Charles Vanik | | Democratic | 1954 | Incumbent re-elected. | nowrap | {{Plainlist|
- Charles Vanik (Democratic) 78.7%
- William J. Franz (Republican) 21.3%
|- ! | William Edwin Minshall Jr. | | Republican | 1954 | | Incumbent retired. Democratic gain. | nowrap | {{Plainlist|
- Ronald M. Mottl (Democratic) 34.8%
- George E. Mastics (Republican) 30.5%
- Dennis J. Kucinich (Independent) 29.4%
- Hugh J. Gallagher (Independent) 2.3%
- Bohdan A. Futey (Independent) 1.7%
- Arthur L. Cain (Independent) 1.3%
|}
Oklahoma
Main article: 1974 United States House of Representatives elections in Oklahoma
|- ! | James R. Jones | | Democratic | 1972 | Incumbent re-elected. | nowrap | {{Plainlist|
- James R. Jones (Democratic) 67.9%
- George Alfred Mizer Jr. (Republican) 32.1%
|- ! | Clem McSpadden | | Democratic | 1972 | | Incumbent retired to run for Governor of Oklahoma. Democratic hold. | nowrap | {{Plainlist|
- Ted Risenhoover (Democratic) 59.1%
- Ralph F. Keen (Republican) 40.9%
|- ! | Carl Albert | | Democratic | 1946 | Incumbent re-elected. | nowrap | {{Plainlist|
- Carl Albert (Democratic)
- Unopposed
|- ! | Tom Steed | | Democratic | 1948 | Incumbent re-elected. | nowrap | {{Plainlist|
- Tom Steed (Democratic)
- Unopposed
|- ! | John Jarman | | Democratic | 1950 | Incumbent re-elected. | nowrap | {{Plainlist|
- John Jarman (Democratic) 51.7%
- Mickey Edwards (Republican) 48.3%
|- ! | John Newbold Camp | | Republican | 1968 | | Incumbent lost re-election. Democratic gain. | nowrap | {{Plainlist|
- Glenn English (Democratic) 53.2%
- John Newbold Camp (Republican) 44.4%
- Bennett L. Basore (Independent) 2.3%
|}
Oregon
|- ! | Wendell Wyatt | | Republican | 1964 | | Incumbent retired. Democratic gain. | nowrap | {{Plainlist|
- Les AuCoin (Democratic) 56.1%
- Diarmuid O'Scannlain (Republican) 43.9%
|- ! | Albert C. Ullman | | Democratic | 1956 | Incumbent re-elected. | nowrap | {{Plainlist|
- Albert C. Ullman (Democratic) 78.1%
- Kenneth Brown (Republican) 21.9%
|- ! | Edith Green | | Democratic | 1954 | | Incumbent retired. Democratic hold. | nowrap | {{Plainlist|
- Robert B. Duncan (Democratic) 70.5%
- John Piacentini (Republican) 29.5%
|- ! | John R. Dellenback | | Republican | 1966 | | Incumbent lost re-election. Democratic gain. | nowrap | {{Plainlist|
- Jim Weaver (Democratic) 52.9%
- John R. Dellenback (Republican) 47.1%
|}
Pennsylvania
Main article: 1974 United States House of Representatives elections in Pennsylvania
|- ! | William A. Barrett | | Democratic | 1944 1946 (defeated) 1948 | Incumbent re-elected. | nowrap | {{Plainlist|
- William A. Barrett (Democratic) 75.8%
- Russel M. Nigro (Republican) 23.3%
- Bernard Salera (Socialist Labor) 0.9%
|- ! | Robert N. C. Nix Sr. | | Democratic | 1958 | Incumbent re-elected. | nowrap | {{Plainlist|
- Robert N. C. Nix Sr. (Democratic) 74.0%
- Jesse W. Woods Jr. (Republican) 26.0%
|- ! | William J. Green III | | Democratic | 1964 | Incumbent re-elected. | nowrap | {{Plainlist|
- William J. Green III (Democratic) 75.4%
- Richard P. Colbert (Republican) 24.6%
|- ! | Joshua Eilberg | | Democratic | 1966 | Incumbent re-elected. | nowrap | {{Plainlist|
- Joshua Eilberg (Democratic) 71.0%
- Isadore Einhorn (Republican) 29.0%
|- ! | John H. Ware III | | Republican | 1970 | | Incumbent retired. Republican hold. | nowrap | {{Plainlist|
- Richard T. Schulze (Republican) 59.6%
- Leo D. McDermott (Democratic) 40.4%
|- ! | Gus Yatron | | Democratic | 1968 | Incumbent re-elected. | nowrap | {{Plainlist|
- Gus Yatron (Democratic) 74.6%
- Stephen Postupack (Republican) 24.0%
- Frank E. Huet (Constitution) 1.4%
|- ! | Lawrence G. Williams | | Republican | 1966 | | Incumbent lost renomination. Democratic gain. | nowrap | {{Plainlist|
- Robert W. Edgar (Democratic) 55.3%
- Stephen J. McEwen Jr. (Republican) 43.7%
- Ralph F. Johns (Constitution) 1.1%
|- ! | Edward G. Biester Jr. | | Republican | 1966 | Incumbent re-elected. | nowrap | {{Plainlist|
- Edward G. Biester Jr. (Republican) 56.2%
- William B. Moyer (Democratic) 40.9%
- Robert D. McKenney (Constitution) 2.8%
|- ! | Bud Shuster | | Republican | 1972 | Incumbent re-elected. | nowrap | {{Plainlist|
- Bud Shuster (Republican) 56.5%
- Robert D. Ford (Democratic) 43.5%
|- ! | Joseph M. McDade | | Republican | 1962 | Incumbent re-elected. | nowrap | {{Plainlist|
- Joseph M. McDade (Republican) 64.9%
- Thomas J. Hanlon (Democratic) 35.1%
|- ! | Daniel J. Flood | | Democratic | 1944 1946 (defeated) 1948 1952 (defeated) 1954 | Incumbent re-elected. | nowrap | {{Plainlist|
- Daniel J. Flood (Democratic) 74.5%
- Richard A. Muzyka (Republican) 25.5%
|- ! | John Murtha | | Democratic | 1974 | Incumbent re-elected. | nowrap | {{Plainlist|
- John Murtha (Democratic) 58.1%
- Harry M. Fox (Republican) 41.9%
|- ! | R. Lawrence Coughlin | | Republican | 1968 | Incumbent re-elected. | nowrap | {{Plainlist|
- R. Lawrence Coughlin (Republican) 62.5%
- Lawrence H. Curry (Democratic) 37.5%
|- ! | William S. Moorhead | | Democratic | 1958 | Incumbent re-elected. | nowrap | {{Plainlist|
- William S. Moorhead (Democratic) 77.5%
- Zachary T. Davis (Republican) 22.5%
|- ! | Fred B. Rooney | | Democratic | 1963 (Special) | Incumbent re-elected. | nowrap | {{Plainlist|
- Fred B. Rooney (Democratic)
- Unopposed
|- ! | Edwin D. Eshleman | | Republican | 1966 | Incumbent re-elected. | nowrap | {{Plainlist|
- Edwin D. Eshleman (Republican) 63.5%
- Michael J. Minney (Democratic) 35.0%
- Arlene R. Wenger (Constitution) 1.5%
|- ! | Herman T. Schneebeli | | Republican | 1960 | Incumbent re-elected. | nowrap | {{Plainlist|
- Herman T. Schneebeli (Republican) 52.1%
- Peter C. Wambach (Democratic) 47.9%
|- ! | H. John Heinz III | | Republican | 1971 (Special) | Incumbent re-elected. | nowrap | {{Plainlist|
- H. John Heinz III (Republican) 72.1%
- Francis J. McArdle (Democratic) 27.9%
|- ! | George Atlee Goodling | | Republican | 1960 1964 (defeated) 1966 | | Incumbent retired. Republican hold. | nowrap | {{Plainlist|
- William F. Goodling (Republican) 51.4%
- Arthur L. Berger (Democratic) 47.5%
- Joseph Paul (Constitution) 1.0%
|- ! | Joseph M. Gaydos | | Democratic | 1968 | Incumbent re-elected. | nowrap | {{Plainlist|
- Joseph M. Gaydos (Democratic) 81.7%
- Joseph J. Anderko (Republican) 18.3%
|- ! | John H. Dent | | Democratic | 1958 | Incumbent re-elected. | nowrap | {{Plainlist|
- John H. Dent (Democratic) 69.9%
- Charles L. Sconing (Republican) 30.1%
|- ! | Thomas E. Morgan | | Democratic | 1944 | Incumbent re-elected. | nowrap | {{Plainlist|
- Thomas E. Morgan (Democratic) 63.6%
- James R. Montgomery (Republican) 31.7%
- John Bove (Constitution) 4.7%
|- ! | Albert W. Johnson | | Republican | 1963 (Special) | Incumbent re-elected. | nowrap | {{Plainlist|
- Albert W. Johnson (Republican) 52.7%
- Yates Mast (Democratic) 47.3%
|- ! | Joseph P. Vigorito | | Democratic | 1964 | Incumbent re-elected. | nowrap | {{Plainlist|
- Joseph P. Vigorito (Democratic) 58.6%
- Clement R. Scalzitti (Republican) 41.4%
|- ! | Frank M. Clark | | Democratic | 1954 | | Incumbent lost re-election. Republican gain. | nowrap | {{Plainlist|
- Gary A. Myers (Republican) 53.8%
- Frank M. Clark (Democratic) 46.2%
|}
Rhode Island
|- ! | Fernand St. Germain | | Democratic | 1960 | Incumbent re-elected. | nowrap | {{Plainlist|
- Fernand St. Germain (Democratic) 72.9%
- Ernest Barone (Republican) 27.1%
|- ! | Robert Tiernan | | Democratic | 1967 (Special) | | Incumbent lost renomination. Democratic hold. | nowrap | {{Plainlist|
- Edward Beard (Democratic) 78.2%
- Vincent J. Rotondo (Republican) 21.8%
|}
South Carolina
Main article: 1974 United States House of Representatives elections in South Carolina
|- ! | Mendel Jackson Davis | | Democratic | 1971 (Special) | Incumbent re-elected. | nowrap | {{Plainlist|
- Mendel Jackson Davis (Democratic) 72.7%
- George B. Rast (Republican) 25.9%
- Charles Amaker (Independent) 0.8%
- Benjamin Frasier (United Citizens) 0.6%
|- ! | Floyd Spence | | Republican | 1970 | Incumbent re-elected. | nowrap | {{Plainlist|
- Floyd Spence (Republican) 56.1%
- Matthew J. Perry (Democratic) 43.0%
- Paul Proveaux (Independent) 0.9%
|- ! | William Jennings Bryan Dorn | | Democratic | 1946 1948 (retired) 1950 | | Incumbent retired to run for Governor of South Carolina. Democratic hold. | nowrap | {{Plainlist|
- Butler Derrick (Democratic) 61.8%
- Marshall J. Parker (Republican) 38.2%
|- ! | James R. Mann | | Democratic | 1968 | Incumbent re-elected. | nowrap | {{Plainlist|
- James R. Mann (Democratic) 63.3%
- Robert L. Watkins (Republican) 36.7%
|- ! | Thomas S. Gettys | | Democratic | 1964 | | Incumbent retired. Democratic hold. | nowrap | {{Plainlist|
- Kenneth Lamar Holland (Democratic) 61.4%
- Lenard Phillips (Republican) 37.8%
- Bert Sumner (Independent) 0.8%
|- ! | Edward Lunn Young | | Republican | 1972 | | Incumbent lost re-election. Democratic gain. | nowrap | {{Plainlist|
- John Jenrette (Democratic) 52.0%
- Edward Lunn Young (Republican) 48.0%
|}
South Dakota
|- ! | Frank E. Denholm | | Democratic | 1970 | | Incumbent lost re-election. Republican gain. | nowrap | {{Plainlist|
- Larry Pressler (Republican) 55.3%
- Frank E. Denholm (Democratic) 44.7%
|- ! | James Abdnor | | Republican | 1972 | Incumbent re-elected. | nowrap | {{Plainlist|
- James Abdnor (Republican) 67.8%
- Jack M. Weiland (Democratic) 32.2%
|}
Tennessee
|- ! | Jimmy Quillen | | Republican | 1962 | Incumbent re-elected. | nowrap | {{Plainlist|
- Jimmy Quillen (Republican) 64.2%
- Lloyd Blevins (Democratic) 35.8%
|- ! | John Duncan Sr. | | Republican | 1964 | Incumbent re-elected. | nowrap | {{Plainlist|
- John Duncan Sr. (Republican) 70.9%
- Jesse James Brown (Democratic) 29.1%
|- ! | LaMar Baker | | Republican | 1970 | | Incumbent lost re-election. Democratic gain. | nowrap | {{Plainlist|
- Marilyn Lloyd (Democratic) 51.5%
- LaMar Baker (Republican) 46.2%
- Sarah Delaney (Independent) 2.2%
|- ! | Joe L. Evins | | Democratic | 1946 | Incumbent re-elected. | nowrap | {{Plainlist|
- Joe L. Evins (Democratic)
- Unopposed
|- ! | Richard Fulton | | Democratic | 1962 | Incumbent re-elected. | nowrap | {{Plainlist|
- Richard Fulton (Democratic) 99.8%
- Bill Tankard (Independent) 0.2%
|- ! | Robin Beard | | Republican | 1972 | Incumbent re-elected. | nowrap | {{Plainlist|
- Robin Beard (Republican) 56.7%
- Tim Schaeffer (Democratic) 43.3%
|- ! | Ed Jones | | Democratic | 1969 (Special) | Incumbent re-elected. | nowrap | {{Plainlist|
- Ed Jones (Democratic)
- Unopposed
|- ! | Dan Kuykendall | | Republican | 1966 | | Incumbent lost re-election. Democratic gain. | nowrap | {{Plainlist|
- Harold Ford Sr. (Democratic) 49.9%
- Dan Kuykendall (Republican) 49.4%
- Louis L. Porter (Independent) 0.7%
|}
Texas
Main article: 1974 United States House of Representatives elections in Texas
|- ! | Wright Patman | | Democratic | 1928 | Incumbent re-elected. | nowrap | {{Plainlist|
- Wright Patman (Democratic) 68.6%
- James W. Farris (Republican) 31.4%
|- ! | Charles Wilson | | Democratic | 1972 | Incumbent re-elected. | nowrap | {{Plainlist|
- Charles Wilson (Democratic)
- Unopposed
|- ! | James M. Collins | | Republican | 1968 | Incumbent re-elected. | nowrap | {{Plainlist|
- James M. Collins (Republican) 64.7%
- Harold Collum (Democratic) 35.3%
|- ! | Ray Roberts | | Democratic | 1962 | Incumbent re-elected. | nowrap | {{Plainlist|
- Ray Roberts (Democratic) 74.9%
- Dick LeTourneau (Republican) 25.1%
|- ! | Alan Steelman | | Republican | 1972 | Incumbent re-elected. | nowrap | {{Plainlist|
- Alan Steelman (Republican) 52.1%
- Mike McKool (Democratic) 47.9%
|- ! | Olin E. Teague | | Democratic | 1946 | Incumbent re-elected. | nowrap | {{Plainlist|
- Olin E. Teague (Democratic) 83.0%
- Carl Nigliazzo (Republican) 17.0%
|- ! | William Reynolds Archer Jr. | | Republican | 1970 | Incumbent re-elected. | nowrap | {{Plainlist|
- William Reynolds Archer Jr. (Republican) 79.2%
- Jim Brady (Democratic) 20.8%
|- ! | Robert C. Eckhardt | | Democratic | 1966 | Incumbent re-elected. | nowrap | {{Plainlist|
- Robert C. Eckhardt (Democratic) 72.2%
- Donald D. Whitefield (Republican) 27.8%
|- ! | Jack Brooks | | Democratic | 1952 | Incumbent re-elected. | nowrap | {{Plainlist|
- Jack Brooks (Democratic) 61.9%
- Coleman R. Ferguson (Republican) 38.1%
|- ! | J. J. Pickle | | Democratic | 1963 (Special) | Incumbent re-elected. | nowrap | {{Plainlist|
- J. J. Pickle (Democratic) 80.4%
- Paul A. Weiss (Republican) 19.6%
|- ! | William R. Poage | | Democratic | 1936 | Incumbent re-elected. | nowrap | {{Plainlist|
- William R. Poage (Democratic) 81.6%
- Don Clements (Republican) 17.2%
- Laurel N. Dunn (Independent) 1.1%
|- ! | Jim Wright | | Democratic | 1954 | Incumbent re-elected. | nowrap | {{Plainlist|
- Jim Wright (Democratic) 78.7%
- James S. Garvey (Republican) 21.3%
|- ! | Robert Price | | Republican | 1966 | | Incumbent lost re-election. Democratic gain. | nowrap | {{Plainlist|
- Jack Hightower (Democratic) 57.6%
- Robert Price (Republican) 42.4%
|- ! | John Andrew Young | | Democratic | 1956 | Incumbent re-elected. | nowrap | {{Plainlist|
- John Andrew Young (Democratic)
- Unopposed
|- ! | Kika de la Garza | | Democratic | 1964 | Incumbent re-elected. | nowrap | {{Plainlist|
- Kika de la Garza (Democratic)
- Unopposed
|- ! | Richard Crawford White | | Democratic | 1964 | Incumbent re-elected. | nowrap | {{Plainlist|
- Richard Crawford White (Democratic)
- Unopposed
|- ! | Omar Burleson | | Democratic | 1946 | Incumbent re-elected. | nowrap | {{Plainlist|
- Omar Burleson (Democratic)
- Unopposed
|- ! | Barbara Jordan | | Democratic | 1972 | Incumbent re-elected. | nowrap | {{Plainlist|
- Barbara Jordan (Democratic) 84.8%
- Robbins Mitchell (Republican) 14.0%
- Kris Vasquez (Socialist Workers) 1.2%
|- ! | George H. Mahon | | Democratic | 1934 | Incumbent re-elected. | nowrap | {{Plainlist|
- George H. Mahon (Democratic)
- Unopposed
|- ! | Henry B. González | | Democratic | 1961 (Special) | Incumbent re-elected. | nowrap | {{Plainlist|
- Henry B. González (Democratic)
- Unopposed
|- ! | O. C. Fisher | | Democratic | 1942 | | Incumbent retired. Democratic hold. | nowrap | {{Plainlist|
- Bob Krueger (Democratic) 52.6%
- Doug Harlan (Republican) 45.2%
- Ed Gallion (American) 2.2%
|- ! | Robert R. Casey | | Democratic | 1958 | Incumbent re-elected. | nowrap | {{Plainlist|
- Robert R. Casey (Democratic) 69.5%
- Ron Paul (Republican) 28.4%
- James T. Smith (American) 1.2%
- Jill Fein (Socialist Workers) 0.9%
|- ! | Abraham Kazen | | Democratic | 1966 | Incumbent re-elected. | nowrap | {{Plainlist|
- Abraham Kazen (Democratic)
- Unopposed
|- ! | Dale Milford | | Democratic | 1972 | Incumbent re-elected. | nowrap | {{Plainlist|
- Dale Milford (Democratic) 76.1%
- Joseph Beaman Jr. (Republican) 20.4%
- Earl W. Armstrong (American) 3.5%
|}
Utah
|- ! | K. Gunn McKay | | Democratic | 1970 | Incumbent re-elected. | nowrap | {{Plainlist|
- K. Gunn McKay (Democratic) 62.6%
- Ronald W. Inkley (Republican) 31.5%
- L. S. Brown (American) 5.9%
|- ! | Douglas W. Owens | | Democratic | 1972 | | Incumbent retired to run for U.S. senator. Democratic hold. | nowrap | {{Plainlist|
- Allan Howe (Democratic) 49.5%
- Stephen Harmsen (Republican) 46.9%
- Bruce R. Bangerter (American) 3.0%
- Karl J. Bray (Libertarian) 0.6%
|}
Vermont
|- ! | Richard W. Mallary | | Republican | 1972 (Special) | | Incumbent retired to run for U.S. senator. Republican hold. | nowrap | {{Plainlist|
- Jim Jeffords (Republican) 52.9%
- Francis J. Cain (Democratic) 38.1%
- Michael Parenti (Liberty) 7.1%
- Francis J. Cain (Independent) 1.9%
|}
Virginia
Main article: 1974 United States House of Representatives elections in Virginia
|- ! | Thomas N. Downing | | Democratic | 1958 | Incumbent re-elected. | nowrap | {{Plainlist|
- Thomas N. Downing (Democratic)
- Unopposed
|- ! | G. William Whitehurst | | Republican | 1968 | Incumbent re-elected. | nowrap | {{Plainlist|
- G. William Whitehurst (Republican) 60.0%
- Robert Richards (Democratic) 40.0%
|- ! | David E. Satterfield III | | Democratic | 1964 | Incumbent re-elected. | nowrap | {{Plainlist|
- David E. Satterfield III (Democratic) 89.5%
- Alan Robert Ogden (Independent) 10.5%
|- ! | Robert Daniel | | Republican | 1972 | Incumbent re-elected. | nowrap | {{Plainlist|
- Robert Daniel (Republican) 47.2%
- Lester E. Schlitz (Democratic) 35.9%
- Curtis W. Harris (Independent) 16.9%
|- ! | Dan Daniel | | Democratic | 1968 | Incumbent re-elected. | nowrap | {{Plainlist|
- Dan Daniel (Democratic)
- Unopposed
|- ! | M. Caldwell Butler | | Republican | 1972 | Incumbent re-elected. | nowrap | {{Plainlist|
- M. Caldwell Butler (Republican) 45.1%
- Paul J. Puckett (Democratic) 27.0%
- Warren D. Saunders (Independent) 26.1%
- Timothy A. McGay (Independent) 1.8%
|- ! | J. Kenneth Robinson | | Republican | 1970 | Incumbent re-elected. | nowrap | {{Plainlist|
- J. Kenneth Robinson (Republican) 52.7%
- George H. Gilliam (Democratic) 47.3%
|- ! | Stanford Parris | | Republican | 1972 | | Incumbent lost re-election. Democratic gain. | nowrap | {{Plainlist|
- Herbert Harris (Democratic) 57.6%
- Stanford Parris (Republican) 42.4%
|- ! | William C. Wampler | | Republican | 1952 1954 (defeated) 1966 | Incumbent re-elected. | nowrap | {{Plainlist|
- William C. Wampler (Republican) 50.9%
- Charles J. Horne (Democratic) 49.1%
|- ! | Joel T. Broyhill | | Republican | 1952 | | Incumbent lost re-election. Democratic gain. | nowrap | {{Plainlist|
- Joseph L. Fisher (Democratic) 53.6%
- Joel T. Broyhill (Republican) 45.2%
- Francis J. Speh (Independent) 1.2%
|}
Washington
|- ! | Joel Pritchard | | Republican | 1972 | Incumbent re-elected. | nowrap | {{Plainlist|
- Joel Pritchard (Republican) 69.5%
- W. R. Knedlik (Democratic) 28.6%
- Fred Lovgren (Socialist Workers) 1.1%
- Patricia Dolbeare (Labor) 0.8%
|- ! | Lloyd Meeds | | Democratic | 1964 | Incumbent re-elected. | nowrap | {{Plainlist|
- Lloyd Meeds (Democratic) 59.7%
- Ronald C. Reed (Republican) 38.9%
- Paul Roberts (Labor) 1.3%
|- ! | Julia Butler Hansen | | Democratic | 1960 | | Incumbent retired. Democratic hold. | nowrap | {{Plainlist|
- Don Bonker (Democratic) 60.9%
- A. Ludlow Kramer (Republican) 38.1%
- Evelyn K. Olafson (Labor) 1.0%
|- ! | Mike McCormack | | Democratic | 1970 | Incumbent re-elected. | nowrap | {{Plainlist|
- Mike McCormack (Democratic) 58.9%
- Floyd Paxton (Republican) 41.1%
|- ! | Tom Foley | | Democratic | 1964 | Incumbent re-elected. | nowrap | {{Plainlist|
- Tom Foley (Democratic) 64.3%
- Gary G. Gage (Republican) 35.7%
|- ! | Floyd Hicks | | Democratic | 1964 | Incumbent re-elected. | nowrap | {{Plainlist|
- Floyd Hicks (Democratic) 71.8%
- George M. Nalley (Republican) 28.2%
|- ! | Brock Adams | | Democratic | 1964 | Incumbent re-elected. | nowrap | {{Plainlist|
- Brock Adams (Democratic) 71.1%
- Raymond Pritchard (Republican) 28.9%
|}
West Virginia
|- ! | Bob Mollohan | | Democratic | 1952 1956 (retired) 1968 | Incumbent re-elected. | nowrap | {{Plainlist|
- Bob Mollohan (Democratic) 59.7%
- Joe Laurita Jr. (Republican) 40.3%
|- ! | Harley O. Staggers | | Democratic | 1948 | Incumbent re-elected. | nowrap | {{Plainlist|
- Harley O. Staggers (Democratic) 64.4%
- William H. "Bill" Loy (Republican) 35.6%
|- ! | John M. Slack Jr. | | Democratic | 1958 | Incumbent re-elected. | nowrap | {{Plainlist|
- John M. Slack Jr. (Democratic) 69.8%
- William L. Larcamp (Republican) 30.2%
|- ! | Ken Hechler | | Democratic | 1958 | Incumbent re-elected. | nowrap | {{Plainlist|
- Ken Hechler (Democratic)
- Unopposed
|}
Wisconsin
|- ! | Les Aspin | | Democratic | 1970 | Incumbent re-elected. | nowrap | {{Plainlist|
- Les Aspin (Democratic) 70.5%
- Leonard W. Smith (Republican) 29.5%
|- ! | Robert W. Kastenmeier | | Democratic | 1958 | Incumbent re-elected. | nowrap | {{Plainlist|
- Robert W. Kastenmeier (Democratic) 64.8%
- Elizabeth T. Miller (Republican) 35.2%
|- ! | Vernon Wallace Thomson | | Republican | 1960 | | Incumbent lost re-election. Democratic gain. | nowrap | {{Plainlist|
- Alvin Baldus (Democratic) 51.1%
- Vernon Wallace Thomson (Republican) 47.4%
- Keith Ellison (American) 1.4%
|- ! | Clement J. Zablocki | | Democratic | 1948 | Incumbent re-elected. | nowrap | {{Plainlist|
- Clement J. Zablocki (Democratic) 72.5%
- Lewis H. Collison (Republican) 23.8%
- Herbert O. Jahnke (American) 3.8%
|- ! | Henry S. Reuss | | Democratic | 1954 | Incumbent re-elected. | nowrap | {{Plainlist|
- Henry S. Reuss (Democratic) 80.0%
- Mildred A. Morries (Republican) 20.0%
|- ! | William A. Steiger | | Republican | 1966 | Incumbent re-elected. | nowrap | {{Plainlist|
- William A. Steiger (Republican) 59.5%
- Nancy J. Simenz (Democratic) 35.4%
- Harvey C. LeRoy (American) 5.1%
|- ! | Dave Obey | | Democratic | 1969 (Special) | Incumbent re-elected. | nowrap | {{Plainlist|
- Dave Obey (Democratic) 70.6%
- Josef Burger (Republican) 29.4%
|- ! | Harold Vernon Froehlich | | Republican | 1972 | | Incumbent lost re-election. Democratic gain. | nowrap | {{Plainlist|
- Robert John Cornell (Democratic) 54.4%
- Harold Vernon Froehlich (Republican) 45.6%
|- ! | Glenn Robert Davis | | Republican | 1947 (special) 1956 (retired) 1964 | | Incumbent lost renomination. Republican hold. | nowrap | {{Plainlist|
- Bob Kasten (Republican) 52.9%
- Lynn S. Adelman (Democratic) 45.0%
- William D. Quirk (American) 2.1%
|}
Wyoming
|- ! | Teno Roncalio | | Democratic | 1964 1966 (retired) 1970 | Incumbent re-elected. | nowrap | {{Plainlist|
- Teno Roncalio (Democratic) 54.7%
- Tom Strock (Republican) 45.3%
|}
Notes
References
Works cited
References
- James M. Naughton. (November 6, 1974). "Senate and House Margins Are Substantially Enlarged". New York Times.
- Lawrence, John A.. (May 26, 2018). "How the 'Watergate Babies' Broke American Politics". Politico Magazine.
- [http://history.house.gov/Institution/Election-Statistics/Election-Statistics/ Election Statistics - Office of the Clerk]
- (February 5, 1974). "Both Sides See Victory In Area Election Today". [[Indiana Gazette]].
- "PA District 12 – Special Election (1974)".
- "MI District 5 – Special Election (1974)".
- "OH District 1 – Special Election (1974)".
- "MI District 8 – Special Election (1974)".
- "CA District 6 – Special Election (1974)".
- "CA District 13 – Special Election (1974)".
This article was imported from Wikipedia and is available under the Creative Commons Attribution-ShareAlike 4.0 License. Content has been adapted to SurfDoc format. Original contributors can be found on the article history page.
Ask Mako anything about 1974 United States House of Representatives elections — get instant answers, deeper analysis, and related topics.
Research with MakoFree with your Surf account
Create a free account to save articles, ask Mako questions, and organize your research.
Sign up freeThis content may have been generated or modified by AI. CloudSurf Software LLC is not responsible for the accuracy, completeness, or reliability of AI-generated content. Always verify important information from primary sources.
Report