From Surf Wiki (app.surf) — the open knowledge base
1932 United States House of Representatives elections
House elections for the 73rd U.S. Congress
House elections for the 73rd U.S. Congress
| Field | Value |
|---|---|
| election_name | 1932 United States House of Representatives elections |
| country | United States |
| flag_year | 1912 |
| type | legislative |
| ongoing | no |
| previous_election | 1930 United States House of Representatives elections |
| previous_year | 1930 |
| next_election | 1934 United States House of Representatives elections |
| next_year | 1934 |
| outgoing_members | 72nd United States Congress#House of Representatives_3 |
| elected_members | 73rd United States Congress#House of Representatives_3 |
| seats_for_election | All 435 seats in the United States House of Representatives |
| majority_seats | 218 |
| election_date | September 12 and November 8, 1932 |
| image_size | x180px |
| party1 | Democratic Party (US) |
| image1 | John_Nance_Garner_(2).jpg |
| leader1 | John Nance Garner |
| leader_since1 | March 4, 1929 |
| leaders_seat1 | |
| last_election1 | 216 seats |
| seats1 | **313** |
| seat_change1 | 97 |
| popular_vote1 | **20,585,995** |
| percentage1 | **54.48%** |
| swing1 | 9.98 |
| party2 | Republican Party (US) |
| image2 | Bertrand Snell cph.3c04408.jpg |
| leader2 | Bertrand Snell |
| leader_since2 | March 4, 1931 |
| leaders_seat2 | |
| last_election2 | 218 seats |
| seats2 | 117 |
| seat_change2 | 101 |
| popular_vote2 | 15,900,829 |
| percentage2 | 42.08% |
| swing2 | 10.96 |
| party4 | Farmer–Labor Party |
| last_election4 | 1 seat |
| seats4 | 5 |
| seat_change4 | 4 |
| popular_vote4 | 389,001 |
| percentage4 | 1.01% |
| swing4 | 0.09 |
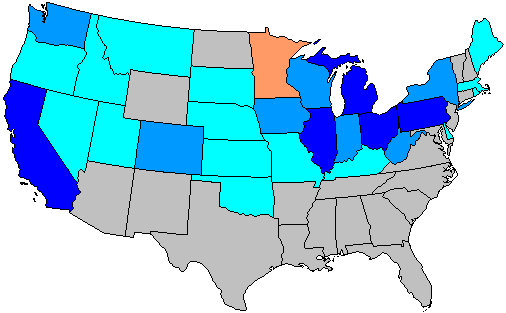
| map_image | File:The 1932 House Elections in the United States.svg |
| map_size | 320px |
| title | Speaker |
| before_election | John Nance Garner |
| before_party | Democratic Party (US) |
| after_election | Henry Rainey |
| after_party | Democratic Party (US) |
The 1932 United States House of Representatives elections were elections for the United States House of Representatives to elect members to serve in the 73rd United States Congress. They were held for the most part on November 8, 1932, while Maine held theirs on September 12. They coincided with the landslide election of President Franklin D. Roosevelt.
The inability of Herbert Hoover to deal with the Great Depression was the main issue surrounding this election, with his overwhelming unpopularity causing his Republican Party to lose 101 seats to Roosevelt's Democratic Party and the small Farmer–Labor Party, as the Democrats expanded the majority they had gained through special elections to a commanding level.
This round of elections was seen as a referendum on the once popular Republican business practices, which were eschewed for new, more liberal Democratic ideas. This was the first time since 1894 (and the last time ) that any party suffered triple-digit losses, and the Democrats posted their largest net seat pick-up in their history. These elections marked the beginning of a period of dominance in the House for the Democrats: with the exception of 1946 and 1952, the party would win every House election until 1994.
This was the first election after the congressional reapportionment based on the 1930 census, which was the first reapportionment since the passage of the Reapportionment Act of 1929 that permanently capped the House membership at 435 seats. Since no reapportionment (and in nearly all states no redistricting) had occurred after the 1920 census, the district boundary changes from the previous election were quite substantial, representing twenty years of population movement from small towns to the more Democratic cities.
Overall results
Source:
| Democratic Party (US)}};"**Democratic** | Republican Party (US)}};"**Republican** |
|---|
| House seats by party holding plurality in state |
|---|
]] |
| Net change in seats |
|---|
]] |}
Special elections
There were special elections in 1932 to serve the remainder of the current 72nd United States Congress.
Special elections are sorted by date then district.
|- ! | Fletcher Hale | | Republican | 1924 | | Incumbent died October 22, 1931. New member elected January 5, 1932. Democratic gain. Successor was subsequently re-elected in November, see below. | nowrap | {{Plainlist|
- William N. Rogers (Democratic) 52.8%
- John H. Bartlett (Republican) 47.2%
|- ! | Samuel Rutherford | | Democratic | 1924 | | Incumbent died February 4, 1932 New member elected March 2, 1932. Democratic hold. Successor subsequently retired in November; see below. | nowrap | {{Plainlist|
- Carlton Mobley (Democratic) 59.05%
- Harvey J. Kennedy (Democratic) 21.11%
- J. J. Flynt (Democratic) 13.05%
- W. O. Kenney (Democratic) 6.2%
- J. E. Binford (Independent) 0.33%
- G. A. Giles (Independent) 0.27%
|- ! | Percy Quin | | Democratic | 1912 | | Incumbent died February 4, 1932. New member elected March 15, 1932. Democratic hold. | nowrap | {{Plainlist|
- Lawrence R. Ellzey (Democratic) 49.1%
- R. W. Cutler (Democratic) 29.9%
- Dan Bramlette (Democratic) 21.0%
|- ! | Félix Córdova Dávila | 1917 (special) | | Incumbent resigned April 11, 1932, to become Associate Justice of the Supreme Court of Puerto Rico. New Delegate elected April 15, 1932. Independent gain. Winner was not elected to finish the term; see below. | {{Plainlist|
- José Lorenzo Pesquera (Independent)
|- ! | J. Russell Leech | | Republican | 1926 | | Incumbent resigned January 29, 1932, to become a member of the U.S. Board of Tax Appeals. New member elected April 26, 1932. Republican hold. | nowrap | {{Plainlist|
- Howard W. Stull (Republican) 44.35%
- George E. Wolfe (Democratic) 42.88%
- Joseph J. Kintner (Jobless) 12.77%
|- ! | Edward E. Eslick | | Democratic | 1924 | | Incumbent died June 14, 1932. New member elected August 14, 1932. Democratic hold. | nowrap | {{Plainlist|
- Willa Blake Eslick (Democratic) 50.7%
- Job D. Garner (Independent) 28.8%
- S. E. Hunt (Independent) 12.3%
- Lee Conway (Independent) 8.2%
|- ! | Charles R. Crisp | | Democratic | 1896 (special) | | Incumbent resigned October 7, 1932, to become a member of the U.S. Tariff Commission. New member elected November 8, 1932. Democratic hold. | nowrap | {{Plainlist|
- Bryant T. Castellow (Democratic)
- Unopposed
|- ! | J. Charles Linthicum | | Democratic | 1910 | | Incumbent died October 5, 1932. New member elected November 8, 1932. Democratic hold. | nowrap | {{Plainlist|
- Ambrose J. Kennedy (Democratic)
- Unopposed
|- ! | George A. Welsh | | Republican | 1922 | | Incumbent resigned May 31, 1932, to become judge for the U.S. District Court for the Eastern District of Pennsylvania. New member elected November 8, 1932. Republican hold. | nowrap | {{Plainlist|
- Robert L. Davis (Republican) 54.1%
- Leo J. Horton (Democratic) 45.9%
|- ! | Edward M. Beers | | Republican | 1922 | | Incumbent died April 21, 1932. New member elected November 8, 1932. Republican hold. Winner was not elected to the next term; see below. | nowrap | {{Plainlist|
- Joseph F. Biddle (Republican) 59.4%
- Meredith M. Meyers (Democratic) 40.6%
|- ! | Henry St. George Tucker III | | Democratic | 1888 1896 (retired) 1922 (special) | | Incumbent died July 23, 1932. New member elected November 8, 1932. Democratic hold. | nowrap | {{Plainlist|
- Joel W. Flood (Democratic)
- Unopposed
|}
Alabama
|- ! | John McDuffie | | Democratic | 1918 | Incumbent re-elected. | nowrap | {{Plainlist|
- John McDuffie (Democratic)
- Uncontested
|- ! | J. Lister Hill | | Democratic | 1923 (special) | Incumbent re-elected. | nowrap | {{Plainlist|
- J. Lister Hill (Democratic) 95.7%
- Frank Barchard (Republican) 3.8%
- W. H. Edwards (Socialist) 0.5%
|- ! | Henry B. Steagall | | Democratic | 1914 | Incumbent re-elected. | nowrap | {{Plainlist|
- Henry B. Steagall (Democratic)
- Uncontested
|- ! | Lamar Jeffers | | Democratic | 1921 (special) | Incumbent re-elected. | nowrap | {{Plainlist|
- Lamar Jeffers (Democratic) 83.9%
- Hogan D. Stewart (Republican) 16.1%
|- ! rowspan=2 | | LaFayette L. Patterson | | Democratic | 1928 | | Incumbent lost renomination. Democratic loss.
- Miles C. Allgood (Democratic) 80.2%
- Joe Brown (Republican) 19.8%
|- | Miles C. Allgood Redistricted from the | | Democratic | 1922 | Incumbent re-elected.
|- ! | William B. Oliver | | Democratic | 1914 | Incumbent re-elected. | nowrap | {{Plainlist|
- William B. Oliver (Democratic)
- Uncontested
|- ! | William B. Bankhead Redistricted from the | | Democratic | 1916 | Incumbent re-elected. | nowrap | {{Plainlist|
- William B. Bankhead (Democratic) 73.5%
- James B. Sloan (Republican) 26.5%
|- ! | Edward B. Almon | | Democratic | 1914 | Incumbent re-elected. | nowrap | {{Plainlist|
- Edward B. Almon (Democratic)
- Uncontested
|- ! | George Huddleston | | Democratic | 1914 | Incumbent re-elected. | nowrap | {{Plainlist|
- George Huddleston (Democratic) 86.2%
- Paul G. Parsons (Republican) 10.1%
- Arlie Barber (Socialist) 2.7%
- Andrew E. Ausman (Progressive) 0.6%
- Lee Parsons (Communist) 0.4%
|}
Alaska Territory
See Non-voting delegates, below.
Arizona

|- ! | Lewis W. Douglas | | Democratic | 1926 | Incumbent re-elected. | nowrap | {{Plainlist|
- Lewis W. Douglas (Democratic) 70.8%
- H. B. Wilkinson (Republican) 27.9%
- Ladd Vomicil (Socialist) 1.0%
- Charles Lattal (Communist) 0.3%
|}
Arkansas
|- ! | William J. Driver | | Democratic | 1920 | Incumbent re-elected. | nowrap | {{Plainlist|
- William J. Driver (Democratic)
- Uncontested
|- ! | John E. Miller | | Democratic | 1930 | Incumbent re-elected. | nowrap | {{Plainlist|
- John E. Miller (Democratic) 92.1%
- Ira J. Mock (Republican) 7.9%
|- ! | Claude Fuller | | Democratic | 1928 | Incumbent re-elected. | nowrap | {{Plainlist|
- Claude Fuller (Democratic)
- Uncontested
|- ! | Effiegene Locke Wingo | | Democratic | 1930 | | Incumbent retired. Democratic hold. | nowrap | {{Plainlist|
- William B. Cravens (Democratic)
- Uncontested
|- ! | Heartsill Ragon | | Democratic | 1922 | Incumbent re-elected. | nowrap | {{Plainlist|
- Heartsill Ragon (Democratic) 90.5%
- A. L. Barbour (Republican) 9.5%
|- ! | David Delano Glover | | Democratic | 1928 | Incumbent re-elected. | nowrap | {{Plainlist|
- David Delano Glover (Democratic)
- Uncontested
|- ! | Tilman B. Parks | | Democratic | 1920 | Incumbent re-elected. | nowrap | {{Plainlist|
- Tilman B. Parks (Democratic)
- Uncontested
|}
California
Main article: 1932 United States House of Representatives elections in California
Nine new seats were added in reapportionment, increasing the delegation from 11 to 20 seats. Six of the new seats were won by Democrats, three by Republicans. Three Republican incumbents lost re-election to Democrats. Therefore, Democrats increased by 10 seats and Republicans decreased by 1.
| District | Incumbent | Party | Elected | Result | Candidates | |||
|---|---|---|---|---|---|---|---|---|
| Clarence F. Lea | Democratic | [1916](1916-united-states-house-of-representatives-elections-in-california) | Incumbent re-elected. | nowrap | {{Plainlist | |||
| Harry Lane Englebright | Republican | [1926](1926-united-states-house-of-representatives-elections-in-california) | Incumbent re-elected. | nowrap | {{Plainlist | |||
| Charles F. Curry Jr. | Republican | [1930](1930-united-states-house-of-representatives-elections-in-california) | Incumbent lost re-election. | |||||
| **Democratic gain.** | nowrap | {{Plainlist | ||||||
| Florence Prag Kahn | Republican | [1926](1926-united-states-house-of-representatives-elections-in-california) | Incumbent re-elected. | nowrap | {{Plainlist | |||
| Richard J. Welch | Republican | [1926](1926-united-states-house-of-representatives-elections-in-california) | Incumbent re-elected. | nowrap | {{Plainlist | |||
| Albert E. Carter | Republican | [1924](1924-united-states-house-of-representatives-elections-in-california) | Incumbent re-elected. | nowrap | {{Plainlist | |||
| None (new district) | New seat. | |||||||
| **Republican gain.** | nowrap | {{Plainlist | ||||||
| Arthur M. Free | Republican | [1920](1920-united-states-house-of-representatives-elections-in-california) | Incumbent lost re-election. | |||||
| **Democratic gain.** | nowrap | {{Plainlist | ||||||
| Henry E. Barbour | ||||||||
| Redistricted from the | Republican | [1918](1918-united-states-house-of-representatives-elections-in-california) | Incumbent lost re-election. | |||||
| **Democratic gain.** | nowrap | {{Plainlist | ||||||
| None (new district) | New seat. | |||||||
| **Democratic gain.** | nowrap | {{Plainlist | ||||||
| William E. Evans | ||||||||
| Redistricted from the | Republican | [1926](1926-united-states-house-of-representatives-elections-in-california) | Incumbent re-elected. | nowrap | {{Plainlist | |||
| None (new district) | New seat. | |||||||
| **Democratic gain.** | nowrap | {{Plainlist | ||||||
| None (new district) | New seat. | |||||||
| **Democratic gain.** | nowrap | {{Plainlist | ||||||
| None (new district) | New seat. | |||||||
| **Democratic gain.** | nowrap | {{Plainlist | ||||||
| None (new district) | New seat. | |||||||
| **Republican gain.** | nowrap | {{Plainlist | ||||||
| Joe Crail | ||||||||
| Redistricted from the | Republican | [1926](1926-united-states-house-of-representatives-elections-in-california) | Incumbent retired. | |||||
| **Democratic gain.** | nowrap | {{Plainlist | ||||||
| None (new district) | New seat. | |||||||
| **Democratic gain.** | nowrap | {{Plainlist | ||||||
| None (new district) | New seat. | |||||||
| **Democratic gain.** | nowrap | {{Plainlist | ||||||
| None (new district) | New seat. | |||||||
| **Republican gain.** | nowrap | {{Plainlist | ||||||
| Phil Swing | ||||||||
| Redistricted from the | Republican | [1920](1920-united-states-house-of-representatives-elections-in-california) | Incumbent retired. | |||||
| Republican hold. | nowrap | {{Plainlist |
Colorado
|- ! | William R. Eaton | | Republican | 1928 | | Incumbent lost re-election. Democratic gain. | nowrap | {{Plainlist|
- Lawrence Lewis (Democratic) 54.4%
- William R. Eaton (Republican) 43.5%
- Bruce Lamont (Socialist) 1.5%
- Charles Guynn (Communist) 0.3%
- W. R. Duke (Farmer–Labor) 0.3%
|- ! | Charles B. Timberlake | | Republican | 1914 | | Incumbent lost renomination. Democratic gain. | nowrap | {{Plainlist|
- Fred N. Cummings (Democratic) 52.9%
- George H. Bradfield (Republican) 47.1%
|- ! | Guy U. Hardy | | Republican | 1918 | | Incumbent lost re-election. Democratic gain. | nowrap | {{Plainlist|
- John Andrew Martin (Democratic) 50.9%
- Guy U. Hardy (Republican) 49.1%
|- ! | Edward T. Taylor | | Democratic | 1908 | Incumbent re-elected. | nowrap | {{Plainlist|
- Edward T. Taylor (Democratic) 66.0%
- Richard C. Callen (Republican) 34.0%
|}
Connecticut
|- ! | Augustine Lonergan | | Democratic | 1930 | | Retired to run for U.S. senator. Democratic hold. | nowrap | {{Plainlist|
- Herman P. Kopplemann (Democratic) 48.8%
- Clarence W. Seymour (Republican) 47.5%
- Fred M. Mansur (Socialist) 2.5%
- James L. McGuire (Ind. Republican) 0.9%
- Donald H. Loomis (Communist) 0.3%
|- ! | Richard P. Freeman | | Republican | 1914 | | Incumbent lost renomination. Republican hold. | nowrap | {{Plainlist|
- William L. Higgins (Republican) 49.4%
- William C. Fox (Democratic) 49.2%
- Elmer Jewett (Ind. Republican) 1.2%
- Michael H. Rollo (Wet) 0.2%
|- ! | John Q. Tilson | | Republican | 1914 | | Incumbent retired. Democratic gain. | nowrap | {{Plainlist|
- Francis T. Maloney (Democratic) 48.4%
- T. A. D. Jones (Republican) 46.2%
- Carl M. Rhodin (Socialist) 4.4%
- D. G. Griswold (Ind. Republican) 0.8%
- Horace Bloxaan (Communist) 0.2%
|- ! | William L. Tierney | | Democratic | 1930 | | Incumbent lost re-election. Republican gain. | nowrap | {{Plainlist|
- Schuyler Merritt (Republican) 49.7%
- William L. Tierney (Democratic) 44.5%
- Arnold E. Freese (Socialist) 5.0%
- Elsie Hill (Ind. Republican) 0.5%
- Dominick Cardinale (Communist) 0.3%
|- ! | Edward W. Goss | | Republican | 1930 | Incumbent re-elected. | nowrap | {{Plainlist|
- Edward W. Goss (Republican) 49.4%
- Martin E. Gormley (Democratic) 49.3%
- Irving T. Manchester (Ind. Republican) 1.2%
- Charles Crosnitski (Communist) 0.2%
|- ! | | New seat. Republican gain. | nowrap | {{Plainlist|
- Charles M. Bakewell (Republican) 48.0%
- William M. Citron (Democratic) 47.7%
- Isadore Polsky (Socialist) 3.3%
- Nathan B. Stone (Ind. Republican) 0.9%
- Konrad Loske (Communist) 0.2%
|}
Delaware
|- ! | Robert G. Houston | | Republican | 1924 | | Incumbent retired. Democratic gain. | nowrap | {{Plainlist|
- Wilbur L. Adams (Democratic) 46.1%
- Reuben Satterthwaite Jr. (Republican) 43.6%
- Francis B. Short (Prohibition) 9.4%
- Edgar G. Shaeffer (Socialist) 0.8%
- Frank Rhoades (Communist) 0.10%
|}
Florida
Main article: 1932 United States House of Representatives elections in Florida

|- ! | Herbert J. Drane | | Democratic | 1916 | | Incumbent lost renomination. Democratic hold. | nowrap | {{Plainlist|
- J. Hardin Peterson (Democratic) 76.4%
- Arthur R. Thompson (Republican) 23.6%
|- ! | Robert A. Green | | Democratic | 1924 | Incumbent re-elected. | nowrap | {{Plainlist|
- Robert A. Green (Democratic)
- Uncontested
|- ! | Tom Yon | | Democratic | 1926 | | Incumbent lost renomination. Democratic hold. | nowrap | {{Plainlist|
- Millard Caldwell (Democratic)
- Uncontested
|- ! | Ruth Bryan Owen | | Democratic | 1928 | | Incumbent lost renomination. Democratic hold. | nowrap | {{Plainlist|
- J. Mark Wilcox (Democratic)
- Uncontested
|- ! | | New seat. Democratic gain. | nowrap | {{Plainlist|
- William J. Sears (Democratic) 75.2%
- Glenn B. Skipper (Republican) 24.8% |}
Georgia
|- ! | Homer C. Parker | | Democratic | 1931 | Incumbent re-elected. | nowrap | {{Plainlist|
- Homer C. Parker (Democratic) 93.4%
- E. K. Overstreet Jr. (Republican) 6.6%
|- ! | E. Eugene Cox | | Democratic | 1924 | Incumbent re-elected. | nowrap | {{Plainlist|
- E. Eugene Cox (Democratic)
- Uncontested
|- ! | Charles R. Crisp | | Democratic | 1896 (special) 1896 (retired) 1912 | | Incumbent resigned October 7, 1932. Democratic hold. | nowrap | {{Plainlist|
- Bryant T. Castellow (Democratic)
- Uncontested
|- ! | William C. Wright | | Democratic | 1918 | | Incumbent retired. Democratic hold. | nowrap | {{Plainlist|
- Emmett M. Owen (Democratic) 99.9%
- H. O. Lovvorn (Republican) 0.08%
|- ! | Robert Ramspeck | | Democratic | 1929 | Incumbent re-elected. | nowrap | {{Plainlist|
- Robert Ramspeck (Democratic)
- Uncontested
|- ! rowspan=2 | | Carlton Mobley | | Democratic | 1932 (special) | | Incumbent retired. Democratic loss.
- Carl Vinson (Democratic) 99.9%
- George S. Jones (Republican) 0.1%
|- | Carl Vinson Redistricted from the | | Democratic | 1914 | Incumbent re-elected.
|- ! | Malcolm C. Tarver | | Democratic | 1926 | Incumbent re-elected. | nowrap | {{Plainlist|
- Malcolm C. Tarver (Democratic) 85.2%
- Regina Rambo Benson (Republican) 14.8%
|- ! | William C. Lankford Redistricted from the | | Democratic | 1918 | | Incumbent lost renomination. Democratic hold. | nowrap | {{Plainlist|
- Braswell Deen (Democratic) 95.6%
- H. J. Carswell (Republican) 4.4%
|- ! | John S. Wood | | Democratic | 1930 | Incumbent re-elected. | nowrap | {{Plainlist|
- John S. Wood (Democratic) 80.6%
- J. M. Johnson (Republican) 19.3%
- Lawrence A. Lewis (Independent) 0.1%
|- ! | Charles H. Brand Redistricted from the | | Democratic | 1916 | Incumbent re-elected. | nowrap | {{Plainlist|
- Charles H. Brand (Democratic) 100.0%
- C. L. Upchurch (Independent) 0.02%
|}
Hawaii Territory
See Non-voting delegates, below.
Idaho
|- ! | Burton L. French | | Republican | 1916 | | Incumbent lost re-election. Democratic gain. | nowrap | {{Plainlist|
- Compton I. White (Democratic) 54.9%
- Burton L. French (Republican) 41.8%
- Cornell (Liberty) 3.4%
|- ! | Addison T. Smith | | Republican | 1912 | | Incumbent lost re-election. Democratic gain. | nowrap | {{Plainlist|
- Thomas C. Coffin (Democratic) 55.0%
- Addison T. Smith (Republican) 43.8%
- Goold (Liberty) 1.1%
|}
Illinois
|- ! | Oscar Stanton De Priest | | Republican | 1928 | Incumbent re-elected. | nowrap | {{Plainlist|
- Oscar Stanton De Priest (Republican) 54.8%
- Harry Baker (Democratic) 43.9%
- Herbert Newton (Independent) 1.4%
|- ! | Morton D. Hull | | Republican | 1923 | | Incumbent retired. Republican hold. | nowrap | {{Plainlist|
- P. H. Moynihan (Republican) 50.8%
- Victor L. Schlaeger (Democratic) 45.7%
- Arthur M. Barnhart (Independent) 1.8%
- Lillian Herstein (Independent) 1.6%
|- ! | Edward A. Kelly | | Democratic | 1930 | Incumbent re-elected. | nowrap | {{Plainlist|
- Edward A. Kelly (Democratic) 55.8%
- Elliott W. Sproul (Republican) 44.2%
|- ! | Harry P. Beam | | Democratic | 1930 | Incumbent re-elected. | nowrap | {{Plainlist|
- Harry P. Beam (Democratic) 74.2%
- Casimer T. Janowski (Republican) 25.8%
|- ! | Adolph J. Sabath | | Democratic | 1906 | Incumbent re-elected. | nowrap | {{Plainlist|
- Adolph J. Sabath (Democratic) 70.9%
- Samuel S. Epstein (Republican) 28.3%
- Isaiah Joyce (Independent) 0.8%
|- ! | James T. Igoe | | Democratic | 1926 | | Incumbent lost renomination. Democratic hold. | nowrap | {{Plainlist|
- Thomas J. O'Brien (Democratic) 63.2%
- Alfred F. Rueben (Republican) 36.8%
|- ! | Leonard W. Schuetz | | Democratic | 1930 | Incumbent re-elected. | nowrap | {{Plainlist|
- Leonard W. Schuetz (Democratic) 58.1%
- M. A. Michaelson (Republican) 41.1%
- John M. Collins (Independent) 0.8%
|- ! | Peter C. Granata | | Republican | 1930 | | Incumbent lost re-election. Democratic gain. | nowrap | {{Plainlist|
- Leo Kocialkowski (Democratic) 72.2%
- Peter C. Granata (Republican) 27.8%
|- ! | Frederick A. Britten | | Republican | 1912 | Incumbent re-elected. | nowrap | {{Plainlist|
- Frederick A. Britten (Republican) 52.0%
- James McAndrews (Democratic) 47.3%
- Warren Lamson (Independent) 0.7%
|- ! | Carl R. Chindblom | | Republican | 1918 | | Incumbent lost renomination. Republican hold. | nowrap | {{Plainlist|
- James Simpson Jr. (Republican) 41.1%
- Charles H. Weber (Democratic) 40.6%
- Ralph E. Church (Independent) 18.2%
|- ! | Frank R. Reid | | Republican | 1922 | Incumbent re-elected. | nowrap | {{Plainlist|
- Frank R. Reid (Republican) 50.4%
- James A. Howell (Democratic) 49.6%
|- ! | John T. Buckbee | | Republican | 1926 | Incumbent re-elected. | nowrap | {{Plainlist|
- John T. Buckbee (Republican) 53.1%
- Charles H. Linscott (Democratic) 46.9%
|- ! | William Richard Johnson | | Republican | 1924 | | Incumbent lost renomination. Republican hold. | nowrap | {{Plainlist|
- Leo E. Allen (Republican) 56.1%
- Orestes H. Wright (Democratic) 43.9%
|- ! | John Clayton Allen | | Republican | 1924 | | Incumbent lost re-election. Democratic gain. | nowrap | {{Plainlist|
- Chester C. Thompson (Democratic) 53.9%
- John Clayton Allen (Republican) 46.1%
|- ! | Burnett M. Chiperfield | | Republican | 1930 | | Incumbent lost re-election. Democratic gain. | nowrap | {{Plainlist|
- J. Leroy Adair (Democratic) 56.9%
- Burnett M. Chiperfield (Republican) 43.1%
|- ! | William E. Hull | | Republican | 1922 | | Incumbent lost renomination. Republican hold. | nowrap | {{Plainlist|
- Everett Dirksen (Republican) 60.3%
- Edwin S. Carr (Democratic) 39.7%
|- ! | Homer W. Hall | | Republican | 1926 | | Incumbent lost re-election. Democratic gain. | nowrap | {{Plainlist|
- Frank Gillespie (Democratic) 53.5%
- Homer W. Hall (Republican) 46.5%
|- ! | William P. Holaday | | Republican | 1922 | | Incumbent lost re-election. Democratic gain. | nowrap | {{Plainlist|
- James A. Meeks (Democratic) 56.6%
- William P. Holaday (Republican) 43.4%
|- ! | Charles Adkins | | Republican | 1924 | | Incumbent lost re-election. Democratic gain. | nowrap | {{Plainlist|
- Donald C. Dobbins (Democratic) 57.7%
- Charles Adkins (Republican) 42.3%
|- ! | Henry T. Rainey | | Democratic | 1922 | Incumbent re-elected. | nowrap | {{Plainlist|
- Henry T. Rainey (Democratic) 63.8%
- William J. Thornton (Republican) 36.2%
|- ! | J. Earl Major | | Democratic | 1930 | Incumbent re-elected. | nowrap | {{Plainlist|
- J. Earl Major (Democratic) 59.8%
- Roy M. Seeley (Republican) 40.1%
- C. W. Morris (Independent) 0.05%
- A. Steed (Independent) 0.03%
|- ! | Charles A. Karch | | Democratic | 1930 | | Incumbent died in office. Democratic hold. | {{Plainlist|
- Edwin M. Schaefer (Democratic) 63.8%
- Stewart Campbell (Republican) 36.2%
|- ! | William W. Arnold | | Democratic | 1922 | Incumbent re-elected. | nowrap | {{Plainlist|
- William W. Arnold (Democratic) 64.3%
- T. Edward Austin (Republican) 35.7%
|- ! | Claude V. Parsons | | Democratic | 1930 | Incumbent re-elected. | nowrap | {{Plainlist|
- Claude V. Parsons (Democratic) 58.8%
- Arthur A. Miles (Republican) 41.2%
|- ! | Kent E. Keller | | Democratic | 1930 | Incumbent re-elected. | nowrap | {{Plainlist|
- Kent E. Keller (Democratic) 59.6%
- Edward E. Denison (Republican) 40.4%
|- ! rowspan=2 | (2 seats) | William H. Dieterich | | Democratic | 1930 | | Incumbent retired to run for U.S. senator. Democratic hold.
- Martin A. Brennan (Democratic) 26.8%
- Walter Nesbit (Democratic) 26.4%
- Richard Yates Jr. (Republican) 22.7%
- Julius Klein (Republican) 22.5%
- Hyman Schneid (Socialist) 0.6%
- George Koop (Socialist) 0.6%
- Anthony Pszczolkowski (Communist) 0.2%
- Leslie Raymond Hurt (Communist) 0.2%
- W. F. Alexander (Socialist Labor) 0.05%
- Clifton Crawford (Socialist Labor) 0.04%
- Pasquale Iovino (Independent) 0.02%
|- | Richard Yates Jr. | | Republican | 1918 | | Incumbent lost re-election. Democratic gain.
|}
Indiana
Indiana gained one seat in reapportionment. All of the incumbents were redistricted. The new seat was won by a Democrat and all the other incumbent Democrats won re-election. All three incumbent Republicans lost re-election, bringing the state from 8-3 Democratic to 12-0 Democratic.
|- ! | | New seat. Democratic gain. | nowrap | {{Plainlist|
- William T. Schulte (Democratic) 51.6%
- Oscar A. Ahlgren (Republican) 48.4%
|- ! | William R. Wood Redistricted from the | | Republican | 1914 | | Incumbent lost re-election. Democratic gain. | nowrap | {{Plainlist|
- George R. Durgan (Democratic) 54.2%
- William R. Wood (Republican) 45.8%
|- ! | Samuel B. Pettengill Redistricted from the | | Democratic | 1930 | Incumbent re-elected. | nowrap | {{Plainlist|
- Samuel B. Pettengill (Democratic) 56.1%
- Andrew J. Hickey (Republican) 43.9%
|- ! | David Hogg Redistricted from the | | Republican | 1924 | | Incumbent lost re-election. Democratic gain. | nowrap | {{Plainlist|
- James I. Farley (Democratic) 56.4%
- David Hogg (Republican) 43.6%
|- ! | Glenn Griswold Redistricted from the | | Democratic | 1930 | Incumbent re-elected. | nowrap | {{Plainlist|
- Glenn Griswold (Democratic) 54.1%
- J. Raymond Schutz (Republican) 45.9%
|- ! | Fred S. Purnell Redistricted from the | | Republican | 1916 | | Incumbent lost re-election. Democratic gain. | nowrap | {{Plainlist|
- Virginia E. Jenckes (Democratic) 53.8%
- Fred S. Purnell (Republican) 46.2%
|- ! | Arthur H. Greenwood Redistricted from the | | Democratic | 1922 | Incumbent re-elected. | nowrap | {{Plainlist|
- Arthur H. Greenwood (Democratic) 56.7%
- George W. Henley (Republican) 43.3%
|- ! | John W. Boehne Jr. Redistricted from the | | Democratic | 1930 | Incumbent re-elected. | nowrap | {{Plainlist|
- John W. Boehne Jr. (Democratic) 63.5%
- French Clements (Republican) 36.5%
|- ! | Eugene B. Crowe Redistricted from the | | Democratic | 1930 | Incumbent re-elected. | nowrap | {{Plainlist|
- Eugene B. Crowe (Democratic) 57.7%
- Chester A. Davis (Republican) 42.3%
|- ! | Harry C. Canfield Redistricted from the | | Democratic | 1922 | | Incumbent lost renomination. Democratic hold. | nowrap | {{Plainlist|
- Finly Gray (Democratic) 52.1%
- Ephraim F. Bowen (Republican) 47.9%
|- ! | William H. Larrabee Redistricted from the | | Democratic | 1930 | Incumbent re-elected. | nowrap | {{Plainlist|
- William H. Larrabee (Democratic) 54.4%
- Dale B. Spencer (Republican) 45.6%
|- ! | Louis Ludlow Redistricted from the | | Democratic | 1928 | Incumbent re-elected. | nowrap | {{Plainlist|
- Louis Ludlow (Democratic) 53.4%
- William H. Harrison (Republican) 46.6%
|}
Iowa
|- ! | William F. Kopp | | Republican | 1920 | | Incumbent lost re-election. Democratic gain. | nowrap | {{Plainlist|
- Edward C. Eicher (Democratic) 54.2%
- William F. Kopp (Republican) 45.8%
|- ! | Bernhard M. Jacobsen | | Democratic | 1930 | Incumbent re-elected. | nowrap | {{Plainlist|
- Bernhard M. Jacobsen (Democratic) 58.7%
- Frank W. Elliott (Republican) 41.3%
|- ! | Thomas J. B. Robinson | | Republican | 1922 | | Incumbent lost re-election. Democratic gain. | nowrap | {{Plainlist|
- Albert C. Willford (Democratic) 50.6%
- Thomas J. B. Robinson (Republican) 49.4%
|- ! | Gilbert N. Haugen | | Republican | 1898 | | Incumbent lost re-election. Democratic gain. | nowrap | {{Plainlist|
- Fred Biermann (Democratic) 59.7%
- Gilbert N. Haugen (Republican) 40.3%
|- ! rowspan=3 | | Cyrenus Cole | | Republican | 1920 | | Incumbent retired. Republican loss.
- Lloyd Thurston (Republican) 50.1%
- Lloyd Ellis (Democratic) 49.9%
|- | Lloyd Thurston Redistricted from the | | Republican | 1924 | Incumbent re-elected.
|- | C. William Ramseyer Redistricted from the | | Republican | 1914 | | Incumbent lost renomination. Republican loss.
|- ! | Cassius C. Dowell Redistricted from the | | Republican | 1914 | Incumbent re-elected. | nowrap | {{Plainlist|
- Cassius C. Dowell (Republican) 56.5%
- Charles S. Cooter (Democratic) 43.5%
|- ! | Charles Edward Swanson Redistricted from the | | Republican | 1928 | | Incumbent lost re-election. Democratic gain. | nowrap | {{Plainlist|
- Otha Wearin (Democratic) 56.3%
- Charles Edward Swanson (Republican) 43.7%
|- ! | Fred C. Gilchrist Redistricted from the | | Republican | 1930 | Incumbent re-elected. | nowrap | {{Plainlist|
- Fred C. Gilchrist (Republican) 53.4%
- William T. Branagan (Democratic) 46.6%
|- ! | Ed H. Campbell Redistricted from the | | Republican | 1928 | | Incumbent lost re-election. Democratic gain. | nowrap | {{Plainlist|
- Guy Gillette (Democratic) 54.9%
- Ed H. Campbell (Republican) 45.1%
|}
Kansas
The eighth district was eliminated when the state was reapportioned from eight to seven districts. Two incumbent Republicans lost re-election. One incumbent Republican lost renomination and the seat was won by the incumbent Republican from the district that was merged into his.
|- ! rowspan=2 | | William P. Lambertson | | Republican | 1928 | Incumbent re-elected.
- William P. Lambertson (Republican) 57.8%
- M. R. Howard (Democratic) 33.4%
- George C. Hall (Independent) 8.8%
|- | James G. Strong Redistricted from the | | Republican | 1918 | | Incumbent lost renomination. Republican loss.
|- ! | Ulysses Samuel Guyer | | Republican | 1926 | Incumbent re-elected. | nowrap | {{Plainlist|
- Ulysses Samuel Guyer (Republican) 51.7%
- B. J. Sheridan (Democratic) 48.3%
|- ! | Harold C. McGugin | | Republican | 1930 | Incumbent re-elected. | nowrap | {{Plainlist|
- Harold C. McGugin (Republican) 52.9%
- E. W. Patterson (Democratic) 44.9%
- Van Zant Rowe (Socialist) 2.2%
|- ! | Homer Hoch | | Republican | 1918 | | Incumbent lost re-election. Democratic gain. | nowrap | {{Plainlist|
- Randolph Carpenter (Democratic) 50.2%
- Homer Hoch (Republican) 49.5%
- F. M. Shonkwiler (Independent) 0.3%
|- ! | William Augustus Ayres Redistricted from the | | Democratic | 1922 | Incumbent re-elected. | nowrap | {{Plainlist|
- William Augustus Ayres (Democratic) 73.9%
- W. L. Farquharson (Republican) 26.1%
|- ! | Charles I. Sparks | | Republican | 1928 | | Incumbent lost re-election. Democratic gain. | nowrap | {{Plainlist|
- Kathryn O'Loughlin McCarthy (Democratic) 55.6%
- Charles I. Sparks (Republican) 44.4%
|- ! | Clifford R. Hope | | Republican | 1926 | Incumbent re-elected. | nowrap | {{Plainlist|
- Clifford R. Hope (Republican) 55.6%
- Aaron Coleman (Democratic) 44.4%
|}
Kentucky
Kentucky, reapportioned from 11 districts down to 9, elected all of its representatives on a statewide at-large ticket. Of the nine incumbent Democratic representatives, seven were re-elected on the general ticket and two retired, while both incumbent Republicans retired.
|- ! rowspan=11 | (9 seats) | W. Voris Gregory Redistricted from the | | Democratic | 1926 | Incumbent re-elected.
- Fred M. Vinson (Democratic) 6.6%
- John Y. Brown Sr. (Democratic) 6.6%
- Andrew J. May (Democratic) 6.6%
- Brent Spence (Democratic) 6.6%
- Virgil Chapman (Democratic) 6.6%
- Glover H. Cary (Democratic) 6.6%
- W. Voris Gregory (Democratic) 6.6%
- Cap R. Carden (Democratic) 6.6%
- Finley Hamilton (Democratic) 6.6%
- Hillard H. Smith (Republican) 4.5%
- Robert Blackburn (Republican) 4.5%
- William Lewis (Republican) 4.5%
- George P. Ellison (Republican) 4.5%
- D. E. McClure (Republican) 4.5%
- J. C. Speight (Republican) 4.5%
- Hugh H. Asher (Republican) 4.5%
- B. T. Rountree (Republican) 4.5%
- Frank B. Russell (Republican) 4.5%
- J. T. Scopes (Socialist) 0.04%
- J. J. Thobe (Socialist) 0.04%
- C. E. Trimble (Socialist) 0.04%
- W. G. Haag (Socialist) 0.04%
- E. C. Schulz (Socialist) 0.04%
- E. L. Nance (Socialist) 0.04%
- J. M. Woodward (Socialist) 0.04%
- H. L. Harwood (Socialist) 0.04%
- D. S. Bennett (Socialist) 0.04%
- Frank Reynolds (Communist) 0.003%
- George N. Conway (Communist) 0.003%
|- | Glover H. Cary Redistricted from the | | Democratic | 1930 | Incumbent re-elected.
|- | John Moore Redistricted from the | | Democratic | 1929 | | Incumbent retired. Democratic hold.
|- | Cap R. Carden Redistricted from the | | Democratic | 1930 | Incumbent re-elected.
|- | Brent Spence Redistricted from the | | Democratic | 1930 | Incumbent re-elected.
|- | Virgil Chapman Redistricted from the | | Democratic | 1930 | Incumbent re-elected.
|- | Ralph Gilbert Redistricted from the | | Democratic | 1930 | | Incumbent retired. Democratic hold.
|- | Fred M. Vinson Redistricted from the | | Democratic | 1930 | Incumbent re-elected.
|- | Andrew J. May Redistricted from the | | Democratic | 1930 | Incumbent re-elected.
|- | Maurice H. Thatcher Redistricted from the | | Republican | 1922 | | Incumbent retired. Republican loss.
|- | Charles Finley Redistricted from the | | Republican | 1930 | | Incumbent retired. Republican loss.
|}
Louisiana
Louisiana continued to elect its representatives based upon districts adopted in 1912. Those districts did not change until the 1968 elections.
|- ! | Joachim O. Fernández | | Democratic | 1930 | Incumbent re-elected. | nowrap | {{Plainlist|
- Joachim O. Fernández (Democratic)
- Uncontested
|- ! | Paul H. Maloney | | Democratic | 1930 | Incumbent re-elected. | nowrap | {{Plainlist|
- Paul H. Maloney (Democratic)
- Uncontested
|- ! | Numa F. Montet | | Democratic | 1929 | Incumbent re-elected. | nowrap | {{Plainlist|
- Numa F. Montet (Democratic)
- Uncontested
|- ! | John N. Sandlin | | Democratic | 1920 | Incumbent re-elected. | nowrap | {{Plainlist|
- John N. Sandlin (Democratic)
- Uncontested
|- ! | Riley J. Wilson | | Democratic | 1914 | Incumbent re-elected. | nowrap | {{Plainlist|
- Riley J. Wilson (Democratic)
- Uncontested
|- ! | Bolivar E. Kemp | | Democratic | 1924 | Incumbent re-elected. | nowrap | {{Plainlist|
- Bolivar E. Kemp (Democratic)
- Uncontested
|- ! | René L. De Rouen | | Democratic | 1927 | Incumbent re-elected. | nowrap | {{Plainlist|
- René L. De Rouen (Democratic)
- Uncontested
|- ! | John H. Overton | | Democratic | 1931 | | Retired to run for U.S. senator. Democratic hold. | nowrap | {{Plainlist|
- Cleveland Dear (Democratic)
- Uncontested
|}
Maine
Maine was redistricted from four seats down to three; of four Republican incumbents, only one was re-elected; one retired and two were defeated by Democratic challengers.
|- ! | Carroll L. Beedy | | Republican | 1920 | Incumbent re-elected. | nowrap | {{Plainlist|
- Carroll L. Beedy (Republican) 51.1%
- Joseph E. F. Connolly (Democratic) 48.9%
|- ! rowspan=2 | | Donald B. Partridge | | Republican | 1930 | | Incumbent retired. Republican loss.
- Edward C. Moran (Democratic) 51.8%
- John E. Nelson (Republican) 47.4%
- Frederick P. Bonney (Ind. Republican) 0.8%
|- | John E. Nelson Redistricted from the | | Republican | 1922 | | Incumbent lost re-election. Democratic gain.
|- ! | Donald F. Snow Redistricted from the | | Republican | 1928 | | Incumbent lost renomination. Democratic gain. | nowrap | {{Plainlist|
- John G. Utterback (Democratic) 50.1%
- Owen Brewster (Republican) 49.6%
- Carl S. Godfrey (Socialist) 0.3%
|}
Maryland
|- ! | T. Alan Goldsborough | | Democratic | 1920 | Incumbent re-elected. | nowrap | {{Plainlist|
- T. Alan Goldsborough (Democratic) 64.9%
- Harry T. Phoebus (Republican) 35.1%
|- ! | William P. Cole Jr. | | Democratic | 1930 | Incumbent re-elected. | nowrap | {{Plainlist|
- William P. Cole Jr. (Democratic) 67.3%
- David L. Elliott (Republican) 32.7%
|- ! | Vincent Luke Palmisano | | Democratic | 1926 | Incumbent re-elected. | nowrap | {{Plainlist|
- Vincent Luke Palmisano (Democratic) 72.8%
- R. Palmer Ingram (Republican) 23.8%
- Samuel M. Neistadt (Socialist) 2.9%
- Walter Potruzuski (Communist) 0.5%
|- ! | J. Charles Linthicum | | Democratic | 1910 | | Incumbent died October 5, 1932. Democratic hold. Winner also elected the same day to finish the current term. | nowrap | {{Plainlist|
- Ambrose Jerome Kennedy (Democratic) 66.0%
- Claude B. Sweezey (Republican) 31.6%
- James J. Kane (Socialist) 2.1%
- John Gattes (Communist) 0.3%
|- ! | Stephen W. Gambrill | | Democratic | 1924 | Incumbent re-elected. | nowrap | {{Plainlist|
- Stephen W. Gambrill (Democratic) 70.4%
- A. Kingsley Love (Republican) 29.6%
|- ! | David J. Lewis | | Democratic | 1930 | Incumbent re-elected. | nowrap | {{Plainlist|
- David J. Lewis (Democratic) 58.4%
- Harold C. Smith (Republican) 41.6%
|}
Massachusetts
Massachusetts was redistricted from 16 districts to 15; 10 Republican and 4 Democratic incumbents were re-elected, while 2 Republican incumbents retired in the old 8th and 9th districts; the new 8th containing parts of both elected a Democrat.
|- ! | Allen T. Treadway | | Republican | 1912 | Incumbent re-elected. | nowrap | {{Plainlist|
- Allen T. Treadway (Republican) 54.7%
- Thomas F. Cassidy (Democratic) 42.6%
- Paul C. Wicks (Socialist) 2.8%
|- ! | William J. Granfield | | Democratic | 1930 | Incumbent re-elected. | nowrap | {{Plainlist|
- William J. Granfield (Democratic) 49.9%
- Joshua L. Brooks (Republican) 45.7%
- F. Ralph Harlow (Socialist) 4.3%
|- ! | Frank H. Foss | | Republican | 1924 | Incumbent re-elected. | nowrap | {{Plainlist|
- Frank H. Foss (Republican) 51.5%
- M. Fred O'Connell (Democratic) 48.5%
|- ! | Pehr G. Holmes | | Republican | 1930 | Incumbent re-elected. | nowrap | {{Plainlist|
- Pehr G. Holmes (Republican) 55.0%
- John J. Walsh (Democratic) 45.0%
|- ! | Edith Nourse Rogers | | Republican | 1925 | Incumbent re-elected. | nowrap | {{Plainlist|
- Edith Nourse Rogers (Republican) 59.9%
- James J. Bruin (Democratic) 40.1%
|- ! | A. Piatt Andrew | | Republican | 1921 | Incumbent re-elected. | nowrap | {{Plainlist|
- A. Piatt Andrew (Republican) 67.7%
- James D. Burns (Democratic) 32.3%
|- ! | William P. Connery Jr. | | Democratic | 1922 | Incumbent re-elected. | nowrap | {{Plainlist|
- William P. Connery Jr. (Democratic) 56.6%
- Charles W. Lovett (Republican) 40.7%
- Joseph F. Massidda (Socialist) 2.7%
|- ! | Frederick W. Dallinger | | Republican | 1926 | | Incumbent resigned October 1, 1932. Democratic gain. | nowrap | {{Plainlist|
- Arthur D. Healey (Democratic) 51.1%
- George H. Norton (Republican) 48.9%
|- ! | Robert Luce Redistricted from the 13th district | | Republican | 1918 | Incumbent re-elected. | nowrap | {{Plainlist|
- Robert Luce (Republican) 51.4%
- Frederick S. Deitrick (Democratic) 47.4%
- William Barnard Smith (Prohibition) 1.2%
|- ! | George H. Tinkham Redistricted from the 11th district | | Republican | 1914 | Incumbent re-elected. | nowrap | {{Plainlist|
- George H. Tinkham (Republican) 60.3%
- John J. Crehan (Democratic) 39.7%
|- ! | John J. Douglass Redistricted from the 10th district | | Democratic | 1924 | Incumbent re-elected. | nowrap | {{Plainlist|
- John J. Douglass (Democratic) 85.7%
- William F. McDonald (Republican) 14.3%
|- ! | John W. McCormack | | Democratic | 1928 | Incumbent re-elected. | nowrap | {{Plainlist|
- John W. McCormack (Democratic) 72.9%
- Bernard Ginsburg (Republican) 27.1%
|- ! | Richard B. Wigglesworth | | Republican | 1928 | Incumbent re-elected. | nowrap | {{Plainlist|
- Richard B. Wigglesworth (Republican) 58.4%
- Edward G. Morris (Democratic) 41.6%
|- ! | Joseph W. Martin Jr. | | Republican | 1924 | Incumbent re-elected. | nowrap | {{Plainlist|
- Joseph W. Martin Jr. (Republican) 56.8%
- Andrew J. McGraw (Democratic) 43.2%
|- ! | Charles L. Gifford | | Republican | 1922 | Incumbent re-elected. | nowrap | {{Plainlist|
- Charles L. Gifford (Republican) 57.5%
- Thomas H. Buckley (Democratic) 39.6%
- Jacob Minkin (Socialist) 2.9%
|}
Michigan
Michigan was redistricted from 13 to 17 districts, adding four new districts in and around Detroit.
|- ! | | New seat. Democratic gain. | nowrap | {{Plainlist|
- George G. Sadowski (Democratic) 68.1%
- Charles H. Mahoney (Republican) 28.7%
- Joseph Billups (Communist) 1.6%
- Alex Levitt (Socialist) 1.3%
- Walter Ty Krentler (American) 0.3%
|- ! | Earl C. Michener | | Republican | 1918 | | Incumbent lost re-election. Democratic gain. | nowrap | {{Plainlist|
- John C. Lehr (Democratic) 50.6%
- Earl C. Michener (Republican) 48.3%
- Harold P. Marley (Socialist) 1.0%
- Ira Welsh (Communist) 0.2%
|- ! | Joseph L. Hooper | | Republican | 1925 | Incumbent re-elected. | nowrap | {{Plainlist|
- Joseph L. Hooper (Republican) 50.2%
- Charles E. Gauss (Democratic) 46.9%
- J. Robert Childs (Socialist) 1.4%
- Charles Francis Young (Prohibition) 1.3%
- E. M. Curry (Communist) 0.2%
|- ! | John C. Ketcham | | Republican | 1920 | | Incumbent lost re-election. Democratic gain. | nowrap | {{Plainlist|
- George Foulkes (Democratic) 51.6%
- John C. Ketcham (Republican) 47.2%
- Hale Tennant (Socialist) 1.2%
- Howard Harris (Communist) 0.07%
|- ! | Carl E. Mapes | | Republican | 1912 | Incumbent re-elected. | nowrap | {{Plainlist|
- Carl E. Mapes (Republican) 51.3%
- Winfield H. Caslow (Democratic) 47.3%
- Morris Armour (Socialist) 1.2%
- Arthur Briggs (Communist) 0.3%
|- ! | Seymour H. Person | | Republican | 1930 | | Incumbent lost re-election. Democratic gain. | nowrap | {{Plainlist|
- Claude E. Cady (Democratic) 47.8%
- Seymour H. Person (Republican) 39.5%
- Grant M. Hudson (Republican) 12.5%
- Spurgeon D. Gostelow (Prohibition) 0.1%
- William Carley (Communist) 0.1%
|- ! | Jesse P. Wolcott | | Republican | 1930 | Incumbent re-elected. | nowrap | {{Plainlist|
- Jesse P. Wolcott (Republican) 56.1%
- James G. Tucker (Democratic) 41.8%
- Emerald B. Dixon (Prohibition) 2.0%
- Edward L. Mills (Communist) 0.2%
|- ! | Michael J. Hart | | Democratic | 1931 | Incumbent re-elected. | nowrap | {{Plainlist|
- Michael J. Hart (Democratic) 53.5%
- William M. Smith (Republican) 44.9%
- Charles W. Crum (Socialist) 1.3%
- Howard L. Holmes (Prohibition) 0.3%
- John G. Zittel (Communist) 0.06%
|- ! | James C. McLaughlin | | Republican | 1906 | | Incumbent lost re-election. Democratic gain. | nowrap | {{Plainlist|
- Harry W. Musselwhite (Democratic) 52.2%
- James C. McLaughlin (Republican) 47.3%
- Clyde Smith (Communist) 0.5%
|- ! | Roy O. Woodruff | | Republican | 1920 | Incumbent re-elected. | nowrap | {{Plainlist|
- Roy O. Woodruff (Republican) 54.0%
- William J. Kelly (Democratic) 44.9%
- William Rabideau (Socialist) 1.0%
|- ! | Frank P. Bohn | | Republican | 1926 | | Incumbent lost re-election. Democratic gain. | nowrap | {{Plainlist|
- Prentiss M. Brown (Democratic) 50.0%
- Frank P. Bohn (Republican) 47.6%
- Eugene Le Roy (Socialist) 2.0%
- Alfred Bachman (Communist) 0.4%
|- ! | W. Frank James | | Republican | 1914 | Incumbent re-elected. | nowrap | {{Plainlist|
- W. Frank James (Republican) 62.5%
- Levi S. Rice (Democratic) 35.0%
- Arne Roine (Communist) 2.5%
|- ! | Clarence J. McLeod | | Republican | 1922 | Incumbent re-elected. | nowrap | {{Plainlist|
- Clarence J. McLeod (Republican) 52.4%
- Clarence E. Seebaldt (Democratic) 45.1%
- Alois Simon (Socialist) 1.8%
- Frank Sullivan (Communist) 0.8%
|- ! | Robert H. Clancy Redistricted from the | | Republican | 1926 | | Incumbent lost re-election. Democratic gain. | nowrap | {{Plainlist|
- Carl M. Weideman (Democratic) 50.4%
- Robert H. Clancy (Republican) 47.3%
- Arthur E. Kent (Socialist) 1.8%
- John Schmies (Communist) 0.6%
|- ! | | New seat. Democratic gain. | nowrap | {{Plainlist|
- John Dingell Sr. (Democratic) 48.3%
- Charles Bowles (Republican) 46.0%
- Robert D. Wardell (American) 3.4%
- Morton Allen (Socialist) 1.6%
- Bronislaw Wronski (Communist) 0.6%
|- ! | | New seat. Democratic gain. | nowrap | {{Plainlist|
- John Lesinski Sr. (Democratic) 53.0%
- Frank P. Darin (Republican) 44.2%
- Mint Nauta (Socialist) 1.5%
- John T. Pace (Communist) 1.2%
|- ! | | New seat. Republican gain. | nowrap | {{Plainlist|
- George A. Dondero (Republican) 52.6%
- Harry Mitchell (Democratic) 44.9%
- W. H. Allmendiger (Socialist) 2.1%
- Margaret Jenkins (Communist) 0.4%
|}
Minnesota
Main article: 1932 United States House of Representatives election in Minnesota
Minnesota, reapportioned from 10 seats down to 9, elected all representatives on a statewide general ticket. Of the 10 incumbents, only 1 Farmer–Labor and 1 Republican were re-elected. The other Republicans either lost re-election (4), lost renomination (3), or retired (1). The delegation changed therefore from overwhelmingly Republican (9–1) to a majority Farmer-Labor (5–4).
|- ! rowspan=10 | (9 seats) | Victor Christgau Redistricted from the | | Republican | 1928 | | Incumbent lost renomination. Republican hold.
- Magnus Johnson (Farmer–Labor) 5.0%
- Paul J. Kvale (Farmer–Labor) 4.9%
- Henry M. Arens (Farmer–Labor) 4.6%
- Ernest Lundeen (Farmer–Labor) 4.5%
- Theodore Christianson (Republican) 4.3%
- Einar Hoidale (Democratic) 4.1%
- Ray P. Chase (Republican) 4.1%
- Francis Shoemaker (Farmer–Labor) 4.1%
- Harold Knutson (Republican) 4.0%
- August H. Andresen (Republican) 4.0%
- William I. Nolan (Republican) 3.9%
- Conrad Selvig (Republican) 3.9%
- Joseph A. A. Burnquist (Republican) 3.9%
- Jacob L. Peterson (Farmer–Labor) 3.8%
- Henry Teigan (Farmer–Labor) 3.8%
- Christian F. Gaarenstroom (Farmer–Labor) 3.7%
- William A. Pittenger (Republican) 3.7%
- Nathaniel John Holmberg (Republican) 3.7%
- Arthur C. Townley (Farmer–Labor) 3.4%
- Robert Cook Bell (Democratic) 3.1%
- John P. Coughlin (Democratic) 2.8%
- Silas M. Bryan (Democratic) 2.7%
- Emil E. Holmes (Democratic) 2.6%
- James R. Bennett Jr. (Democratic) 2.5%
- Donald A. Chapman (Democratic) 2.4%
- Hugh T. Kennedy (Democratic) 2.4%
- John Bowe (Democratic) 2.4%
- Victor Christgau (Independent) 1.1%
- J. W. Anderson (Communist) 0.2%
- M. Karson (Communist) 0.1%
- Fred Lequier (Communist) 0.1%
- Melvin J. Maas (Independent) 0.01%
|- | August H. Andresen Redistricted from the | | Republican | 1924 | | Incumbent lost re-election. Farmer–Labor gain.
|- | Melvin Maas Redistricted from the | | Republican | 1926 | | Incumbent lost renomination. Democratic gain.
|- | William I. Nolan Redistricted from the | | Republican | 1929 (special) | | Incumbent lost re-election. Farmer–Labor gain.
|- | Harold Knutson Redistricted from the | | Republican | 1916 | Incumbent re-elected.
|- | Paul J. Kvale Redistricted from the | | Farmer–Labor | 1929 (special) | Incumbent re-elected.
|- | William A. Pittenger Redistricted from the | | Republican | 1928 | | Incumbent lost re-election. Farmer–Labor gain.
|- | Conrad Selvig Redistricted from the | | Republican | 1926 | | Incumbent lost re-election. Farmer–Labor gain.
|- | Godfrey G. Goodwin Redistricted from the | | Republican | 1924 | | Incumbent lost renomination. Republican hold.
|- | Frank Clague Redistricted from the | | Republican | 1920 | | Incumbent retired. Republican loss.
|}
Mississippi
Redistricted from 8 districts to 7, with most of the 8th district being added to the 7th.
|- ! | John E. Rankin | | Democratic | 1920 | Incumbent re-elected. | nowrap | {{Plainlist|
- John E. Rankin (Democratic) 97.0%
- T. C. Moore (Republican) 1.5%
- John R. Duberry (Republican) 1.5%
|- ! | Wall Doxey | | Democratic | 1928 | Incumbent re-elected. | nowrap | {{Plainlist|
- Wall Doxey (Democratic) 98.5%
- L. E. Oldham (Republican) 0.9%
- William McDonough (Republican) 0.6%
|- ! | William Madison Whittington | | Democratic | 1924 | Incumbent re-elected. | nowrap | {{Plainlist|
- William Madison Whittington (Democratic) 95.7%
- J. T. Spence (Republican) 2.5%
- Rice Hungerford Jr. (Republican) 1.7%
|- ! | T. Jeff Busby | | Democratic | 1922 | Incumbent re-elected. | nowrap | {{Plainlist|
- T. Jeff Busby (Democratic) 97.8%
- D. F. Elliott (Republican) 1.2%
- J. O. Martin (Republican) 0.9%
|- ! | Ross A. Collins | | Democratic | 1920 | Incumbent re-elected. | nowrap | {{Plainlist|
- Ross A. Collins (Democratic) 97.0%
- F. M. Robertson (Republican) 1.6%
- Anna W. Matthews (Republican) 1.3%
|- ! | Robert S. Hall | | Democratic | 1928 | | Lost renomination. Democratic hold. | nowrap | {{Plainlist|
- William M. Colmer (Democratic) 94.5%
- John R. Tally (Republican) 4.4%
- Charles M. Hays (Republican) 1.1%
|- ! | Lawrence R. Ellzey | | Democratic | 1932 | Incumbent re-elected. | nowrap | {{Plainlist|
- Lawrence R. Ellzey (Democratic) 95.6%
- George W. Forbes (Republican) 2.6%
- Loyal G. Reese (Republican) 1.4%
|}
Missouri
Missouri was reapportioned from 16 seats to 13, which were elected on a general ticket. The delegation went from 12 Democrats and 4 Republicans to 13 Democrats, 8 of them previous incumbents.
|- ! rowspan=16 | (13 seats) | Milton A. Romjue Redistricted from the | | Democratic | 1922 | Incumbent re-elected.
- John J. Cochran (Democratic) 4.9%
- James R. Claiborne (Democratic) 4.8%
- Joe Shannon (Democratic) 4.8%
- Clyde Williams (Democratic) 4.8%
- Clarence Cannon (Democratic) 4.8%
- Frank H. Lee (Democratic) 4.8%
- James E. Ruffin (Democratic) 4.8%
- Ralph F. Lozier (Democratic) 4.8%
- Jacob L. Milligan (Democratic) 4.8%
- Reuben T. Wood (Democratic) 4.8%
- Milton A. Romjue (Democratic) 4.8%
- Richard M. Duncan (Democratic) 4.8%
- Clement C. Dickinson (Democratic) 4.7%
- Leonidas C. Dyer (Republican) 2.9%
- Henry F. Niedringhaus (Republican) 2.9%
- James Stewart (Republican) 2.8%
- Philip A. Bennett (Republican) 2.8%
- John M. Hadley (Republican) 2.8%
- Carl Otto (Republican) 2.8%
- Louis E. Miller (Republican) 2.8%
- Sam A. Clark (Republican) 2.8%
- Joe J. Manlove (Republican) 2.8%
- Rowland L. Johnston (Republican) 2.8%
- David W. Hopkins (Republican) 2.8%
- John W. Palmer (Republican) 2.8%
- Manvel H. Davis (Republican) 2.8%
- Phillips (Socialist) 0.06%
- Morrison (Socialist) 0.06%
- Langley (Socialist) 0.06%
- Becker (Socialist) 0.06%
- Elliff (Socialist) 0.06%
- Anderson (Socialist) 0.06%
- Henschel (Socialist) 0.06%
- Davidson (Socialist) 0.06%
- Turner (Socialist) 0.06%
- Hill (Socialist) 0.06%
- Harrison (Socialist) 0.05%
- Shumaker (Socialist) 0.05%
- Thayer (Socialist) 0.05%
- Benz (Communist) 0.003%
|- | Ralph F. Lozier Redistricted from the | | Democratic | 1922 | Incumbent re-elected.
|- | Jacob L. Milligan Redistricted from the | | Democratic | 1922 | Incumbent re-elected.
|- | David W. Hopkins Redistricted from the | | Republican | 1929 | | Incumbent lost re-election. Democratic gain.
|- | Joe Shannon Redistricted from the | | Democratic | 1930 | Incumbent re-elected.
|- | Clement C. Dickinson Redistricted from the | | Democratic | 1930 | Incumbent re-elected.
|- | Robert D. Johnson Redistricted from the | | Democratic | 1931 | | Incumbent lost renomination. Democratic hold.
|- | William L. Nelson Redistricted from the | | Democratic | 1924 | | Incumbent lost renomination. Democratic hold.
|- | Clarence Cannon Redistricted from the | | Democratic | 1922 | Incumbent re-elected.
|- | John J. Cochran Redistricted from the | | Democratic | 1926 | Incumbent re-elected.
|- | Clyde Williams Redistricted from the | | Democratic | 1930 | Incumbent re-elected.
|- | James F. Fulbright Redistricted from the | | Democratic | 1930 | | Incumbent lost renomination. Democratic hold.
|- | William E. Barton Redistricted from the | | Democratic | 1930 | | Incumbent lost renomination. Democratic hold.
|- | Henry F. Niedringhaus Redistricted from the | | Republican | 1926 | | Incumbent lost re-election. Republican loss.
|- | Leonidas C. Dyer Redistricted from the | | Republican | 1914 | | Incumbent lost re-election. Republican loss.
|- | Joe J. Manlove Redistricted from the | | Republican | 1922 | | Incumbent retired. Republican loss.
|}
Montana
|- ! | John M. Evans | | Democratic | 1922 | | Incumbent lost renomination. Democratic hold. | nowrap | {{Plainlist|
- Joseph P. Monaghan (Democratic) 59.0%
- Mark D. Fitzgerald (Republican) 38.4%
- A. N. Brooks (Socialist) 2.2%
- Roger Murray (Communist) 0.3%
|- ! | Scott Leavitt | | Republican | 1922 | | Incumbent lost re-election. Democratic gain. | nowrap | {{Plainlist|
- Roy E. Ayers (Democratic) 52.5%
- Scott Leavitt (Republican) 44.1%
- J. H. Matheson (Democratic) 1.3%
- Harry Juul (Communist) 1.2%
- H. F. Fuerstnow (Liberty) 0.9%
|}
Nebraska
|- ! | John H. Morehead | | Democratic | 1922 | Incumbent re-elected. | nowrap | {{Plainlist|
- John H. Morehead (Democratic) 58.0%
- Marcus L. Poteet (Republican) 40.2%
- Daniel Hill (Socialist) 1.8%
|- ! | Howard M. Baldrige | | Republican | 1930 | | Incumbent lost re-election. Democratic gain. | nowrap | {{Plainlist|
- Edward R. Burke (Democratic) 51.3%
- Howard M. Baldrige (Republican) 43.8%
- Grenville P. North (Independent) 1.7%
- Hugh W. Thomas (Independent) 1.3%
- Arthur F. Stearns (Socialist) 1.1%
- Claude L. Nethaway (Independent) 0.4%
- Henry Hoffman (Independent) 0.4%
|- ! | Edgar Howard | | Democratic | 1922 | Incumbent re-elected. | nowrap | {{Plainlist|
- Edgar Howard (Democratic) 66.0%
- H. Halderson (Republican) 29.3%
- M. F. Hall (Independent) 3.4%
- Aug. Hohneke (Socialist) 1.3%
|- ! rowspan=2 | | John N. Norton | | Democratic | 1930 | | Incumbent lost renomination. Democratic loss.
- Ashton C. Shallenberger (Democratic) 44.8%
- Fred G. Johnson (Republican) 32.5%
- Charles G. Binderup (Independent) 17.6%
- Charles M. Bosley (Independent) 4.0%
- Peter Uerling (Socialist) 1.2%
|- | Ashton C. Shallenberger Redistricted from the | | Democratic | 1930 | Incumbent re-elected.
|- ! | Robert G. Simmons Redistricted from the | | Republican | 1922 | | Incumbent lost re-election. Democratic gain. | nowrap | {{Plainlist|
- Terry Carpenter (Democratic) 51.3%
- Robert G. Simmons (Republican) 47.1%
- A. E. Bell (Socialist) 1.5%
|}
Nevada
|- ! | Samuel S. Arentz | | Republican | 1924 | | Incumbent lost re-election. Democratic gain. | nowrap | {{Plainlist|
- James G. Scrugham (Democratic) 60.8%
- Samuel S. Arentz (Republican) 39.2%
|}
New Hampshire
|- ! | William Nathaniel Rogers | | Democratic | 1932 | Incumbent re-elected. | nowrap | {{Plainlist|
- William Nathaniel Rogers (Democratic) 51.3%
- William P. Straw (Republican) 48.6%
- John Zebrowski (Independent) 0.1%
|- ! | Edward Hills Wason | | Republican | 1914 | | Incumbent retired. Republican hold. | nowrap | {{Plainlist|
- Charles W. Tobey (Republican) 52.8%
- Jeremiah J. Doyle (Democratic) 46.8%
- Eli Bourbon (Socialist) 0.3%
- Waino H. Wirkkala (Communist) 0.1%
|}
New Jersey
|- ! | Charles A. Wolverton | | Republican | 1926 | Incumbent re-elected. | nowrap | {{Plainlist|
- Charles A. Wolverton (Republican) 60.2%
- Samuel T. French (Democratic) 36.7%
- Morris Stempa (Socialist) 2.4%
- Charles R. Engel (Prohibition) 0.7%
- Leon A. Ollen (Communist) 0.06%
|- ! | Isaac Bacharach | | Republican | 1914 | Incumbent re-elected. | nowrap | {{Plainlist|
- Isaac Bacharach (Republican) 62.9%
- Harry R. Coulomb (Democratic) 36.4%
- Albert H. Schreiber (Socialist) 0.4%
- Walter L Yerkes (Prohibition) 0.3%
|- ! | William H. Sutphin | | Democratic | 1930 | Incumbent re-elected. | nowrap | {{Plainlist|
- William H. Sutphin (Democratic) 50.9%
- Stanley Washburn (Republican) 48.4%
- Ethel Beck (Socialist) 0.6%
- George R. Carroll (Communist) 0.1%
|- ! | | New district. Republican gain. | nowrap | {{Plainlist|
- D. Lane Powers (Republican) 55.0%
- Monell Sayre (Democratic) 43.2%
- William C. Kauffman (Socialist) 1.5%
- Joseph Wisniewski (Communist) 0.2%
- Russell Y. Page (Personal Choice) 0.008%
|- ! | Charles A. Eaton Redistricted from the | | Republican | 1924 | Incumbent re-elected. | nowrap | {{Plainlist|
- Charles A. Eaton (Republican) 53.2%
- Frederic M. P. Pearse (Democratic) 45.6%
- Bordeaux W. Stokes (Socialist) 1.0%
- Joseph F. Fofrich (Communist) 0.2%
|- ! | Percy Hamilton Stewart Redistricted from the | | Democratic | 1931 | | Retired to run for U.S. senator. Republican gain. | nowrap | {{Plainlist|
- Donald H. McLean (Republican) 57.4%
- Fred C. Hyer (Democratic) 41.9%
- Minnie Zurov Sliptzin (Communist) 0.6%
|- ! | Randolph Perkins Redistricted from the | | Republican | 1920 | Incumbent re-elected. | nowrap | {{Plainlist|
- Randolph Perkins (Republican) 51.6%
- Hamilton Cross (Democratic) 47.3%
- Ferdinand Kadel (Socialist) 0.9%
- James Benjamin McBride Jr. (Communist) 0.1%
- Harold Taft Wright (Independent) 0.07%
- Emil Landgraf (Socialist Labor) 0.05%
|- ! | George N. Seger Redistricted from the | | Republican | 1922 | Incumbent re-elected. | nowrap | {{Plainlist|
- George N. Seger (Republican) 49.2%
- Harry Joelson (Democratic) 48.9%
- Garrett DeYoung (Socialist) 1.5%
- Morris M. Brown (Communist) 0.2%
- John Leahy (Socialist Labor) 0.09%
- William Richard Clark (Prohibition) 0.08%
|- ! | | New seat. Democratic gain. | nowrap | {{Plainlist|
- Edward A. Kenney (Democratic) 47.6%
- Joseph W. Marini (Republican) 46.8%
- Edward J. Ryan (Independent) 4.1%
- Henry J. Cox (Socialist) 1.5%
|- ! | Fred A. Hartley Jr. Redistricted from the | | Republican | 1928 | Incumbent re-elected. | nowrap | {{Plainlist|
- Fred A. Hartley Jr. (Republican) 55.2%
- William W. Harrison (Democratic) 43.4%
- Andrew P. Wittel (Socialist) 1.3%
- Mary Rozanski (Communist) 0.10%
|- ! | Peter Angelo Cavicchia Redistricted from the | | Republican | 1930 | Incumbent re-elected. | nowrap | {{Plainlist|
- Peter Angelo Cavicchia (Republican) 49.8%
- John J. McCloskey (Democratic) 48.8%
- M. Hart Walker (Socialist) 1.2%
- John Kasper (Communist) 0.2%
|- ! | Frederick R. Lehlbach Redistricted from the | | Republican | 1914 | Incumbent re-elected. | nowrap | {{Plainlist|
- Frederick R. Lehlbach (Republican) 56.1%
- Joseph M. Degnan (Democratic) 41.7%
- Louis Reiss (Socialist) 2.0%
- Charles Mitchell (Communist) 0.3%
|- ! | Mary Teresa Norton Redistricted from the | | Democratic | 1924 | Incumbent re-elected. | nowrap | {{Plainlist|
- Mary Teresa Norton (Democratic) 72.1%
- Mortimer Neuman (Republican) 27.3%
- Archibald Craig (Socialist) 0.3%
- Michael G. Pipi (Liberty) 0.1%
- Max Botwinick (Communist) 0.1%
- George Ludwig (Socialist Labor) 0.03%
|- ! | Oscar L. Auf der Heide Redistricted from the | | Democratic | 1924 | Incumbent re-elected. | nowrap | {{Plainlist|
- Oscar L. Auf der Heide (Democratic) 75.1%
- Vincent P. McGann (Republican) 23.7%
- Michael Rappaport (Socialist) 0.7%
- George Driscoll (Independent) 0.2%
- Albert Hoffman (Communist) 0.1%
- Charles Schrafft (Socialist Labor) 0.08%
|}
New Mexico
Main article: 1932 United States House of Representatives election in New Mexico
|- ! | Dennis Chávez | | Democratic | 1930 | Incumbent re-elected. | nowrap | {{Plainlist|
- Dennis Chávez (Democratic) 63.4%
- Jose E. Armijo (Republican) 35.4%
- N. S. Sweeney (Socialist) 0.9%
- L. E. Lake (Liberty) 0.3%
- E. T. Howell (Communist) 0.09%
|}
New York
New York, reapportioned from 43 to 45 seats, left its districts unchanged and elected the two new members at large.
|- ! | Robert L. Bacon | | Republican | 1922 | Incumbent re-elected. | nowrap | {{Plainlist|
- Robert L. Bacon (Republican) 54.0%
- Cornelius V. Whitney (Democratic) 42.9%
- Eric E. DeMarsh (Socialist) 1.6%
- William F. Varney (Law) 1.5%
|- ! | William F. Brunner | | Democratic | 1928 | Incumbent re-elected. | nowrap | {{Plainlist|
- William F. Brunner (Democratic) 68.6%
- Horace A. Demarest (Republican) 27.3%
- James Oneal (Socialist) 4.1%
|- ! | George W. Lindsay | | Democratic | 1922 | Incumbent re-elected. | nowrap | {{Plainlist|
- George W. Lindsay (Democratic) 80.8%
- Edgar H. Hazelwood (Republican) 13.9%
- Joseph A. Weil (Socialist) 4.2%
- Clarence H. Hathaway (Communist) 1.1%
|- ! | Thomas H. Cullen | | Democratic | 1918 | Incumbent re-elected. | nowrap | {{Plainlist|
- Thomas H. Cullen (Democratic) 82.1%
- Conrad P. Printzlien (Republican) 15.4%
- Joseph C. Class (Socialist) 2.0%
- Carl O. Peterson (Communist) 0.5%
|- ! | Loring M. Black Jr. | | Democratic | 1922 | Incumbent re-elected. | nowrap | {{Plainlist|
- Loring M. Black Jr. (Democratic) 64.8%
- Irving C. Maltz (Republican) 30.9%
- Jacob L. Afros (Socialist) 4.3%
|- ! | Andrew Lawrence Somers | | Democratic | 1924 | Incumbent re-elected. | nowrap | {{Plainlist|
- Andrew Lawrence Somers (Democratic) 57.0%
- Joseph P. Byrne (Republican) 29.7%
- Harry W. Laidler (Socialist) 11.0%
- Wolf Schefter (Communist) 1.4%
- Hugo Sesselberg (Civic Securities) 0.9%
|- ! | John J. Delaney | | Democratic | 1931 | Incumbent re-elected. | nowrap | {{Plainlist|
- John J. Delaney (Democratic) 72.5%
- Richard W. Thomas (Republican) 19.5%
- David M. Cory (Socialist) 6.4%
- Emanuel Levin (Communist) 1.6%
|- ! | Patrick J. Carley | | Democratic | 1926 | Incumbent re-elected. | nowrap | {{Plainlist|
- Patrick J. Carley (Democratic) 62.1%
- Daniel Edelman (Republican) 21.8%
- Baruch C. Vladeck (Socialist) 14.1%
- Louis De Santer (Communist) 2.0%
|- ! | Stephen A. Rudd | | Democratic | 1931 | Incumbent re-elected. | nowrap | {{Plainlist|
- Stephen A. Rudd (Democratic) 59.9%
- James Virdone (Republican) 32.7%
- Abraham I. Shiplacoff (Socialist) 6.5%
- Richard B. Sullivan (Communist) 0.9%
|- ! | Emanuel Celler | | Democratic | 1922 | Incumbent re-elected. | nowrap | {{Plainlist|
- Emanuel Celler (Democratic) 63.8%
- William A. Ronalds (Republican) 24.8%
- Louis Sadoff (Socialist) 9.3%
- Harry Friedman (Communist) 2.0%
|- ! | Anning S. Prall | | Democratic | 1923 | Incumbent re-elected. | nowrap | {{Plainlist|
- Anning S. Prall (Democratic) 69.2%
- Frank Homer Fay (Republican) 27.9%
- Walter Dearing (Socialist) 2.8%
|- ! | Samuel Dickstein | | Democratic | 1922 | Incumbent re-elected. | nowrap | {{Plainlist|
- Samuel Dickstein (Democratic) 86.5%
- Henry Steinberg (Republican) 8.4%
- Abraham P. Conan (Socialist) 3.3%
- Richard Follops (Independent) 1.6%
- Lodian Lodian (Independent) 0.2%
|- ! | Christopher D. Sullivan | | Democratic | 1916 | Incumbent re-elected. | nowrap | {{Plainlist|
- Christopher D. Sullivan (Democratic) 86.5%
- John Rosenberg (Republican) 9.9%
- Evelyn W. Hughan (Socialist) 2.7%
- John Steuben (Independent) 0.9%
|- ! | William I. Sirovich | | Democratic | 1926 | Incumbent re-elected. | nowrap | {{Plainlist|
- William I. Sirovich (Democratic) 60.7%
- Henry A. Lowenberg (Republican) 28.3%
- August Claessens (Socialist) 8.0%
- Abraham Markoff (Independent) 3.0%
|- ! | John J. Boylan | | Democratic | 1922 | Incumbent re-elected. | nowrap | {{Plainlist|
- John J. Boylan (Democratic) 80.9%
- Charles Condert Nast (Republican) 16.1%
- William E. Bohn (Socialist) 2.3%
- Harry Raymond (Independent) 0.7%
|- ! | John J. O'Connor | | Democratic | 1923 | Incumbent re-elected. | nowrap | {{Plainlist|
- John J. O'Connor (Democratic) 67.1%
- Eugene S. Taliaferro (Republican) 28.3%
- Bertha Mailly (Socialist) 3.5%
- Carl Hacker (Independent) 1.1%
|- ! | Ruth Baker Pratt | | Republican | 1928 | | Incumbent lost re-election. Democratic gain. | nowrap | {{Plainlist|
- Theodore A. Peyser (Democratic) 52.9%
- Ruth Baker Pratt (Republican) 43.3%
- Alexander Kahn (Socialist) 3.0%
- George Hiram Mann (Independent) 0.8%
|- ! | Martin J. Kennedy | | Democratic | 1930 | Incumbent re-elected. | nowrap | {{Plainlist|
- Martin J. Kennedy (Democratic) 75.1%
- Patrick S. Hickey (Republican) 19.9%
- Emerich Steinberger (Socialist) 3.9%
- Pauline Rogers (Independent) 1.1%
|- ! | Sol Bloom | | Democratic | 1923 | Incumbent re-elected. | nowrap | {{Plainlist|
- Sol Bloom (Democratic) 69.0%
- William L. Carns (Republican) 26.2%
- Reinhold Niebuhr (Socialist) 4.3%
- Mary L. H. Brooks (Independent) 0.5%
|- ! | Fiorello La Guardia | | Republican | 1922 | | Incumbent lost re-election. Democratic gain. | nowrap | {{Plainlist|
- James J. Lanzetta (Democratic) 50.7%
- Fiorello La Guardia (Republican) 47.0%
- Frank Poree (Socialist) 1.4%
- Earl Browder (Independent) 1.0%
|- ! | Joseph A. Gavagan | | Democratic | 1929 | Incumbent re-elected. | nowrap | {{Plainlist|
- Joseph A. Gavagan (Democratic) 64.6%
- Oscar J. Smith (Republican) 27.7%
- Frank Crosswaith (Socialist) 7.1%
- Elinor C. Henderson (Independent) 0.7%
|- ! | Anthony J. Griffin | | Democratic | 1918 | Incumbent re-elected. | nowrap | {{Plainlist|
- Anthony J. Griffin (Democratic) 76.7%
- Wilbur J. Murphy (Republican) 17.6%
- Tyrell Wilson (Socialist) 4.5%
- Helen Gerson (Independent) 1.3%
|- ! | Frank Oliver | | Democratic | 1922 | Incumbent re-elected. | nowrap | {{Plainlist|
- Frank Oliver (Democratic) 69.5%
- Samuel J. Krinn (Republican) 16.7%
- Samuel Orr (Socialist) 11.3%
- Carl Prodsky (Independent) 2.5%
|- ! | James M. Fitzpatrick | | Democratic | 1926 | Incumbent re-elected. | nowrap | {{Plainlist|
- James M. Fitzpatrick (Democratic) 60.1%
- Benjamin L. Fairchild (Republican) 30.4%
- Esther Friedman (Socialist) 7.2%
- Moissaye J. Olgin (Communist) 2.2%
- Alexander Wascin (Jeffersonian) 0.2%
|- ! | Charles D. Millard | | Republican | 1930 | Incumbent re-elected. | nowrap | {{Plainlist|
- Charles D. Millard (Republican) 54.3%
- Jesse B. Perlman (Democratic) 42.5%
- Carl O. Parsons (Socialist) 1.7%
- David E. Hartshorn (Law) 1.6%
|- ! | Hamilton Fish Jr. | | Republican | 1920 | Incumbent re-elected. | nowrap | {{Plainlist|
- Hamilton Fish Jr. (Republican) 58.3%
- Roslyn M. Cox (Democratic) 40.8%
- Albert W. Brower (Socialist) 0.8%
|- ! | Harcourt J. Pratt | | Republican | 1924 | | Incumbent retired. Republican hold. | nowrap | {{Plainlist|
- Philip A. Goodwin (Republican) 52.5%
- Clifford L. Miller (Democratic) 46.5%
- Milo C. Myers (Socialist) 0.9%
|- ! | Parker Corning | | Democratic | 1922 | Incumbent re-elected. | nowrap | {{Plainlist|
- Parker Corning (Democratic) 64.7%
- Isaac G. Braman (Republican) 34.7%
- Allin Depew (Socialist) 0.6%
|- ! | James S. Parker | | Republican | 1912 | Incumbent re-elected. | nowrap | {{Plainlist|
- James S. Parker (Republican) 57.8%
- John J. Nyhoff (Democratic) 41.5%
- Coleman B. Cheney (Socialist) 0.7%
|- ! | Frank Crowther | | Republican | 1918 | Incumbent re-elected. | nowrap | {{Plainlist|
- Frank Crowther (Republican) 55.5%
- George D. Lambertson (Democratic) 42.3%
- Herbert M. Merrill (Socialist) 2.2%
|- ! | Bertrand Snell | | Republican | 1915 | Incumbent re-elected. | nowrap | {{Plainlist|
- Bertrand Snell (Republican) 57.5%
- Kenneth Gardner (Democratic) 42.1%
- George E. Brassard (Socialist) 0.4%
|- ! | Francis D. Culkin | | Republican | 1928 | Incumbent re-elected. | nowrap | {{Plainlist|
- Francis D. Culkin (Republican) 61.8%
- John C. Purcell (Democratic) 37.3%
- James A. Manson (Socialist) 0.8%
|- ! | Frederick M. Davenport | | Republican | 1924 | | Incumbent lost re-election. Democratic gain. | nowrap | {{Plainlist|
- Fred Sisson (Democratic) 50.0%
- Frederick M. Davenport (Republican) 49.0%
- Otto L. Endres (Socialist) 1.0%
|- ! | John D. Clarke | | Republican | 1926 | Incumbent re-elected. | nowrap | {{Plainlist|
- John D. Clarke (Republican) 53.2%
- Charles R. Seymour (Democratic) 40.0%
- Leon Ray Steenburg (Law) 6.1%
- Pierre De Nie (Socialist) 0.7%
|- ! | Clarence E. Hancock | | Republican | 1927 | Incumbent re-elected. | nowrap | {{Plainlist|
- Clarence E. Hancock (Republican) 55.6%
- Edmund L. Weston (Democratic) 42.3%
- Walter B. McNinch (Socialist) 2.1%
|- ! | John Taber | | Republican | 1922 | Incumbent re-elected. | nowrap | {{Plainlist|
- John Taber (Republican) 60.9%
- Lithgow Osborne (Democratic) 38.2%
- Esther Wright (Socialist) 0.9%
|- ! | Gale H. Stalker | | Republican | 1922 | Incumbent re-elected. | nowrap | {{Plainlist|
- Gale H. Stalker (Republican) 52.4%
- Julian P. Bretz (Democratic) 45.6%
- Edward Amherst Ott (Socialist) 1.3%
- John D. Driscoll (Liberal) 0.7%
|- ! | James L. Whitley | | Republican | 1928 | Incumbent re-elected. | nowrap | {{Plainlist|
- James L. Whitley (Republican) 46.2%
- Charles Stanton (Democratic) 42.4%
- Arthur Rathjen (Law) 8.7%
- Richard M. Briggs (Socialist) 2.6%
|- ! | Archie D. Sanders | | Republican | 1916 | | Incumbent retired. Republican hold. | nowrap | {{Plainlist|
- James W. Wadsworth Jr. (Republican) 47.1%
- David A. White (Democratic) 32.8%
- Ernest R. Clark (Law) 18.7%
- Martin T. Cook (Socialist) 1.4%
|- ! | Walter G. Andrews | | Republican | 1930 | Incumbent re-elected. | nowrap | {{Plainlist|
- Walter G. Andrews (Republican) 61.7%
- Ralph W. Nolan (Democratic) 36.1%
- Herman J. Hahn (Independent) 2.1%
|- ! | Edmund F. Cooke | | Republican | 1928 | | Incumbent lost re-election. Democratic gain. | nowrap | {{Plainlist|
- Alfred F. Beiter (Democratic) 50.1%
- Edmund F. Cooke (Republican) 47.4%
- Robert A. Hoffman (Socialist) 2.5%
|- ! | James M. Mead | | Democratic | 1918 | Incumbent re-elected. | nowrap | {{Plainlist|
- James M. Mead (Democratic) 62.0%
- Henry Adsit Bull (Republican) 36.4%
- Marklet H. Harding (Socialist) 1.7%
|- ! | Daniel A. Reed | | Republican | 1918 | Incumbent re-elected. | nowrap | {{Plainlist|
- Daniel A. Reed (Republican) 60.0%
- Gerald A. Herrick (Democratic) 37.1%
- John C. Cooper (Socialist) 2.9%
|- ! rowspan=2 | (2 seats) | | New seat. Democratic gain.
- Elmer E. Studley (Democratic) 27.2%
- John Fitzgibbons (Democratic) 26.9%
- Nicholas Howard Pinto (Republican) 20.2%
- Sherman J. Lowell (Republican) 20.0%
- G. August Gerber (Socialist) 1.9%
- Fred Sander (Socialist) 1.9%
- Elizabeth Smart (Law) 0.9%
- J. Elmer Cates (Law) 0.8%
- Jacob Berlin (Socialist Labor) 0.1%
- O. Martin Olson (Socialist Labor) 0.1%
|- | | New seat. Democratic gain.
|}
North Carolina
|- ! | Lindsay C. Warren | | Democratic | 1924 | Incumbent re-elected. | nowrap | {{Plainlist|
- Lindsay C. Warren (Democratic) 90.8%
- John B. Respess (Republican) 9.2%
|- ! | John H. Kerr | | Democratic | 1923 | Incumbent re-elected. | nowrap | {{Plainlist|
- John H. Kerr (Democratic) 96.0%
- B. B. Howell (Republican) 4.0%
|- ! | Charles L. Abernethy | | Democratic | 1922 | Incumbent re-elected. | nowrap | {{Plainlist|
- Charles L. Abernethy (Democratic) 73.2%
- H. B. Ivey (Republican) 26.8%
|- ! | Edward W. Pou | | Democratic | 1900 | Incumbent re-elected. | nowrap | {{Plainlist|
- Edward W. Pou (Democratic) 76.0%
- L. P. Dixon (Republican) 24.0%
|- ! | Franklin Wills Hancock Jr. | | Democratic | 1930 | Incumbent re-elected. | nowrap | {{Plainlist|
- Franklin Wills Hancock Jr. (Democratic) 70.2%
- L. L. Wall (Republican) 29.8%
|- ! | | New seat. Democratic gain. | nowrap | {{Plainlist|
- William B. Umstead (Democratic) 67.8%
- William I. Ward (Republican) 32.2%
|- ! | J. Bayard Clark Redistricted from the | | Democratic | 1928 | Incumbent re-elected. | nowrap | {{Plainlist|
- J. Bayard Clark (Democratic) 80.4%
- J. M. Byrd (Republican) 19.6%
|- ! | Walter Lambeth Redistricted from the | | Democratic | 1930 | Incumbent re-elected. | nowrap | {{Plainlist|
- Walter Lambeth (Democratic) 65.4%
- A. H. Ragan (Republican) 34.6%
|- ! | Robert L. Doughton Redistricted from the | | Democratic | 1910 | Incumbent re-elected. | nowrap | {{Plainlist|
- Robert L. Doughton (Democratic) 63.5%
- P. P. Dulin (Republican) 36.5%
|- ! | Alfred L. Bulwinkle Redistricted from the | | Democratic | 1930 | Incumbent re-elected. | nowrap | {{Plainlist|
- Alfred L. Bulwinkle (Democratic) 59.7%
- Charles A. Jonas (Republican) 40.3%
|- ! | Zebulon Weaver Redistricted from the | | Democratic | 1930 | Incumbent re-elected. | nowrap | {{Plainlist|
- Zebulon Weaver (Democratic) 62.3%
- Crawford F. James (Republican) 37.7%
|}
North Dakota
North Dakota was reapportioned from 3 seats to 2, and elected them at large.
|- ! rowspan=3 | (2 seats) | James H. Sinclair Redistricted from the | | Republican | 1918 | Incumbent re-elected.
- James H. Sinclair (Republican) 33.9%
- William Lemke (Republican-NPL) 31.8%
- W. D. Lynch (Democratic) 17.1%
- R. B. Murphy (Democratic) 16.9%
- Pat J. Barrett (Independent) 0.2%
- Ella Reeve Bloor (Independent) 0.2%
|- | Olger B. Burtness Redistricted from the | | Republican | 1920 | | Incumbent lost renomination. Republican hold.
|- | Thomas Hall Redistricted from the | | Republican | 1922 | | Incumbent lost renomination. Republican loss.
|}
Ohio
|- ! | John B. Hollister | | Republican | 1931 | Incumbent re-elected. | nowrap | {{Plainlist|
- John B. Hollister (Republican) 54.4%
- Edward H. Brink (Democratic) 45.6%
|- ! | William E. Hess | | Republican | 1928 | Incumbent re-elected. | nowrap | {{Plainlist|
- William E. Hess (Republican) 50.7%
- Edward F. Alexander (Democratic) 49.3%
|- ! | Byron B. Harlan | | Democratic | 1930 | Incumbent re-elected. | nowrap | {{Plainlist|
- Byron B. Harlan (Democratic) 54.8%
- Edith McClure Patterson (Republican) 42.6%
- Jere F. Mincher (Socialist) 2.7%
|- ! | John L. Cable | | Republican | 1928 | | Incumbent lost re-election. Democratic gain. | nowrap | {{Plainlist|
- Frank L. Kloeb (Democratic) 54.6%
- John L. Cable (Republican) 45.4%
|- ! | Frank C. Kniffin | | Democratic | 1930 | Incumbent re-elected. | nowrap | {{Plainlist|
- Frank C. Kniffin (Democratic) 60.0%
- William L. Manahan (Republican) 40.0%
|- ! | James G. Polk | | Democratic | 1930 | Incumbent re-elected. | nowrap | {{Plainlist|
- James G. Polk (Democratic) 56.2%
- Mack Sauer (Republican) 43.8%
|- ! | Charles Brand | | Republican | 1922 | | Incumbent retired. Republican hold. | nowrap | {{Plainlist|
- Leroy T. Marshall (Republican) 53.0%
- Aaron J. Halloran (Democratic) 47.0%
|- ! | Grant E. Mouser | | Republican | 1928 | | Incumbent lost re-election. Democratic gain. | nowrap | {{Plainlist|
- Thomas B. Fletcher (Democratic) 52.7%
- Grant E. Mouser (Republican) 47.3%
|- ! | Wilbur M. White | | Republican | 1930 | | Incumbent lost re-election. Democratic gain. | nowrap | {{Plainlist|
- Warren J. Duffey (Democratic) 47.7%
- Wilbur M. White (Republican) 45.4%
- Silas E. Hurin (Independent) 3.5%
- Clyde E. Kiker (Independent) 1.8%
- Karl Pauli (Socialist) 1.1%
- Eugene Stoll (Communist) 0.5%
|- ! | Thomas A. Jenkins | | Republican | 1924 | Incumbent re-elected. | nowrap | {{Plainlist|
- Thomas A. Jenkins (Republican) 58.9%
- Charles M. Hogan (Democratic) 41.1%
|- ! | Mell G. Underwood | | Democratic | 1922 | Incumbent re-elected. | nowrap | {{Plainlist|
- Mell G. Underwood (Democratic) 63.0%
- David J. Lewis (Republican) 37.0%
|- ! | Arthur P. Lamneck | | Democratic | 1930 | Incumbent re-elected. | nowrap | {{Plainlist|
- Arthur P. Lamneck (Democratic) 50.2%
- John C. Speaks (Republican) 49.8%
|- ! | William L. Fiesinger | | Democratic | 1930 | Incumbent re-elected. | nowrap | {{Plainlist|
- William L. Fiesinger (Democratic) 58.9%
- Walter E. Kruger (Republican) 41.1%
|- ! | Francis Seiberling | | Republican | 1928 | | Incumbent lost re-election. Democratic gain. | nowrap | {{Plainlist|
- Dow W. Harter (Democratic) 53.9%
- Francis Seiberling (Republican) 45.7%
- I. B. Hinman (Communist) 0.4%
|- ! | C. Ellis Moore | | Republican | 1918 | | Incumbent lost re-election. Democratic gain. | nowrap | {{Plainlist|
- Robert T. Secrest (Democratic) 56.6%
- C. Ellis Moore (Republican) 42.9%
- Joseph H. Ewing (Independent) 0.5%
|- ! | Charles B. McClintock | | Republican | 1928 | | Incumbent lost re-election. Democratic gain. | nowrap | {{Plainlist|
- William R. Thom (Democratic) 51.5%
- Charles B. McClintock (Republican) 48.5%
|- ! | Charles West | | Democratic | 1930 | Incumbent re-elected. | nowrap | {{Plainlist|
- Charles West (Democratic) 51.7%
- William M. Morgan (Republican) 48.3%
|- ! | B. Frank Murphy | | Republican | 1918 | | Incumbent lost re-election. Democratic gain. | nowrap | {{Plainlist|
- Lawrence E. Imhoff (Democratic) 50.2%
- B. Frank Murphy (Republican) 49.8%
|- ! | John G. Cooper | | Republican | 1914 | Incumbent re-elected. | nowrap | {{Plainlist|
- John G. Cooper (Republican) 53.3%
- D. F. Dunlavy (Democratic) 46.5%
- John S. Ruth (Independent) 0.1%
- Harold G. Bickler (Independent) 0.03%
|- ! | Martin L. Sweeney | | Democratic | 1931 | Incumbent re-elected. | nowrap | {{Plainlist|
- Martin L. Sweeney (Democratic) 98.8%
- John Fromholz (Communist) 1.2%
|- ! | Robert Crosser | | Democratic | 1922 | Incumbent re-elected. | nowrap | {{Plainlist|
- Robert Crosser (Democratic) 65.2%
- Gerald Pilliod (Republican) 33.7%
- Joseph Schiffer (Communist) 0.9%
- Eugene F. Cheeks (Independent) 0.3%
|- ! | Chester C. Bolton | | Republican | 1928 | Incumbent re-elected. | nowrap | {{Plainlist|
- Chester C. Bolton (Republican) 58.7%
- Florence E. Allen (Democratic) 40.9%
- G. Racheff (Communist) 0.3%
- Joe T. Thomas (Independent) 0.2%
|- ! | | New seat. Democratic gain.
- Charles V. Truax (Democratic) 25.8%
- Stephen M. Young (Democratic) 25.7%
- George H. Bender (Republican) 23.7%
- L. T. Palmer (Republican) 23.6%
- Edward R. Stafford (Prohibition) 0.5%
- Alfred H. Stratton (Prohibition) 0.4%
- John Rehms (Communist) 0.2%
- William Hughey (Communist) 0.1%
|- ! | | New seat. Democratic gain.
|}
Oklahoma
|- ! | Wesley E. Disney | | Democratic | 1930 | Incumbent re-elected. | nowrap | {{Plainlist|
- Wesley E. Disney (Democratic) 63.3%
- Frank Frantz (Republican) 36.3%
- A. F. Sweeney (Independent) 0.5%
|- ! | William W. Hastings | | Democratic | 1922 | Incumbent re-elected. | nowrap | {{Plainlist|
- William W. Hastings (Democratic) 70.5%
- William F. Head (Republican) 29.5%
|- ! | Wilburn Cartwright | | Democratic | 1926 | Incumbent re-elected. | nowrap | {{Plainlist|
- Wilburn Cartwright (Democratic) 85.2%
- Walter Colbert (Republican) 14.8%
|- ! | Tom D. McKeown | | Democratic | 1922 | Incumbent re-elected. | nowrap | {{Plainlist|
- Tom D. McKeown (Democratic) 75.5%
- E. W. Kemp (Republican) 24.5%
|- ! | Fletcher B. Swank | | Democratic | 1930 | Incumbent re-elected. | nowrap | {{Plainlist|
- Fletcher B. Swank (Democratic) 64.2%
- Paul Huston (Republican) 35.8%
|- ! | Jed Johnson | | Democratic | 1926 | Incumbent re-elected. | nowrap | {{Plainlist|
- Jed Johnson (Democratic) 79.3%
- George E. Young (Republican) 20.7%
|- ! | James V. McClintic | | Democratic | 1914 | Incumbent re-elected. | nowrap | {{Plainlist|
- James V. McClintic (Democratic) 77.9%
- W. G. Roe (Republican) 15.6%
- T. H. McLemore (Independent) 6.5%
|- ! | Milton C. Garber | | Republican | 1922 | | Incumbent lost re-election. Democratic gain. | nowrap | {{Plainlist|
- E. W. Marland (Democratic) 61.3%
- Milton C. Garber (Republican) 37.8%
- W. E. Knapp (Independent) 0.8%
- Alfred Reynolds (Independent) 0.2%
|- ! | | New seat. Democratic gain. | nowrap | {{Plainlist|
- Will Rogers (Democratic) 72.8%
- R. A. Howard (Republican) 26.7%
- George E. Taylor (Independent) 0.3%
- R. J. Shive (Independent) 0.2%
|}
Oregon
|- ! | Willis C. Hawley | | Republican | 1906 | | Incumbent lost renomination. Republican hold. | nowrap | {{Plainlist|
- James W. Mott (Republican) 51.2%
- Harvey G. Starkweather (Democratic) 37.3%
- W. J. Butler (Independent) 7.7%
- Lee Giddings (Socialist) 2.6%
- Upton A. Upton (Socialist Labor) 1.1%
|- ! | Robert R. Butler | | Republican | 1928 | | Incumbent lost re-election. Democratic gain. | nowrap | {{Plainlist|
- Walter M. Pierce (Democratic) 48.2%
- Robert R. Butler (Republican) 40.1%
- Hugh E. Brady (Independent) 8.2%
- O. D. Teel (Socialist) 2.0%
- Paul F. Schnur (Socialist Labor) 1.5%
|- ! | Charles H. Martin | | Democratic | 1930 | Incumbent re-elected. | nowrap | {{Plainlist|
- Charles H. Martin (Democratic) 59.0%
- Homer D. Angell (Republican) 32.2%
- Albert Streiff (Socialist) 4.0%
- H. H. Stallard (Independent) 2.9%
- Carl V. Soderback (Socialist Labor) 1.0%
- Richard L. Lovelace (Communist) 0.9%
|}
Pennsylvania
|- ! | Harry C. Ransley Redistricted from the | | Republican | 1920 | Incumbent re-elected. | nowrap | {{Plainlist|
- Harry C. Ransley (Republican) 91.5%
- Harry T. Glenn (Fair Play) 6.9%
- G. Kutikoff (Socialist) 1.1%
- C. Litta (Communist) 0.5%
|- ! | James M. Beck Redistricted from the | | Republican | 1927 | Incumbent re-elected. | nowrap | {{Plainlist|
- James M. Beck (Republican) 59.2%
- John J. Shanahan (Democratic) 38.7%
- Andrew J. Biemiller (Socialist) 1.6%
- David Davis (Communist) 0.5%
|- ! | Robert Lee Davis Redistricted from the | | Republican | 1932 | | Incumbent retired. Republican hold. | nowrap | {{Plainlist|
- Alfred M. Waldron (Republican) 57.4%
- Frank M. O'Brien (Democratic) 40.6%
- Joseph Kazmark (Socialist) 1.6%
- Thomas Nabried (Communist) 0.3%
|- ! | Benjamin M. Golder | | Republican | 1924 | | Incumbent lost renomination. Republican hold. | nowrap | {{Plainlist|
- George W. Edmonds (Republican) 52.9%
- William J. O'Rourke (Democratic) 44.4%
- Joseph Schwartz (Socialist) 2.1%
- Morris H. Powers (Communist) 0.6%
|- ! | James J. Connolly | | Republican | 1920 | Incumbent re-elected. | nowrap | {{Plainlist|
- James J. Connolly (Republican) 55.4%
- Carroll J. Agnew (Democratic) 40.5%
- Franz E. Daniel (Socialist) 3.8%
- Ernest Kornfeld (Communist) 0.3%
|- ! | Edward L. Stokes Redistricted from the | | Republican | 1931 | Incumbent re-elected. | nowrap | {{Plainlist|
- Edward L. Stokes (Republican) 51.0%
- Harry V. Dougherty (Democratic) 46.0%
- M. H. Goldstein (Socialist) 2.3%
- Charles C. Hopkins (Prohibition) 0.8%
|- ! | George P. Darrow | | Republican | 1914 | Incumbent re-elected. | nowrap | {{Plainlist|
- George P. Darrow (Republican) 62.2%
- James C. Crumlish (Democratic) 35.2%
- David H. H. Felix (Socialist) 2.6%
- Thomas F. Lester (Liberal) 0.06%
|- ! | James Wolfenden | | Republican | 1928 | Incumbent re-elected. | nowrap | {{Plainlist|
- James Wolfenden (Republican) 65.8%
- Matthew Randall (Democratic) 30.1%
- Jesse Holmes (Socialist) 2.7%
- C. Wilfred Conard (Prohibition) 1.4%
|- ! rowspan=2 | | Henry Winfield Watson | | Republican | 1914 | Incumbent re-elected.
- Henry Winfield Watson (Republican) 50.3%
- Norton Lichtenwalner (Democratic) 46.3%
- Walter L. Huhn (Socialist) 3.5%
|- | Norton Lichtenwalner Redistricted from the . | | Democratic | 1930 | | Incumbent lost re-election. Democratic loss. |- ! | J. Roland Kinzer | | Republican | 1930 | Incumbent re-elected. | nowrap | {{Plainlist|
- J. Roland Kinzer (Republican) 61.5%
- Richard P. McGrann (Democratic) 36.2%
- Frank Scott Jr. (Socialist) 2.3%
|- ! | Patrick J. Boland | | Democratic | 1930 | Incumbent re-elected. | nowrap | {{Plainlist|
- Patrick J. Boland (Democratic) 95.9%
- George Hart (Prohibition) 4.1%
|- ! | C. Murray Turpin | | Republican | 1929 | Incumbent re-elected. | nowrap | {{Plainlist|
- C. Murray Turpin (Republican) 50.8%
- John J. Casey (Democratic) 49.2%
|- ! rowspan=2 | | George F. Brumm | | Republican | 1928 | Incumbent re-elected.
- George F. Brumm (Republican) 90.9%
- Frederick W. Magrady (Prohibition) 4.7%
- Anthony Malinowski (Socialist) 4.1%
- Peter Schwartz (Communist) 0.3%
|- | Frederick W. Magrady Redistricted from the | | Republican | 1924 | | Incumbent lost renomination, ran and lost on Prohibition Party ticket. Republican loss. |- ! | | New seat. Democratic hold. | nowrap | {{Plainlist|
- William E. Richardson (Democratic) 41.0%
- Thomas L. Rhoads (Republican) 31.9%
- Raymond S. Hofses (Socialist) 26.9%
- George W. Brownback (Independent) 0.1%
- Florence Cassel (Liberal) 0.001%
|- ! | Louis T. McFadden | | Republican | 1914 | Incumbent re-elected. | nowrap | {{Plainlist|
- Louis T. McFadden (Republican) 96.0%
- Henry L. Springer (Socialist) 4.0%
|- ! | Robert F. Rich | | Republican | 1930 | Incumbent re-elected. | nowrap | {{Plainlist|
- Robert F. Rich (Republican) 63.6%
- Paul A. Rothfuss (Democratic) 34.1%
- W. A. Hall (Socialist) 2.4%
|- ! | | New seat. Republican gain. | nowrap | {{Plainlist|
- J. William Ditter (Republican) 59.9%
- Philip Childs Pendleton (Democratic) 32.8%
- Mary Winsor (Socialist) 2.9%
- S. Earle Hoover (Prohibition) 2.4%
- Francis R. Taylor (Prohibition) 2.0%
|- ! | Edward M. Beers | | Republican | 1922 | | Incumbent died. Republican hold. Winner was not elected to finish the current term. | nowrap | {{Plainlist|
- Benjamin K. Focht (Republican) 48.3%
- Harry Rippman (Democratic) 32.3%
- Omer B. Poulson (Citizens) 19.4%
|- ! | Isaac H. Doutrich | | Republican | 1926 | Incumbent re-elected. | nowrap | {{Plainlist|
- Isaac H. Doutrich (Republican) 58.1%
- Carl K. Deen (Democratic) 37.1%
- Samuel Young (Socialist) 2.5%
- B. E. P. Prugh (Prohibition) 2.3%
|- ! | Thomas Cunningham Cochran Redistricted from the | | Republican | 1926 | Incumbent re-elected. | nowrap | {{Plainlist|
- Thomas Cunningham Cochran (Republican) 53.6%
- D. J. Driscoll (Democratic) 46.4%
|- ! | William R. Coyle Redistricted from the | | Republican | 1928 | | Incumbent lost re-election. Democratic gain. | nowrap | {{Plainlist|
- Francis E. Walter (Democratic) 52.7%
- William R. Coyle (Republican) 45.1%
- Simon R. Hartzell (Socialist) 2.2%
|- ! | Harry L. Haines | | Democratic | 1930 | Incumbent re-elected. | nowrap | {{Plainlist|
- Harry L. Haines (Democratic) 58.3%
- Leighton C. Taylor (Republican) 40.3%
- Percy K. Coover (Socialist) 1.4%
|- ! rowspan=2 | | J. Mitchell Chase | | Republican | 1926 | | Incumbent lost renomination. Republican loss.
- J. Banks Kurtz (Republican) 49.2%
- Frederick B. Kerr (Democratic) 47.2%
- Charles D. Rockel (Socialist) 3.6%
|- | J. Banks Kurtz Redistricted from the | | Republican | 1922 | Incumbent re-elected.
|- ! | Samuel A. Kendall | | Republican | 1918 | | Incumbent lost re-election. Democratic gain. | nowrap | {{Plainlist|
- J. Buell Snyder (Democratic) 53.4%
- Samuel A. Kendall (Republican) 44.7%
- David Rinne (Socialist) 1.8%
|- ! | Henry W. Temple | | Republican | 1912 | | Incumbent lost re-election. Democratic gain. | nowrap | {{Plainlist|
- Charles I. Faddis (Democratic) 56.1%
- Henry W. Temple (Republican) 41.7%
- Frank A. Silvis (Socialist) 2.2%
|- ! | J. Howard Swick | | Republican | 1926 | Incumbent re-elected. | nowrap | {{Plainlist|
- J. Howard Swick (Republican) 54.0%
- Sam B. Wilson (Democratic) 46.0%
|- ! rowspan=2 | | Nathan L. Strong | | Republican | 1916 | Incumbent re-elected.
- Nathan L. Strong (Republican) 50.7%
- D. A. Dorn (Democratic) 41.0%
- Robert McEldowney (Liberal) 4.6%
- William C. Widdowson (Socialist) 2.5%
- Donald J. Perry (Jobless) 0.8%
- Alexander S. Ryesky (Communist) 0.4%
|- | Howard W. Stull Redistricted from the | | Republican | 1932 | | Incumbent lost renomination. Republican loss.
|- ! | Adam Wyant Redistricted from the | | Republican | 1920 | | Incumbent lost re-election. Democratic gain. | nowrap | {{Plainlist|
- William M. Berlin (Democratic) 55.2%
- Adam Wyant (Republican) 40.8%
- A. W. Zornick (Socialist) 4.0%
|- ! | Milton W. Shreve | | Republican | 1918 | | Incumbent lost re-election. Democratic gain. | nowrap | {{Plainlist|
- Charles N. Crosby (Democratic) 50.1%
- Milton W. Shreve (Republican) 46.6%
- F. Lindy (Socialist) 3.1%
- Leo Mittelmeier (Communist) 0.2%
|- ! | Edmund F. Erk Redistricted from the | | Republican | 1930 | | Incumbent lost re-election. Democratic gain. | nowrap | {{Plainlist|
- J. Twing Brooks (Democratic) 47.2%
- Edmund F. Erk (Republican) 47.0%
- Sarah Z. Limbach (Socialist) 3.4%
- Robert Hervey (Prohibition) 1.6%
- Edwin A. Glenn (Peoples) 0.8%
|- ! | M. Clyde Kelly Redistricted from the | | Republican | 1916 | Incumbent re-elected. | nowrap | {{Plainlist|
- M. Clyde Kelly (Republican) 85.5%
- Leo O. Guthrie (Repeal Volstead) 7.5%
- William B. Kane (Socialist) 7.0%
|- ! | Patrick J. Sullivan Redistricted from the | | Republican | 1928 | | Incumbent lost renomination. Republican hold. | nowrap | {{Plainlist|
- Michael J. Muldowney (Republican) 53.3%
- Anne E. Felix (Democratic) 40.9%
- Max Lutsky (Socialist) 2.2%
- John W. Grubbs (Prohibition) 1.8%
- Patrick J. Sullivan (Independent) 1.5%
- Max Jenkins (Communist) 0.4%
|- ! | Harry A. Estep Redistricted from the | | Republican | 1926 | | Incumbent lost re-election. Democratic gain. | nowrap | {{Plainlist|
- Henry Ellenbogen (Democratic) 52.0%
- Harry A. Estep (Republican) 43.9%
- Samuel Oshry (Socialist) 2.4%
- George Harger (Prohibition) 1.5%
- Carl Price (Communist) 0.2%
|- ! | Guy E. Campbell Redistricted from the | | Republican | 1916 | | Incumbent lost re-election. Democratic gain. | nowrap | {{Plainlist|
- Matthew A. Dunn (Democratic) 49.9%
- Guy E. Campbell (Republican) 44.3%
- Mary B. Lehner (Socialist) 3.9%
- Thomas M. Heard (Prohibition) 1.9%
|}
Puerto Rico
See Non-voting delegates, below.
Rhode Island
|- ! rowspan=2 | | Clark Burdick | | Republican | 1918 | | Incumbent lost re-election. Republican loss.
- Francis Condon (Democratic) 55.6%
- Clark Burdick (Republican) 44.2%
- Sara M. Algeo (Independent Dry) 0.2%
|- | Francis Condon Redistricted from the | | Democratic | 1930 | Incumbent re-elected.
|- ! | Richard S. Aldrich | | Republican | 1922 | | Incumbent retired. Democratic gain. | nowrap | {{Plainlist|
- John M. O'Connell (Democratic) 54.8%
- Thomas P. Hazard (Republican) 45.0%
- Alfred W. Pett (Prohibition) 0.2%
|}
South Carolina
Main article: 1932 United States House of Representatives elections in South Carolina
|- ! | Thomas S. McMillan | | Democratic | 1924 | Incumbent re-elected. | nowrap | {{Plainlist|
- Thomas S. McMillan (Democratic) 95.9%
- D. C. Sharpe (Republican) 4.1%
|- ! | Hampton P. Fulmer Redistricted from the | | Democratic | 1920 | Incumbent re-elected. | nowrap | {{Plainlist|
- Hampton P. Fulmer (Democratic) 97.9%
- D. A. Gardner (Republican) 2.1%
|- ! | Frederick H. Dominick | | Democratic | 1916 | | Incumbent lost renomination. Democratic hold. | nowrap | {{Plainlist|
- John C. Taylor (Democratic) 99.2%
- T. Frank McCord (Republican) 0.8%
|- ! | John J. McSwain | | Democratic | 1920 | Incumbent re-elected. | nowrap | {{Plainlist|
- John J. McSwain (Democratic) 98.4%
- Otho Williams (Republican) 1.6%
|- ! | William Francis Stevenson | | Democratic | 1917 | | Incumbent lost renomination. Democratic hold. | nowrap | {{Plainlist|
- James P. Richards (Democratic) 98.5%
- G. M. Williams (Republican) 1.5%
|- ! | Allard H. Gasque | | Democratic | 1922 | Incumbent re-elected. | nowrap | {{Plainlist|
- Allard H. Gasque (Democratic) 98.6%
- C. B. Ruffin (Republican) 1.4%
|}
South Dakota
|- ! | Charles A. Christopherson | | Republican | 1918 | | Incumbent lost re-election. Democratic gain. | nowrap | {{Plainlist|
- Fred H. Hildebrandt (Democratic) 53.1%
- Charles A. Christopherson (Republican) 44.4%
- Paul L. Werth (Liberty) 1.6%
- Lydia B. Johnson (Independent) 0.7%
- Roy Miller (Independent) 0.1%
|- ! rowspan=2 | | Royal C. Johnson | | Republican | 1914 | | Incumbent retired. Republican loss.
- Theodore B. Werner (Democratic) 55.7%
- William Williamson (Republican) 43.9%
- Arne Jaskela (Independent) 0.4%
|- | William Williamson Redistricted from the | | Republican | 1920 | | Incumbent lost re-election. Democratic gain.
|}
Tennessee
|- ! | Oscar Lovette | | Republican | 1930 | | Incumbent lost renomination and re-election as an Independent. Republican hold. | nowrap | {{Plainlist|
- B. Carroll Reece (Republican) 45.8%
- Oscar Lovette (Independent) 42.1%
- Albert C. Tipton (Democratic) 12.0%
- Jess Smith (Independent) 0.1%
- A. Isenberg (Independent) 0.03%
|- ! | J. Will Taylor | | Republican | 1918 | Incumbent re-elected. | nowrap | {{Plainlist|
- J. Will Taylor (Republican) 57.7%
- H. S. Burnett (Democratic) 40.5%
- T. J. Rowland (Independent) 1.4%
- Jeff Johnson (Independent) 0.4%
|- ! | Sam D. McReynolds | | Democratic | 1922 | Incumbent re-elected. | nowrap | {{Plainlist|
- Sam D. McReynolds (Democratic) 91.6%
- William N. Levan (Republican) 4.0%
- Fred Starr (Independent) 3.3%
- T. J. Rowland (Independent) 1.0%
|- ! | John Ridley Mitchell | | Democratic | 1930 | Incumbent re-elected. | nowrap | {{Plainlist|
- John Ridley Mitchell (Democratic) 82.6%
- W. H. Crowell (Republican) 15.9%
- J. K. Stockton (Independent) 1.5%
|- ! rowspan=2 | | Ewin L. Davis | | Democratic | 1918 | | Incumbent lost renomination. Democratic loss.
- Jo Byrns (Democratic) 87.6%
- J. Y. Freeman (Republican) 10.5%
- Howard Kester (Independent) 1.9%
|- | Jo Byrns Redistricted from the | | Democratic | 1908 | Incumbent re-elected.
|- ! | Willa Blake Eslick Redistricted from the | | Democratic | 1932 | | Incumbent retired. Democratic hold. | nowrap | {{Plainlist|
- Clarence W. Turner (Democratic) 79.0%
- G. C. Stephenson (Democratic) 19.6%
- D. J. Bevis (Independent) 1.3%
|- ! | Gordon Browning Redistricted from the | | Democratic | 1922 | Incumbent re-elected. | nowrap | {{Plainlist|
- Gordon Browning (Democratic) 77.8%
- Willoughby Stewart (Republican) 21.0%
- E. R. Dubose (Independent) 1.2%
|- ! | Jere Cooper Redistricted from the | | Democratic | 1928 | Incumbent re-elected. | nowrap | {{Plainlist|
- Jere Cooper (Democratic) 88.2%
- Mary Burnett (Republican) 10.2%
- B. S. Duggan (Independent) 1.6%
|- ! | E. H. Crump Redistricted from the | | Democratic | 1930 | Incumbent re-elected. | nowrap | {{Plainlist|
- E. H. Crump (Democratic) 90.1%
- S. A. Godsey (Republican) 7.0%
- Ollie L. Overton (Independent) 1.5%
- Robert H. Gowling (Independent) 1.1%
- Theodore W. Lorwell (Independent) 0.4%
|}
Texas
|- ! | Wright Patman | | Democratic | 1928 | Incumbent re-elected. | nowrap | {{Plainlist|
- Wright Patman (Democratic) 97.5%
- A. O. Barker (Republican) 2.5%
|- ! | Martin Dies Jr. | | Democratic | 1930 | Incumbent re-elected. | nowrap | {{Plainlist|
- Martin Dies Jr. (Democratic) 95.4%
- J. H. Buchanan (Republican) 4.6%
- John W. Conner (Liberty) 0.006%
|- ! | Morgan G. Sanders | | Democratic | 1920 | Incumbent re-elected. | nowrap | {{Plainlist|
- Morgan G. Sanders (Democratic)
- Uncontested
|- ! | Sam Rayburn | | Democratic | 1912 | Incumbent re-elected. | nowrap | {{Plainlist|
- Sam Rayburn (Democratic) 95.2%
- Floyd Harry (Republican) 4.8%
|- ! | Hatton W. Sumners | | Democratic | 1914 | Incumbent re-elected. | nowrap | {{Plainlist|
- Hatton W. Sumners (Democratic) 92.1%
- George J. McManus (Republican) 7.9%
|- ! | Luther A. Johnson | | Democratic | 1922 | Incumbent re-elected. | nowrap | {{Plainlist|
- Luther A. Johnson (Democratic)
- Uncontested
|- ! | Clay Stone Briggs | | Democratic | 1918 | Incumbent re-elected. | nowrap | {{Plainlist|
- Clay Stone Briggs (Democratic) 95.4%
- Arthur J. Long (Republican) 4.6%
|- ! | Daniel E. Garrett | | Democratic | 1920 | Incumbent re-elected. | nowrap | {{Plainlist|
- Daniel E. Garrett (Democratic) 92.0%
- William E. Lang (Republican) 8.0%
- J. W. McDonald (Liberty) 0.008%
|- ! | Joseph J. Mansfield | | Democratic | 1916 | Incumbent re-elected. | nowrap | {{Plainlist|
- Joseph J. Mansfield (Democratic) 96.7%
- Lewis Allen (Republican) 3.3%
|- ! | James P. Buchanan | | Democratic | 1912 | Incumbent re-elected. | nowrap | {{Plainlist|
- James P. Buchanan (Democratic)
- Uncontested
|- ! | Oliver H. Cross | | Democratic | 1928 | Incumbent re-elected. | nowrap | {{Plainlist|
- Oliver H. Cross (Democratic) 96.8%
- C. C. Baker (Republican) 3.2%
|- ! | Fritz G. Lanham | | Democratic | 1919 | Incumbent re-elected. | nowrap | {{Plainlist|
- Fritz G. Lanham (Democratic) 93.3%
- George Calvert (Republican) 6.7%
|- ! | Guinn Williams | | Democratic | 1922 | | Incumbent retired. Democratic hold. | nowrap | {{Plainlist|
- William D. McFarlane (Democratic)
- Uncontested
|- ! | Richard M. Kleberg | | Democratic | 1931 | Incumbent re-elected. | nowrap | {{Plainlist|
- Richard M. Kleberg (Democratic) 91.5%
- Frank B. Vaughan (Republican) 8.5%
|- ! | John Nance Garner | | Democratic | 1902 | Incumbent re-elected. | nowrap | {{Plainlist|
- John Nance Garner (Democratic) 85.8%
- Carlos G. Watson (Republican) 14.2%
|- ! | R. Ewing Thomason | | Democratic | 1930 | Incumbent re-elected. | nowrap | {{Plainlist|
- R. Ewing Thomason (Democratic)
- Uncontested
|- ! | Thomas L. Blanton | | Democratic | 1930 | Incumbent re-elected. | nowrap | {{Plainlist|
- Thomas L. Blanton (Democratic)
- Uncontested
|- ! | John Marvin Jones | | Democratic | 1916 | Incumbent re-elected. | nowrap | {{Plainlist|
- John Marvin Jones (Democratic) 96.0%
- S. E. Fish (Republican) 4.0%
|- ! rowspan=3 | (3 seats) | | New seat. Democratic gain.
- George B. Terrell (Democratic) 30.9%
- Sterling P. Strong (Democratic) 30.9%
- Joseph Weldon Bailey Jr. (Democratic) 30.8%
- Enoch G. Fletcher (Republican) 2.5%
- F. A. Blankenbeckler (Republican) 2.4%
- J. A. Simpson (Republican) 2.3%
- H. M. Shelton (Socialist) 0.10%
- P. L. Peterson (Socialist) 0.10%
- Ben O. Miller (Socialist) 0.09%
- P. A. Spain (Liberty) 0.007%
- H. G. Eastridge (Liberty) 0.007%
- John L. Andrews (Jacksonian) 0.003%
|- | | New seat. Democratic gain.
|- | | New seat. Democratic gain.
|}
Utah
|- ! | Don B. Colton | | Republican | 1920 | | Incumbent lost re-election. Democratic gain. | nowrap | {{Plainlist|
- Abe Murdock (Democratic) 50.7%
- Don B. Colton (Republican) 47.6%
- ?? (Socialist) 1.6%
- ?? (Communist) 0.1%
|- ! | Frederick C. Loofbourow | | Republican | 1930 | | Incumbent lost re-election. Democratic gain. | nowrap | {{Plainlist|
- J. W. Robinson (Democratic) 56.0%
- Frederick C. Loofbourow (Republican) 42.1%
- ?? (Socialist) 1.1%
- ?? (Communist) 0.7%
|}
Vermont
|- ! rowspan=2 | | John E. Weeks Redistricted from the | | Republican | 1930 | | Incumbent retired. Republican hold.
- Ernest W. Gibson (Republican) 64.4%
- Joseph A. McNamara (Democratic) 35.6%
|- | Ernest W. Gibson Redistricted from the | | Republican | 1923 | Incumbent re-elected.
|}
Virginia
|- ! rowspan=10 | (9 seats) | S. Otis Bland Redistricted from the | | Democratic | 1918 | Incumbent re-elected.
- Clifton A. Woodrum (Democratic) 8.3%
- Jack Montague (Democratic) 8.3%
- S. Otis Bland (Democratic) 8.2%
- Thomas G. Burch (Democratic) 8.2%
- A. Willis Robertson (Democratic) 8.2%
- Howard W. Smith (Democratic) 8.2%
- Patrick H. Drewry (Democratic) 8.2%
- Colgate Darden (Democratic) 8.2%
- John W. Flannagan Jr. (Democratic) 8.1%
- Menalcus Lankford (Republican) 3.7%
- Jacob A. Garber (Republican) 3.4%
- Fred W. McWane (Republican) 3.3%
- Roland E. Chase (Republican) 3.3%
- George Cole Scott (Republican) 3.3%
- Henry A. Wise (Republican) 3.2%
- W. M. Brown (Independent) 1.8%
- Charles C. Berkeley (Independent) 1.7%
- R. Lindsay Gordon Jr. (Independent) 0.7%
- A. J. Dunning Jr. (Prohibition) 0.7%
- Albon James Royal (Socialist) 0.2%
- Winston F. Dawson (Socialist) 0.2%
- Herman R. Ansell (Socialist) 0.2%
- David G. George (Socialist) 0.2%
- Angie M. Norris (Socialist) 0.2%
- J. E. Spaulding (Republican) 0.1%
- Others 0.04%
- Frank Lyon (Independent) 0.008%
|- | Menalcus Lankford Redistricted from the | | Republican | 1928 | | Incumbent lost re-election. Republican loss.
|- | Jack Montague Redistricted from the | | Democratic | 1912 | Incumbent re-elected.
|- | Patrick H. Drewry Redistricted from the | | Democratic | 1920 | Incumbent re-elected.
|- | Thomas G. Burch Redistricted from the | | Democratic | 1930 | Incumbent re-elected.
|- | Clifton A. Woodrum Redistricted from the | | Democratic | 1922 | Incumbent re-elected.
|- | John W. Fishburne Redistricted from the | | Democratic | 1930 | | Incumbent retired. Democratic hold.
|- | Howard W. Smith Redistricted from the | | Democratic | 1930 | Incumbent re-elected.
|- | John W. Flannagan Jr. Redistricted from the | | Democratic | 1930 | Incumbent re-elected.
|- | Joel West Flood Redistricted from the | | Democratic | 1918 | | Incumbent retired. Democratic hold.
|}
Washington
|- ! | Ralph Horr | | Republican | 1930 | | Incumbent lost renomination. Democratic gain. | nowrap | {{Plainlist|
- Marion Zioncheck (Democratic) 55.6%
- John Franklin Miller (Republican) 42.9%
- E. E. Barnes (Liberty) 1.5%
|- ! | Lindley H. Hadley | | Republican | 1914 | | Incumbent lost re-election. Democratic gain. | nowrap | {{Plainlist|
- Monrad Wallgren (Democratic) 56.1%
- Lindley H. Hadley (Republican) 35.2%
- Floyd Hatfield (Liberty) 7.6%
- W. E. Elbe (Communist) 1.0%
|- ! | Albert Johnson | | Republican | 1912 | | Incumbent lost re-election. Democratic gain. | nowrap | {{Plainlist|
- Martin F. Smith (Democratic) 46.9%
- Albert Johnson (Republican) 34.4%
- J. T. Sullivan (Liberty) 18.7%
|- ! | John W. Summers | | Republican | 1918 | | Incumbent lost re-election. Democratic gain. | nowrap | {{Plainlist|
- Knute Hill (Democratic) 56.3%
- John W. Summers (Republican) 43.7%
|- ! | Samuel B. Hill | | Democratic | 1923 | Incumbent re-elected. | nowrap | {{Plainlist|
- Samuel B. Hill (Democratic) 96.8%
- Leo Welsh (Socialist) 3.2%
|- ! | | New seat. Democratic gain. | nowrap | {{Plainlist|
- Wesley Lloyd (Democratic) 50.1%
- John T. McCutcheon (Republican) 36.8%
- Tom Martin (Liberty) 13.0%
- August Toellner (Independent) 0.1%
|}
West Virginia
|- ! | Carl G. Bachmann | | Republican | 1924 | | Incumbent lost re-election. Democratic gain. | nowrap | {{Plainlist|
- Robert L. Ramsay (Democratic) 50.9%
- Carl G. Bachmann (Republican) 48.3%
- Henry L. Franklin (Independent) 0.8%
|- ! | Frank L. Bowman | | Republican | 1924 | | Incumbent lost re-election. Democratic gain. | nowrap | {{Plainlist|
- Jennings Randolph (Democratic) 53.4%
- Frank L. Bowman (Republican) 46.2%
- Jesse T. Brillhart (Independent) 0.4%
- Emilio Garbarino (Independent) 0.02%
|- ! | Lynn Hornor | | Democratic | 1930 | Incumbent re-elected. | nowrap | {{Plainlist|
- Lynn Hornor (Democratic) 53.6%
- John M. Wolverton (Republican) 46.4%
|- ! | Robert Lynn Hogg | | Republican | 1930 | | Incumbent lost re-election. Democratic gain. | nowrap | {{Plainlist|
- George William Johnson (Democratic) 52.3%
- Robert Lynn Hogg (Republican) 47.4%
- J. S. Jeffrey (Independent) 0.2%
|- ! | Hugh Ike Shott | | Republican | 1928 | | Incumbent lost re-election. Democratic gain. | nowrap | {{Plainlist|
- John Kee (Democratic) 52.1%
- Hugh Ike Shott (Republican) 47.9%
|- ! | Joe L. Smith | | Democratic | 1928 | Incumbent re-elected. | nowrap | {{Plainlist|
- Joe L. Smith (Democratic) 56.4%
- James O. Lakin (Republican) 43.6%
|}
Wisconsin
|- ! | Thomas Ryum Amlie | | Republican | 1931 (special) | | Incumbent lost renomination. Republican hold. | nowrap | {{Plainlist|
- George W. Blanchard (Republican) 48.5%
- William D. Thompson (Democratic) 45.8%
- Otis J. Bouma (Socialist) 4.9%
- Henry H. Tubbs (Prohibition) 0.4%
- John Sekat (Ind. Communist) 0.4%
|- ! rowspan=2 | | Charles A. Kading | | Republican | 1926 | | Incumbent lost renomination. Democratic gain.
- Charles W. Henney (Democratic) 56.2%
- John B. Gay (Republican) 42.0%
- Charles D. Madsen (Socialist) 1.5%
- Georgenia J. Koppke (Prohibition) 0.3%
|- | John M. Nelson Redistricted from the | | Republican | 1920 | | Incumbent lost renomination. Republican loss.
|- ! | Gardner R. Withrow Redistricted from the | | Republican | 1920 | Incumbent re-elected. | nowrap | {{Plainlist|
- Gardner R. Withrow (Republican) 60.6%
- John J. Boyle (Democratic) 39.4%
|- ! | John C. Schafer | | Republican | 1922 | | Incumbent lost re-election. Democratic gain. | nowrap | {{Plainlist|
- Raymond J. Cannon (Democratic) 51.0%
- John C. Schafer (Republican) 28.1%
- Walter Polakowski (Socialist) 20.4%
- Carl Lester (Independent) 0.6%
|- ! | William H. Stafford | | Republican | 1928 | | Incumbent lost renomination. Democratic gain. | nowrap | {{Plainlist|
- Thomas O'Malley (Democratic) 43.8%
- Joseph A. Padway (Republican) 24.9%
- Herman O. Kent (Socialist) 23.3%
- Kavanaugh C. Downey (Independent) 5.0%
- Emil B. Gennrich (Ind. Republican) 2.8%
- Emil Gardos (Independent) 0.3%
|- ! | Michael Reilly | | Democratic | 1930 | Incumbent re-elected. | nowrap | {{Plainlist|
- Michael Reilly (Democratic) 59.1%
- Louis J. Fellens (Republican) 38.7%
- Franklin Pfeiffer (Socialist) 2.2%
|- ! | Gerald J. Boileau Redistricted from the | | Republican | 1930 | Incumbent re-elected. | nowrap | {{Plainlist|
- Gerald J. Boileau (Republican) 51.3%
- Frank D. Chapman (Democratic) 48.7%
|- ! | George J. Schneider Redistricted from the | | Republican | 1922 | | Incumbent lost re-election. Democratic gain. | nowrap | {{Plainlist|
- James Hughes (Democratic) 50.7%
- George J. Schneider (Republican) 49.3%
|- ! | James A. Frear Redistricted from the | | Republican | 1912 | Incumbent re-elected. | nowrap | {{Plainlist|
- James A. Frear (Republican) 56.9%
- Miles H. McNally (Democratic) 43.1%
|- ! | Hubert H. Peavey Redistricted from the | | Republican | 1922 | Incumbent re-elected. | nowrap | {{Plainlist|
- Hubert H. Peavey (Republican) 59.2%
- Peter B. Cadigan (Democratic) 39.8%
- Arvid Salonen (Ind. Communist) 1.1%
|}
Wyoming
|- ! | Vincent Carter | | Republican | 1928 | Incumbent re-elected. | nowrap | {{Plainlist|
- Vincent Carter (Republican) 49.7%
- Paul R. Greever (Democratic) 47.7%
- W. W. Wolfe (Socialist) 1.6%
- James R. Carpenter (American) 0.8%
- George Morphis (Communist) 0.2%
|}
Non-voting delegates
|- ! | James Wickersham | | Republican | 1908 1916 (lost, but won contest) 1918 (lost, but won contest) 1920 (retired) 1930 | | Incumbent lost re-election. Democratic gain. | nowrap | {{Plainlist|
- Anthony Dimond (Democratic) 71.68%
- James Wickersham (Republican) 28.32%
|- !
|- ! | José Lorenzo Pesquera | | Union Party | 1932 (special) | | Incumbent retired. New delegate elected. Socialist gain.
| nowrap | {{Plainlist|
- Santiago Iglesias Pantín (Republican Union) 54.27%
- Benigno Fernández García (Liberal) 44.35%
- Julio Medina González (Nationalist) 1.37%
|}
Notes
References
References
- "Election Statistics". Office of the Clerk, U.S. House of Representatives.
- (November 13, 1932). "Elections in Hard Times -- EDITORIAL". New York Times.
- Arthur Krock. (November 9, 1932). "Sweep is National". New York Times.
- "Official congressional directory / by W.H. Michael. v.072 no.02 pt.01 yr.1932.".
- (1998). "United States Congressional elections, 1788-1997: the official results of the elections of the 1st through 105th Congresses". McFarland.
- "Our Campaigns - PA - District 20 - Special Election Race - Apr 26, 1932".
- "Our Campaigns - AK Territorial Delegate - Recount Race - Jan 07, 1919".
- "Our Campaigns - AK Territorial Delegate - Recount Race - Mar 01, 1921".
- "Our Campaigns - AK Territorial Delegate Race - Nov 08, 1932".
This article was imported from Wikipedia and is available under the Creative Commons Attribution-ShareAlike 4.0 License. Content has been adapted to SurfDoc format. Original contributors can be found on the article history page.
Ask Mako anything about 1932 United States House of Representatives elections — get instant answers, deeper analysis, and related topics.
Research with MakoFree with your Surf account
Create a free account to save articles, ask Mako questions, and organize your research.
Sign up freeThis content may have been generated or modified by AI. CloudSurf Software LLC is not responsible for the accuracy, completeness, or reliability of AI-generated content. Always verify important information from primary sources.
Report