From Surf Wiki (app.surf) — the open knowledge base
Wind power in the United Kingdom
None
None
The United Kingdom is the best location for wind power in Europe and one of the best in the world. The combination of long coastline, shallow water and strong winds make offshore wind unusually effective.
By 2025, the UK had over 12,000 wind turbines with a total installed capacity of 32gigawatts (GW): 16 GW onshore and 16 GW offshore, the fifth largest capacity of any country. In that year, wind generated over 85TWh of electricity, almost 30% of Great Britain's total generation.
Wind power is the largest source of renewable energy in the UK, but at under 5% provides far less primary energy than oil or fossil gas. However, wind power generates electricity, which is far more powerful in terms of useful energy than the same amount of thermal primary energy. Polling of public opinion consistently shows strong support for wind power in the UK, with nearly three-quarters of the population agreeing with its use in 2022, even for people living near onshore wind turbines.
The UK government has committed to a major expansion of offshore capacity to 60 GW by 2030, with 5GW from floating wind; one reason for this is to improve energy security.
History

(installed 2015 and 2020, projected by 2025)
| label-sizeD=9 | label-posD=bottom | label-colorD=hard green | label-offset-xD=0 | label-offset-yD=0
| shape-color1=hard green,50 | shape-outline1= dark green | mark-coord1= | mark-title1=Scotland, Onshore wind power | mark-description1=Rated Capacity at 2020: 7,543 MW | mark-size1=75
| mark-coord2 = | label-offset-y2=-35| shape-color2=soft green | mark-title2 = Scotland, Onshore wind power | mark-description2= Rated Capacity at end 2015: 5,413 MW | mark-size2=54
| mark-coord3 = | shape-color3=hard green | mark-title3 = North West England, Onshore wind power | mark-description3= Rated Capacity at 2020: 193 MW | mark-size3=4
| mark-coord4 = | label-offset-y4=0| shape-color4=soft green | mark-title4 = North West England, Onshore wind power | mark-description4= Rated Capacity at end 2015: 111 MW. (2020=193 MW) | mark-size4=4
| mark-coord5 = | shape-color5=hard green | mark-title5 = North East England, Onshore wind power | mark-description5= Rated Capacity at end 2020: 170 MW | mark-size5=4
| mark-coord6 = | label-offset-y6=0| shape-color6=soft green | mark-title6 = North East England, Onshore wind power | mark-description6= Rated Capacity at end 2015: 116 MW. (2020=170 MW) | mark-size6=4
| mark-coord7 = | shape-color7=hard green | mark-title7 = Northern Ireland, Onshore wind power | mark-description7= Rated Capacity at end 2020: 472 MW | mark-size7=5
| mark-coord8 = | shape-color8=soft green | mark-title8 = Northern Ireland, Onshore wind power | mark-description8= Rated Capacity at end 2015: 365 (2020=472 MW) | mark-size8=6
| mark-coord9 = | shape-color9=hard green | mark-title9 = Wales, Onshore wind power | mark-description9= Rated Capacity at end 2020: 936 MW | mark-size9=10
| mark-coord10 = | shape-color10=soft green | mark-title10 = Wales, Onshore wind power | mark-description10= Rated Capacity at end 2015: 447 MW (2020=936 MW) | mark-size10=5
| mark-coord11 = | shape-color11=hard green | mark-title11 = Yorkshire & Humber, Onshore wind power | mark-description11= Rated Capacity at end 2020: 805 MW | mark-size11=8
| mark-coord12 = | shape-color12=soft green | mark-title12 = Yorkshire & Humber, Onshore wind power | mark-description12= Rated Capacity at end 2015: 770 MW (2020=805 MW) | mark-size12=7
| mark-coord13 = | shape-color13=hard green | mark-title13 = East Midlands, Onshore wind power | mark-description13= Rated Capacity at end 2020: 56 MW | mark-size13=4
| mark-coord14 = | shape-color14=soft green | mark-title14 = East Midlands, Onshore wind power | mark-description14= Rated Capacity at end 2015: 56 MW (2020=56 MW) | mark-size14=4
| mark-coord15 = | shape-color15=hard green | mark-title15 = Eastern England, Onshore wind power | mark-description15= Rated Capacity at end 2020: 157 MW | mark-size15=4
| mark-coord16 = | shape-color16=soft green | mark-title16 = Eastern England, Onshore wind power | mark-description16= Rated Capacity at end 2015: 151 MW (2020= 157 MW) | mark-size16=4
| mark-coord17 = | shape-color17=hard green | mark-title17 = South East England, Onshore wind power | mark-description17= Rated Capacity at end 2020: 60 MW | mark-size17=4
| mark-coord18 = | shape-color18=soft green | mark-title18 = South East England, Onshore wind power | mark-description18= Rated Capacity at end 2015: 60 MW (2020= 60 MW) | mark-size18=4
| mark-coord19 = | shape-color19=hard green | mark-title19 = South West England, Onshore wind power | mark-description19= Rated Capacity at end 2020: 20 MW | mark-size19=3
| mark-coord20 = | shape-color20=soft green | mark-title20 = South West England, Onshore wind power | mark-description20= Rated Capacity at end 2015: 20 MW (2020= 20 MW) | mark-size20=3
| mark-coord23 = | shape-color23=#b3c6ff| shape-outline23=soft blue | mark-title23 = Scotland, Offshore wind power | mark-description23=Projected capacity by 2025: 2,743 MW | mark-size23=27
| mark-coord22 = | shape-color22=hard blue | mark-title22 = Scotland, Offshore wind power | mark-description22= Rated capacity at end 2020: 889 MW | mark-size22=9
| mark-coord21 = | shape-color21=soft blue | mark-title21 = Scotland, Offshore wind power | mark-description21= Rated capacity at end 2015: 174 MW (2020=889 MW, projected 2,743 MW by 2025) | mark-size21=4
| mark-coord24 = | shape-color24=hard blue | mark-title24 = North West England, Offshore wind power | mark-description24= Rated capacity at end 2020: 2,005 MW | mark-size24=20
| mark-coord25 = | shape-color25=soft blue | mark-title25 = North West England, Offshore wind power | mark-description25= Rated capacity at end 2015: 1,087 MW (2020 = 2,005 MW) | mark-size25=10
| mark-coord26 = | shape-color26=hard blue | mark-title26 = North East England, Offshore wind power | mark-description26= Rated capacity at end 2020: 102 MW | mark-size26=4
| mark-coord27 = | shape-color27=soft blue | mark-title27 = North East England, Offshore wind power | mark-description27= Rated capacity at end 2015: 62 MW (2020 = 102 MW) | mark-size27=4
| mark-coord30 = | shape-color30=#b3c6ff| shape-outline30=soft blue | mark-title30 = Yorkshire & Humber, Offshore wind power | mark-description30= Projected capacity by end 2025: 8,045 MW | mark-size30=80
| mark-coord29 = | shape-color29=hard blue | mark-title29 = Yorkshire & Humber, Offshore wind power | mark-description29= Rated capacity at end 2020: 1,659 MW | mark-size29=16
| mark-coord28 = | shape-color28=soft blue | mark-title28 = Yorkshire & Humber, Offshore wind power | mark-description28= Rated capacity at end 2015: 429MW (2020=1,645MW, projected 8,045 MW by 2025) | mark-size28=9
| mark-coord33 = | shape-color33=#b3c6ff| shape-outline33=soft blue | mark-title33 = East Midlands, Offshore wind power | mark-description33= Projected capacity by end 2025: 1,321 MW | mark-size33=13
| mark-coord32 = | shape-color32=hard blue | mark-title32 = East Midlands, Offshore wind power | mark-description32= Rated capacity at end 2020: 464 MW | mark-size32=5
| mark-coord31 = | shape-color31=soft blue | mark-title31 = East Midlands, Offshore wind power | mark-description31= Rated capacity at end 2015: 464MW (2020=464MW, projected 1,321 MW by 2025) | mark-size31=9
| mark-coord34 = | shape-color34=hard blue | mark-title34 = Wales, Offshore wind power | mark-description34= Rated capacity at end 2020: 726 MW | mark-size34=8
| mark-coord35 = | shape-color35=soft blue | mark-title35 = Wales, Offshore wind power | mark-description35= Rated capacity at end 2015: 726 MW (2020=726 MW) | mark-size35=7
| mark-coord38 = | shape-color38=hard blue | mark-title38 = Eastern England, Offshore wind power | mark-description38= Rated capacity at end 2020: 2,381 MW | mark-size38=23
| mark-coord37 = | shape-color37=soft blue | mark-title37 = Eastern England, Offshore wind power | mark-description37= Rated capacity at end 2015: 1,053 MW (2020=2,381 MW) | mark-size37=23
| mark-coord40 = | shape-color40=hard blue | mark-title40 = South east England, Offshore wind power | mark-description40= Rated capacity at end 2020: 1,470 MW | mark-size40=14
| mark-coord39 = | shape-color39=soft blue | mark-title39 = South east England, Offshore wind power | mark-description39= Rated capacity at end 2015: 1,069 MW (2020=1,470 MW) | mark-size39=14
| mark-coord46 = | mark-title46 = none | mark-size46=0
| mark-coord47 = | mark-title47 = none | mark-size47=0|label-pos47=right
| mark-coord58 = | mark-title58 = none | mark-size58=4| shape-color58=soft green
| mark-coord59 = | mark-title59 = none| label-pos59=right | mark-size59=4| shape-color59=soft blue
| mark-coord57 = | mark-title57 = none | mark-size57=10| shape-color57=soft green
| mark-coord56 = | mark-title56 = none| label-pos56=right | mark-size56=10| shape-color56=soft blue
| mark-coord55 = | mark-title55 = none | mark-size55=20| shape-color55=soft green
| mark-coord54 = | mark-title54 = none| label-pos54=right | mark-size54=20| shape-color54=soft blue
| mark-coord53 = | mark-title53 = none | mark-size53=30| shape-color53=soft green
| mark-coord52 = | mark-title52 = none| label-pos52=right | mark-size52=30| shape-color52=soft blue| label-offset-x52=-7
| mark-coord51 = | shape-color51=#b3c6ff| shape-outline51=soft blue | mark-title51 = none| label-pos51=right| label-offset-y51=-11| label-offset-x51=-6 | mark-size51=25
| mark-coord50 = | shape-color50=hard blue | mark-title50 = none| label-pos50=right| label-offset-y50=-4| label-offset-x50=8 | mark-size50=13
| mark-coord49 = | shape-color49=soft blue | mark-title49 = none| label-pos49=right| label-offset-y49=3| label-offset-x49=16 | mark-size49=7
| mark-coord48 = | mark-title48 = none | mark-size48=0
| UK wind farm capacity by region (table of figures) | UK Region | Onshore wind capacity | Offshore wind capacity | Scotland | N.W. England | N.E.England | Yorks & Humber | N. Ireland | Wales | East Midlands | Eastern | S.E. England | S.W. England | UK Totals | |||
|---|---|---|---|---|---|---|---|---|---|---|---|---|---|---|---|---|---|
| 2015 (MW) | 2020 (MW) | 2015 (MW) | 2020 (MW) | 2025 (MW) | |||||||||||||
| Projected | |||||||||||||||||
| 5,413 | 7,543 | 174 | 889 | 2,743 | |||||||||||||
| 111 | 193 | 1,087 | 2,005 | 2,005 | |||||||||||||
| 116 | 170 | 62 | 102 | 102 | |||||||||||||
| 771 | 806 | 429 | 1,659 | 8,045 | |||||||||||||
| 365 | 472 | 0 | 0 | 0 | |||||||||||||
| 448 | 936 | 726 | 726 | 726 | |||||||||||||
| 56 | 56 | 464 | 464 | 1,321 | |||||||||||||
| 131 | 157 | 1,053 | 2,381 | 2,381 | |||||||||||||
| 60 | 60 | 1,070 | 1,470 | 1,470 | |||||||||||||
| 20 | 20 | 0 | 0 | 0 | |||||||||||||
| 7,491 | 10,414 | 5,064 | 9,695 | 18,792 |
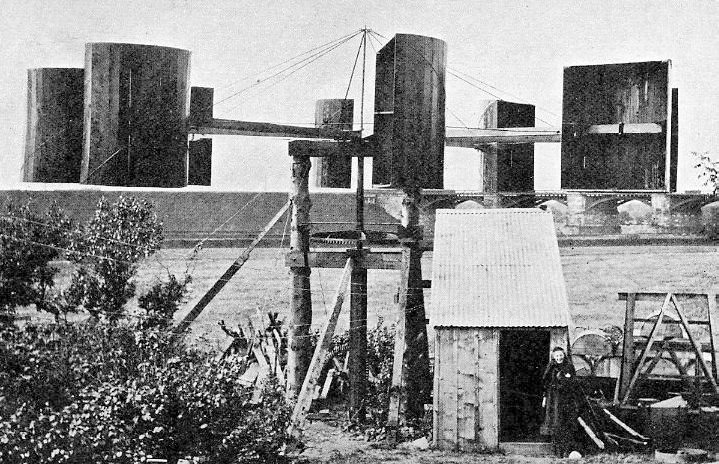
The world's first electricity generating wind turbine was a battery charging machine installed in July 1887 by Scottish academic James Blyth to light his holiday home in Marykirk, Scotland. It was in 1951 that the first utility grid-connected wind turbine to operate in the United Kingdom was built by John Brown & Company in the Orkney Islands. In the 1970s, industrial scale wind generation was first proposed as an electricity source for the United Kingdom. An article on wind power costs from the period suggested that the capital cost per installed kilowatt would be in the range of £150 to £250, but that with inflation this would be competitive, and predicted that lower-cost new windmill designs would soon be available.
Modern commercial deployment began after electricity-market reforms around 1990. The Non-Fossil Fuel Obligation (NFFO) created auction rounds that required electricity companies to buy output from non-fossil generators at a premium funded by a levy, and the first commercial wind farm in the UK was commissioned at Delabole in Cornwall in 1991.
In 2007 the United Kingdom Government agreed to an overall European Union target of generating 20% of the EU's energy supply from renewable sources by 2020. Each EU member state was given its own allocated target: for the United Kingdom it is 15%. This was formalised in January 2009 with the passage of the EU Renewables Directive. As renewable heat and renewable fuel production in the United Kingdom are at extremely low bases, RenewableUK estimated that this would require 35–40% of the United Kingdom's electricity to be generated from renewable sources by that date, to be met largely by 33–35gigawatts (GW) of installed wind capacity.
In December 2007, the Government announced plans for an expansion of wind energy in the United Kingdom, by conducting a Strategic Environmental Assessment of up to 25GW worth of wind farm offshore sites in preparation for a new round of development. These proposed sites were in addition to the 8GW worth of sites already awarded in the two earlier rounds of site allocations, Round1 in 2001 and Round2 in 2003. Taken together it was estimated that this would result in the construction of over 7,000 offshore wind turbines.
In 2010, 653MW of offshore wind came online. The following year, only one offshore wind farm, phase1 of the Walney Wind Farm, was completed in 2011 with a capacity of 183MW. On 28 December 2011 wind power set a then record contribution to the United Kingdom's demand for electricity of 12.2%.
2012 was a significant year for the offshore wind industry with 4large wind farms becoming operational with over 1.1GW of generating capability coming on stream. In the year July 2012 to June 2013, offshore wind farms with a capacity of 1.463GW were installed, for the first time growing faster than onshore wind which grew by 1.258 GW. The offshore wind industry continued to develop in 2013 with what was once the largest wind farm in the world, the London Array, becoming operational with over 630MW of generating capability coming on stream.
During 2013, 27.4TWh of energy was generated by wind power, which contributed 8.7% of the UK's electricity demand.
On 1 August 2013, Deputy Prime Minister Nick Clegg opened the Lincs Offshore Wind Farm. On commissioning the total capacity of wind power exceeded 10GW of installed capacity. In 2014, Prime Minister David Cameron said that people were "fed up" with wind turbines being built close to homes; onshore wind subsidies were removed and in 2015 planning rules changed to give local authorities strong controls on wind turbine development, greatly reducing onshore deployment.
During 2014, 28.1TWh of energy was generated by wind power (an average of 3.2GW, about 24% of the 13.5GW installed capacity at the time), which contributed 9.3% of the UK's electricity requirement. In the same year, Siemens announced plans to build a £310million ($264million) facility for making offshore wind turbines in Paull, England, as Britain's wind power capacity rapidly expanded. Siemens chose the Hull area on the east coast of England because it is close to other large offshore projects planned in coming years. The new plant began producing turbine rotor blades in December 2016. The plant and the associated service centre, in Green Port Hull nearby, will employ about 1,000 workers.

During 2015, 40.4TWh of energy was generated by wind power and the quarterly generation record was set in the three-month period from October to December 2015, with 13% of the nation's electricity demand met by wind. 2015 saw 1.2GW of new wind power capacity brought online, a 9.6%increase of the total UK installed capacity. Three large offshore wind farms came on stream in 2015, Gwynt y Môr (576MW max. capacity), Humber Gateway (219MW) and Westermost Rough (210MW).
In 2016, the chief executive of DONG Energy (now known as Ørsted A/S), the UK's largest wind farm operator, predicted that wind power could supply more than half of the UK's electricity demand in the future. He pointed to the tumbling cost of green energy as evidence that wind and solar could supplant fossil fuels quicker than expected.
By 2020, climate change concerns led to greater public support for wind turbines, but despite government policy stating onshore wind is a "key building block" for electricity generation it was unclear if the 2015 onshore planning restrictions would be eased.
In 2022, wind generation in the UK exceeded 20 GW for the first time, reaching 20.9 GW between 1200h and 1230h on 2 November 2022. This was followed in 2023 with a record 21.6 GW on 10 January during a period of strong winds.
| Year | Cumulative | ||||||||||||||||||||||||||
|---|---|---|---|---|---|---|---|---|---|---|---|---|---|---|---|---|---|---|---|---|---|---|---|---|---|---|---|
| capacity | |||||||||||||||||||||||||||
| (MW) | Generation | ||||||||||||||||||||||||||
| (GWh) | Capacity factor % | ||||||||||||||||||||||||||
| (Onshore %, Offshore %) | % of total | ||||||||||||||||||||||||||
| electricity use | Refs | 2008 | 2009 | 2010 | 2011 | 2012 | 2013 | 2014 | 2015 | 2016 | 2017 | 2018 | 2019 | 2020 | 2021 | 2022 | 2023 | 2024 | |||||||||
| 2,974 | 5,357 | 20.6 | 1.50 | url=http://www.decc.gov.uk/publications/basket.aspx | archive-url=https://archive.today/20121223163717/http://www.decc.gov.uk/publications/basket.aspx?filetype=4&filepath=11%2Fstats%2Fenergy%2Fenergy-source%2F2332-historical-electricity-data-1920-to-2010.xls&minwidth=true%23basket | title=Department of Energy and Climate Change | archive-date=23 December 2012 | access-date=16 August 2020 | url-status=live}} | ||||||||||||||||||
| 4,051 | 6,904 | 19.5 | 2.01 | ||||||||||||||||||||||||
| 5,204 | 7,950 | 17.4 | 2.28 | ||||||||||||||||||||||||
| 6,540 | 12,675 | 22.1 | 3.81 | ||||||||||||||||||||||||
| 8,871 | 20,710 | 26.7 | 5.52 | ||||||||||||||||||||||||
| 10,976 | 24,500 | 25.5 | 7.39 | ||||||||||||||||||||||||
| 12,440 | 28,100 | 25.8 | 9.30 | url=http://www.ewea.org/fileadmin/files/library/publications/statistics/EWEA-Annual-Statistics-2014.pdf | date=16 February 2015 | title=Wind in power – 2014 European statistics | access-date=27 March 2019}} | ||||||||||||||||||||
| 13,602 | 40,442 | 33.9 | 11.0 | url=http://www.ewea.org/fileadmin/files/library/publications/statistics/EWEA-Annual-Statistics-2015.pdf | date=5 February 2016 | title=Wind in power – 2015 European statistics | access-date=27 March 2019}} | ||||||||||||||||||||
| 16,218 | 37,368 | 26.3 | 12 | ||||||||||||||||||||||||
| 19,837 | 49,607 | 28.5 | 17 | url=https://www.gov.uk/government/uploads/system/uploads/attachment_data/file/669723/Renewables.pdf | title=BEIS renewables statistics | access-date=16 March 2018}} | |||||||||||||||||||||
| 21,700 | 57,100 | 30.0 | 18 | url=https://assets.publishing.service.gov.uk/government/.../Press_Notice_March_2019.pdf | title=BEIS renewables statistics | access-date=26 May 2019}} | |||||||||||||||||||||
| 23,950 | 64,134 | 32% | 21 | ||||||||||||||||||||||||
| 24,485 | 75,369 | ~ | |||||||||||||||||||||||||
| (28, 46) | 24 | date=31 March 2022 | title=Table 6.1. Renewable electricity capacity and generation | url=https://assets.publishing.service.gov.uk/government/uploads/system/uploads/attachment_data/file/1022021/ET_6.1_SEP_21.xlsx | access-date=3 April 2022 | website=GOV.UK}} | |||||||||||||||||||||
| 25,730 | 64,460 | ~ | |||||||||||||||||||||||||
| (23, 37) | 21 | ||||||||||||||||||||||||||
| 28,759 | 80,162 | (27.3, 41.1) | 24.6 | ||||||||||||||||||||||||
| 30,116 | 82,002 | (24.5, 39.7) | 28.8 | ||||||||||||||||||||||||
| 32,280 | 84,058 | (25.3, 36.3) | 29.5 | date=2025-03-27 | title=Energy Trends: UK renewables | url=https://www.gov.uk/government/statistics/energy-trends-section-6-renewables | access-date=2025-04-02 | website=GOV.UK | language=en}} |
Wind farms
Offshore
Main article: Offshore wind power in the United Kingdom
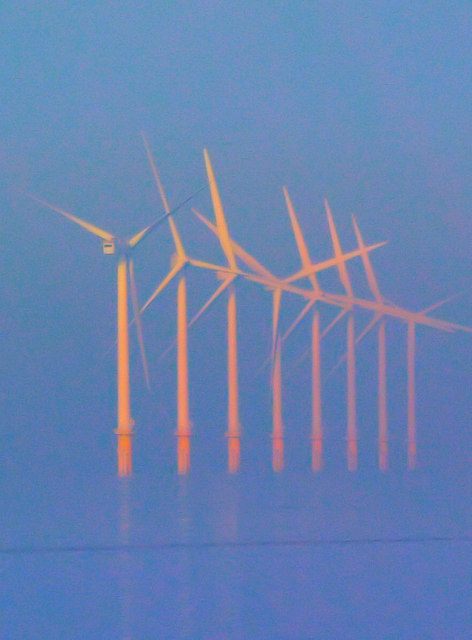
The total offshore wind power capacity installed in the United Kingdom at the start of 2022 was 11.3GW. The United Kingdom became the world leader of offshore wind power generation in October 2008 when it overtook Denmark. In 2013, the 175-turbine London Array wind farm, located off the Kent coast, became the largest offshore wind farm in the world; this was surpassed in 2018 by the Walney 3 Extension.
The United Kingdom has been estimated to have over a third of Europe's total offshore wind resource, which is equivalent to three times the electricity needs of the nation at current rates of electricity consumption (In 2010 peak winter demand was 59.3GW, in summer it drops to about 45GW). One estimate calculates that wind turbines in one third of United Kingdom waters shallower than 25 m would, on average, generate 40GW; turbines in one third of the waters between 25 m and 50 m depth would on average generate a further 80GW, i.e. 120GW in total. An estimate of the theoretical maximum potential of the United Kingdom's offshore wind resource in all waters to 700 m depth gives the average power as 2200GW.
The first developments in United Kingdom offshore wind power came about through the now discontinued Non-Fossil Fuel Obligation (NFFO), leading to two wind farms, Blyth Offshore and Gunfleet sands. The NFFO was introduced as part of the Electricity Act 1989 and obliged United Kingdom electricity supply companies to secure specified amounts of electricity from non-fossil sources, which provided the initial spur for the commercial development of renewable energy in the United Kingdom.
2001 saw 17 applications being granted permission to proceed in what has become known as Round1 of United Kingdom offshore wind development.
Offshore wind projects completed in 20102011 had a levelised cost of electricity of £136/MWh, which fell to £131/MWh for projects completed in 2012–14 and £121/MWh for projects approved in 20122014; the industry hopes to get the cost down to £100/MWh for projects approved in 2020.
The construction price for offshore windfarms has fallen by almost a third since 2012 while technology improved and developers think a new generation of even larger turbines will enable yet more future cost reductions. In 2017 the UK built 53% of the 3.15 GW European offshore wind farm capacity. In 2020, Boris Johnson pledged that, by the end of the decade, offshore wind would generate enough energy to power every UK home.
At the start of 2022 there was a total of 11.26 GW of installed offshore wind capacity. During 2022 an additional 3.2 GW of capacity was added with the commissioning of the Moray East, Triton Knoll and Hornsea Project Two wind farms. A further 13.6 GW of capacity is either under construction (Neart Na Gaoithe, Sofia, Seagreen & Doggerbank A) or has been awarded a Contract for Difference in Round 3 or Round 4.
Future plans
The government accelerated its decommissioning of coal power stations in early 2020, aiming for a 2024 phase-out date; achieving this on 30 September 2024 with the closure of Ratcliffe-on-Soar Power Station.
Recent British nuclear power station building programs have encountered significant technical issues and project overruns that have resulted in significant increases in project costs. These issues have resulted in new UK nuclear projects failing to secure project financing. Similarly, SMR technology is not currently economically competitive with offshore wind in the UK. Following the Fukushima nuclear disaster public support for new nuclear has fallen. In response, the UK government increased its previous commitment for 40GW of Offshore wind capacity by 2030. As of 2020, this represents a 355% increase over current capacity in 10 years. It is expected the Crown Estate will announce multiple new leasing Rounds and increases to existing bidding areas throughout the 20202030 period to achieve the government's aim of 40GW.
In 2023 the government increased offshore wind planned by the UK by 2030 to 50GW, and has a pipeline of offshore wind power schemes of 100GW.
Scottish offshore
Main article: Wind power in Scotland
In addition to the UK Round 3 auction, the Scottish Government and the Crown Estate also called for bids on potential sites within Scottish territorial waters. These were originally considered as too deep to provide viable sites, but 17companies submitted tenders and the Crown Estate initially signed exclusivity agreements with 9companies for 6GW worth of sites. Following publication of the Scottish Government's sectoral marine plan for offshore wind energy in Scottish territorial waters in March 2010, six sites were given approval subject to securing detailed consent. Subsequently, 4sites have been granted agreements for lease.
In 2022 Crown Estate announced the outcome of its application process for ScotWind Leasing, the first Scottish offshore wind leasing round in over a decade and the first ever since the management of offshore wind rights were devolved to Scotland. 17 projects were selected with a capacity of 25 GW.
Scotland has a target for 2030, made in 2023, of 11GW of offshore wind by 2030. This would represent an increase of 400% in offshore wind and a 60% increase in total wind generated power
Onshore


The first commercial wind farm was built in 1991 at Delabole in Cornwall; it consisted of 10turbines each with a capacity to generate a maximum of 400kW. Following this, the early 1990s saw a small but steady growth with half a dozen farms becoming operational each year; the larger wind farms tended to be built on the hills of Wales, examples being Rhyd-y-Groes, Llandinam, Bryn Titli and Carno. Smaller farms were also appearing on the hills and moors of Northern Ireland and England. The end of 1995 saw the first commercial wind farm in Scotland go into operation at Hagshaw Hill. The late 1990s saw sustained growth as the industry matured. In 2000, the first turbines capable of generating more than 1MW were installed and the pace of growth started to accelerate as the larger power companies like Scottish Power and Scottish & Southern became increasingly involved in order to meet legal requirements to generate a certain amount of electricity using renewable means (see Renewables obligations below). Wind turbine development continued rapidly and by the mid-2000s 2MW+ turbines were the norm. In 2007, the German wind turbine producer Enercon installed the first 6MW model ("E-126"); The nameplate capacity was changed from 6MW to 7 MW after technical revisions were performed in 2009 and to 7.5 MW in 2010.
Growth continued with bigger farms and larger, more efficient turbines sitting on taller and taller masts. Scotland's sparsely populated, hilly and windy countryside became a popular area for developers and the United Kingdom's first 100MW+ farm went operational in 2006 at Hadyard Hill in South Ayrshire. 2006 also saw the first use of the 3MW turbine. In 2008, the largest onshore wind farm in England was completed on Scout Moor and the repowering of the Slieve Rushen Wind Farm created the largest farm in Northern Ireland. In 2009, the largest wind farm in the United Kingdom went live at Whitelee on Eaglesham Moor in Scotland. This is a 539MW wind farm consisting of 215turbines. Approval has been granted to build several more 100MW+ wind farms on hills in Scotland and will feature 3.6MW turbines.
As of September 2013, there were 458 operational onshore wind farms in the United Kingdom with a total of 6565MW of nameplate capacity. A further 1564MW of capacity is currently being constructed, while another 4.8GW of schemes have planning consent.
In 2009, United Kingdom onshore wind farms generated 7,564GWh of electricity; this represents a 2% contribution to the total United Kingdom electricity generation (378.5TWh).
Large onshore wind farms are usually directly connected to the National Grid, but smaller wind farms are connected to a regional distribution network, termed "embedded generation". In 2009 nearly half of wind generation capacity was embedded generation, but this is expected to reduce in future years as larger wind farms are built.
Gaining planning permission for onshore wind farms continues to prove difficult, with many schemes stalled in the planning system and a high rate of refusal. The RenewableUK (formerly BWEA) figures show that there are approximately 7,000MW worth of onshore schemes waiting for planning permission. On average, a wind farm planning application takes two years to be considered by a local authority, with an approval rate of 40%. This compares extremely unfavourably with other types of major applications, such as housing, retail outlets and roads, 70% of which are decided within the 13- to 16-week statutory deadline; for wind farms the rate is just 6%.
Approximately half of all wind farm planning applications, over 4GW worth of schemes, have objections from airports and traffic control on account of their impact on radar. In 2008 NATS en Route, the BWEA, the Ministry of Defence and other government departments signed a Memorandum of Understanding seeking to establish a mechanism for resolving objections and funding for more technical research.
Wind farms in the UK often have to meet a maximum height limit of 125 m (excluding Scotland). However, modern lower cost wind turbines installed on the continent are over 200 m tall. This planning criteria has stunted the development of onshore wind in the UK.
List of the largest operational and proposed onshore wind farms
Economics
Subsidies and taxes
From 2002 to 2015, windfarms were subsidised through the Renewables Obligation where British electricity suppliers were required by law to provide a proportion of their sales from renewable sources such as wind power or pay a penalty fee. The supplier then received Renewable Obligation Certificates (ROC) for each MW·h of electricity they have purchased. The Energy Act 2008 introduced banded ROCs for different technologies from April 2009. Onshore wind receives 1ROC per MWh, but since the Renewables Obligation Banding Review in 2009, offshore wind has received 2ROCs to reflect its higher costs of generation. In Northern Ireland, a banding of 4 ROCs is available for small onshore turbines.
Wind energy received approximately 40% of the total revenue generated by the Renewables Obligation, and ROCs provided over half of the revenue of the wind farms involved. The total annual cost of the Renewables Obligation reached £6.3billion in 2019–20, of which 67% was for wind power. This cost was added to end-user electricity bills. Sir David King warned that this could increase UK levels of fuel poverty.
The government closed the Renewables Obligation to new onshore wind power projects in 2016. Support for offshore wind was moved into the government's Contract for Difference (CfD) regime. Support for wind power under this programme rose to £1.7billion in 2020, with £1.6billion of that total shared between six offshore windfarms.
In 2023 there was an effective windfall tax.
Costs
The economics of wind power are driven by factors such as the capital, operating and finance costs, as well as the operational performance or capacity factor. These factors are in turn affected by issues such as location, turbine size and spacing and, for offshore windfarms, water depth and distance from shore. Operating costs and performance change over a windfarm's life, and several years of data are required before an assessment of the trajectory of these figures can be made.
A review of financial accounts published by the Renewable Energy Foundation in 2020 showed that UK offshore windfarm capital costs rose steadily from 2002 to around 2013, before stabilising and perhaps falling slightly. Operating costs had risen steadily up to the time of the study, but financing costs had fallen. This picture was confirmed by a comprehensive review of audited accounts data for UK offshore windfarms, which found that levelised costs rose from around £60–70/MWh for early projects, to around £140–160/MWh by 2010–13, before stabilising.
The Renewable Energy Foundation study also examined onshore wind costs, finding that capital costs had risen to around 2011 before declining slightly thereafter, while operating costs had risen steadily. Estimates of the levelised cost of UK onshore wind are older. A 2011 study by the engineering consultancy Mott MacDonald put onshore wind costs at £83/MWh, below new nuclear at £96/MWh.
Auction bids
In the UK's contract for difference auctions of 2017 and 2019, offshore windfarms made bids to supply the grid at strike prices much lower than anything seen before: £57.50/MWh in the 2017 auction and £39.65/MWh in the 2019 one. These values are below the ostensible windfarm costs outlined in the previous section, and have therefore been widely taken as evidence of a fundamental change in the economics of offshore wind power; in other words that technological advances have led to much lower costs.
There has been no similar reduction in bidding prices from onshore windfarms. The lowest successful bid under the CfD regime has been £79.99/MWh.
Effects on electricity price
Historically, wind power had raised costs of electricity slightly. In 2015, it was estimated that the use of wind power in the UK had added £18 to the average yearly electricity bill. This was the additional cost to consumers of using wind to generate about 9.3% of the annual total (see table below) – about £2 for each 1%.
The building of UK wind farms has been supported through the Renewables Obligation and, since 2016, by price guarantee support through the Contracts for Difference regime too. The 2018 levelised cost of electricity (LCOE) of offshore wind was in the range £100–150/MWh. However, in recent CfD auctions, strike prices as low as £39.65/MWh have been agreed for offshore wind projects, which has led to an assumption that there has been an equivalent reduction in the underlying costs. Due to the structure of the contract for difference arrangements wind generators pay the government when power prices exceed the strike price. Wholesale power prices averaged £57/MWh in 2018 and £113/MWh in 2021 before spiking above £400/MWh in 2022.
Offshore wind has historically been more expensive than onshore wind, but in 2016 it was predicted that it would have the lowest levelised cost of electricity in the United Kingdom in 2020 when a carbon cost was applied to generating technologies. In the 2022 AR4 CFD auction, offshore wind cleared at an average price of £37.35/MWh versus onshore winds average price of £42.47/MWh (both 2012 prices).
Actual cost performance
A statistical and econometric analysis of a majority of onshore and offshore windfarms built in the United Kingdom since 2002 with a capacity of more than 10MW has been performed by a former professor of the School of Economics at the University of Edinburgh on behalf of an anti wind power organisation. It finds that the actual cost of onshore and offshore wind generation has not fallen significantly. Rather, capital and operating costs per MW have increased, the latter driven by higher than expected frequency of equipment failure and preventative maintenance associated with new generations of larger turbines. The study concludes that, after current contracts guaranteeing above-market prices expire, expected revenues from generation will be less than operating cost. If confirmed, this would require financial regulators to impose heavy risk weightings on loans to offshore wind farm operators, effectively making them too risky for pension funds and small investors.
The development of the GB grid was characterised by the close proximity of major sources and demand for electricity. Since wind farms tend to be sited far from centres of demand, transmission capacity can be inadequate to deliver electricity to users, particularly when wind speeds are high. When the grid cannot deliver electricity generated, wind farm operators are paid to switch off. It is normally necessary to pay another generator – normally a gas-fired power station – on the other side of the constraint to switch on as well, to ensure that demand is met. These two incentives are referred to as "constraint payments" or curtailment, and they are one source of criticism of the use of wind power and its implementation; in 2011 it was estimated that nearly £10million in constraint payments would be received, representing ten times the value of the potential lost electricity generation.Sources:
- Wind farm constraint payments have increased substantially year on year, £224million, out of a total of £409million in 2020–21. In addition, £582million was spent rebalancing the system afterwards, mainly to gas-fired power stations.
Backup and Frequency Response
There is some dispute over the necessary amount of reserve or backup required to support the large-scale use of wind and solar energy due to the variable nature of its supply. In a 2008 submission to the House of Lords Economic Affairs Committee, E.ON UK argued that it is necessary to have up to 80–90% backup. Other studies give a requirement of 15% to 22% of installed intermittent capacity. In June 2011, several energy companies including Centrica told the government that 17 gas-fired plants costing £10billion would be needed by 2020 to act as back-up generation for wind. However, as they would be standing idle for much of the time they would require "capacity payments" to make the investment economic, on top of the subsidies already paid for wind. In 20152016, National Grid contracted 10 coal and gas-fired plants to keep spare capacity on standby for all generation modes, at a cost of £122million, which represented 0.3% of an average electricity bill.
Grid scale battery storage is being developed in order to cope with the variability in wind and solar power. , 1.3GW of grid storage batteries was active, along with the traditional 2.5 GW of pumped storage at Dinorwig, Cruachan and Ffestiniog. How much capacity this represents is unclear as GWh values are not disclosed.
With the increase in proportion of energy being generated by wind and solar on the UK grid, there is a significant reduction in synchronous generation. Therefore, in order to ensure grid stability, the National grid ESO is piloting a range of demand side and supply side frequency response products.
Public opinion
Surveys of public attitudes across Europe and in many other countries show strong public support for wind power. About 80 per cent of EU citizens support wind power.
A 2003 survey of residents living around Scotland's 10 existing wind farms found high levels of community acceptance and strong support for wind power, with much support from those who lived closest to the wind farms. The results of this survey support those of an earlier Scottish Executive survey 'Public attitudes to the Environment in Scotland 2002', which found that the Scottish public would prefer the majority of their electricity to come from renewables and which rated wind power as the cleanest source of renewable energy. A survey conducted in 2005 showed that 74% of people in Scotland agree that wind farms are necessary to meet current and future energy needs. When people were asked the same question in a Scottish renewables study conducted in 2010, 78% agreed. The increase is significant as there were twice as many wind farms in 2010 as there were in 2005. The 2010 survey also showed that 52% disagreed with the statement that wind farms are "ugly and a blot on the landscape". 59% agreed that wind farms were necessary and that how they looked was unimportant. Scotland is planning to obtain 100% of electricity from renewable sources by 2020.
A British 2015 survey showed 68% support and 10% opposition to onshore wind farms.
In Spring 2025, the Department for Energy Security and Net Zero’s Public Attitudes Tracker reported 80% support for offshore wind and 73% support for onshore wind, with 5% opposing offshore wind and 8% opposing onshore wind.
Politics
In the UK, the Conservative government was previously opposed to further onshore wind turbines and cancelled subsidies for new onshore wind turbines from April 2016. The former prime minister David Cameron stated that "We will halt the spread of onshore wind farms", and claimed that "People are fed up with onshore wind" though polls of public opinion showed the converse. Leo Murray of Possible (formerly 10:10 Climate Action) said, "It looks increasingly absurd that the Conservatives have effectively banned Britain's cheapest source of new power." As the UK's Conservative government was opposed to onshore wind power it attempted to cancel existing subsidies for onshore wind turbines a year early from April 2016, although the House of Lords struck those changes down.
In 2015, they also introduced footnotes into the National Planning Policy Framework which introduced limitations on new onshore wind farm projects which were de-facto close to a total ban. This policy was repealed by the 2024 Labour government.
The wind power industry has claimed that the policy will increase electricity prices for consumers as onshore wind is one of the cheapest power technologies,
In 2020, the Boris Johnson-led government decided to permit onshore wind power, and since December 2021 onshore wind developers have been able to compete in subsidy auctions with solar power and offshore wind. On 24 September 2020, Boris Johnson reaffirmed his commitment to renewables, especially wind power and nuclear in the United Kingdom. He said that the UK can be the "Saudi Arabia of wind power", and that
Records
December 2014 was a record breaking month for UK wind power. A total of 3.90TWh of electricity was generated in the month – supplying 13.9% of the UK's electricity demand. On 19 October 2014, wind power supplied just under 20% of the UK's electrical energy that day. Additionally, as a result of eight of 16 nuclear reactors being offline for maintenance or repair, wind produced more energy than nuclear did that day. The week starting 16 December 2013, wind generated a record 783,886MWh – providing 13% of Britain's total electricity needs that week. And on 21 December, a record daily amount of electricity was produced with 132,812MWh generated, representing 17% of the nation's total electricity demand on that day.
In January 2018 metered wind power peaked at over 10GW and contributed up to a peak of 42% of the UK's total electricity supply. In March, maximum wind power generation reached 14GW, meaning nearly 37% of the nation's electricity was generated by wind power operating at over 70% capacity. On 5 December 2019, maximum wind power generation reached 15.6GW. At around 2am on 1 July 2019, wind power was producing 50.64% of the electricity supply, perhaps the first time that over half of the UK's electricity was produced by wind, while at 2:00 am on 8 February 2019, wind power was producing 56.05% of the electricity supply. Wind power first exceeded 16GW on 8 December 2019 during Storm Atiyah.
On Boxing Day 2020, a record 50.67% of energy used in the United Kingdom was generated by wind power. However, it was not the highest daily amount of energy ever generated by wind turbines; that came earlier in December 2020, when demand was higher than on Boxing Day and wind turbines supplied 40% of the energy required by the National Grid (17.3GW). However, on 26 August 2020, wind briefly contributed 59.9% of the grids electricity mix.
In 2022 a new record was set on 24 May with maximum wind power generation reaching 19.916GW. Then on 2 November wind generation reached 20.896 GW, providing 53% of Britain's electricity between 12:00pm and 12:30pm.
10 January 2023 saw 21.620 GW of generation, the first time over 21 GW had been produced by wind power in the UK.
The current record for wind power stands at 21.8 GW of generation, set on 21 December 2023.
Manufacturing
As of 2020, there were no major UK-based wind turbine manufacturers: most are headquartered in Denmark, Germany and the USA.
In 2014, Siemens announced plans to build facilities for offshore wind turbines in Kingston upon Hull, England, as Britain's wind power rapidly expands. The new plant was expected to begin producing turbine rotor blades in 2016. By 2019, blades were being shipped in large numbers. The plant and the associated service centre, in Green Port Hull nearby, will employ about 1,000 workers. The facilities will serve the UK market, where the electricity that major power producers generate from wind grew by about 38 per cent in 2013, representing about 6 per cent of total electricity, according to government figures. At the time there were plans to continue to increase Britain's wind-generating capacity, to 14GW by 2020. In fact, that figure was exceeded in late 2015.
On 16 October 2014, TAG Energy Solutions announced the mothballing and semi closure of its Haverton Hill construction base near Billingham with between 70 and 100 staff redundancies after failing to secure any subsequent work following the order for 16 steel foundations for the Humber Estuary in East Yorkshire.
In June 2016, Global Energy Group announced it had signed a contract in association with Siemens to fabricate and assemble turbines for the Beatrice Wind Farm, at its Nigg Energy Park site. It hopes in the future to become a centre for excellence and has opened a skills academy to help re-train previous offshore workers for green energy projects.
During 2021, £900M were invested in UK offshore wind power manufacturing. The UK offshore wind industry occupied 19,600 people directly in 2021, while thousands others worked in related businesses.
Specific regions
Wind power in Scotland
Main article: Wind power in Scotland
Wind power is Scotland's fastest growing renewable energy technology, with 5328 MW of installed capacity as of March 2015. This includes 5131 MWof onshore wind and 197MW of offshore wind.
Whitelee Wind Farm near Eaglesham, East Renfrewshire is the largest onshore wind farm in the United Kingdom with 215 Siemens and Alstom wind turbines and a total capacity of 539MW. Clyde Wind Farm near Abington, South Lanarkshire is the UK's second largest onshore wind farm comprising 152 turbines with a total installed capacity of 350MW. There are many other large onshore wind farms in Scotland, at various stages of development, including some that are in community ownership.
Robin Rigg Wind Farm in the Solway Firth is Scotland's only commercial-scale, operational offshore wind farm. Completed in 2010, the farm comprises 60 Vestas turbines with a total installed capacity of 180MW. Scotland is also home to two offshore wind demonstration projects: The two turbine, 10 MW Beatrice Demonstrator Project located in the Moray Firth, has led to construction of the 84 turbine, 588MW Beatrice Wind Farm set to begin in 2017 and the single turbine, 7MW Fife Energy Park Offshore Demonstration Wind Turbine in the Firth of Forth. There are also several other commercial-scale and demonstration projects in the planning stages.
The siting of turbines is often an issue, but multiple surveys have shown high local community acceptance for wind power in Scotland. There is further potential for expansion, especially offshore given the high average wind speeds, and a number of large offshore wind farms are planned.
The Scottish Government has achieved its target of generating 50% of Scotland's electricity from renewable energy by 2015, and is hoping to achieve 100% by 2020. Renewables produced 97.4% of Scotland's net electricity in 2020, mostly from wind power.
In July 2017 work commissioning an experimental floating wind farm known as Hywind at Peterhead began. The wind farm is expected to supply power to 20,000 homes. Manufactured by Statoil, the floating turbines can be located in water up to a kilometre deep. In its first two years of operation the facility with five floating wind turbines, giving a total installed capacity of 30MW, has averaged a capacity factor in excess of 50%
File:Whitelee with arran in the background.jpg|Whitelee Wind Farm with the Isle of Arran in the background File:Windfarm at Beattock, taken from the M74.jpg|Clyde Wind Farm File:Morning Energy - Ardrossan Wind Farm From Portencross - geograph.org.uk - 1088264.jpg|Ardrossan Wind Farm from Portencross, just after sunrise
References
--
References
- "UK Renewable Energy Roadmap Crown copyright, July 2011".
- Lu, Xi, Michael B. McElroy, and Juha Kiviluoma. 2009. "Global potential for wind-generated electricity". ''Proceedings of the National Academy of Sciences of the United States of America'' 106(27): 10933-10938.
- Frangoul, Anmar. (2023-10-09). "The world's largest offshore wind farm produces its first power".
- "UK Wind Energy Database (UKWED)". RenewableUK.
- "Wind power production for main countries". thewindpower.net.
- (2026-01-02). "Record year for wind and solar electricity in Great Britain in 2025".
- "UK ENERGY IN BRIEF 2023".
- (2022-11-16). "Onshore wind more popular with Conservative voters than MPs realise".
- (23 September 2024). "TGS 4C Offshore Global Market Overview Report".
- (19 April 2022). "Statement on the British Energy Security Strategy".
- "British Energy Security Strategy".
- Mark Stolworthy. "Operating Power Stations".
- "Global Offshore Map".
- Price, Trevor J.. (2004). "Blyth, James (1839–1906)".
- Marianna Dudley, 'Limits of Power: Wind Energy, Orkney and the Postwar British State', ''Modern British History''31:3 (2020), pp.316-339. https://doi.org/10.1093/tcbh/hwz024
- "Costa Head Experimental Wind Turbine". Orkney Sustainable Energy Ltd.
- Musgrove, Peter. (9 December 1976). "Windmills change direction". New Scientist.
- McKenna, John. (8 April 2009) [http://www.nce.co.uk/wind-power-chancellor-urged-to-use-budget-to-aid-ailing-developers/5200267.article New Civil Engineer – Wind power: Chancellor urged to use budget to aid ailing developers]. Nce.co.uk.
- Eccleston, Paul. (4 October 2007). "Britain's massive offshore wind power potential". The Daily Telegraph.
- [http://www.bwea.com/media/news/articles/pr20120106.html RenewableUK news article – Wind farms hit high of more than 12% of UK electricity demand] {{Webarchive. link. (22 January 2012. Bwea.com (6 January 2012).)
- "Contact with BWEA Admin".
- "[http://www.offshorewind.biz/2013/11/06/record-breaking-year-for-uk-offshore-wind/ Record-Breaking Year for UK Offshore Wind]" ''Offshorewind.biz'', 6 November 2013. Retrieved 6 November 2013.
- (4 July 2013). "London Array wind farm opened by Prime Minister". BBC News.
- "DECC Energy trends statistics section 6: renewables".
- Millard, Rachel. (13 December 2021). "Wind turbine expansion thrown into doubt". The Daily Telegraph.
- RenewableUK. "RenewableUK – RenewableUK News – Electricity needs of more than a quarter of UK homes powered by wind in 2014". renewableuk.com.
- (1 December 2016). "Hull's Siemens factory produces first batch of wind turbine blades". The Guardian.
- (10 May 2023). "Wind powers Britain more than gas for first time". Drax.
- RenewableUK. "RenewableUK – RenewableUK News – New-records-set-in-best-ever-year-for-British-wind-energy-generation". renewableuk.com.
- [https://www.theguardian.com/business/2016/nov/08/wind-turbines-uk-electricity-dong-energy Wind turbines 'could supply most of UK's electricity'] The Guardian 8 November 2016
- In 2022 three-quarters of the UK population supported further wind generated power in the UK and the majority would be happy for a wind farm to be built near them.[https://www.theguardian.com/environment/2022/apr/10/three-quarters-of-britons-back-expansion-of-wind-power-poll-reveals Three-quarters of Britons back expansion of wind power, poll reveals] ''[[The Guardian]]''
- (3 November 2022). "Wind power sets another generation record - reaching over 20 gigawatts for first time". RenewablesUK.
- (2023-01-11). "UK sets new record for wind generation thanks to blustery conditions". Financial Times.
- "Digest of UK energy statistics (DUKES)". decc.gov.uk.
- "Department of Energy and Climate Change".
- "DECC Energy Trends March 2014".
- (16 February 2015). "Wind in power – 2014 European statistics".
- (5 February 2016). "Wind in power – 2015 European statistics".
- "BEIS renewables statistics".
- "Wind power grows 45%".
- "BEIS renewables statistics".
- (21 February 2019). "Wind energy in Europe in 2018".
- (9 January 2020). "2019 saw the rise of wind power and the collapse of coal".
- "Digest of United Kingdom Energy Statistics, 2019". [[BEIS]].
- (31 March 2022). "Table 6.1. Renewable electricity capacity and generation".
- "Energy Trends: UK renewables".
- (2024-03-28). "Energy Trends: UK renewables".
- (2025-03-27). "Energy Trends: UK renewables".
- Jha, Alok. (21 October 2008). "UK overtakes Denmark as world's biggest offshore wind generator". The Guardian.
- (June 2008). "Will British weather provide reliable electricity?". Energy Policy.
- [http://www.bmreports.com/bsp/bsp_home.htm National Grid Table of Indicative Triad Demand Information showing 7 January 2010 peak] {{Webarchive. link. (18 January 2013. Bmreports.com.)
- MacKay, David. "Sustainable Energy – without the hot air".
- "Two Terawatts average power output: the UK offshore wind resource".
- [http://www.bwea.com/offshore/info.html RenewableUK – Offshore Wind Introduction] {{Webarchive. link. (29 July 2012. Bwea.com.)
- [http://www.repp.org/repp_pubs/articles/issuebr14/04Britan.htm REPP report into Non-Fossil Fuel subsidies in the UK] {{Webarchive. link. (25 September 2017. Repp.org (30 June 1998).)
- "The Crown Estate map of Operational Offshore energy – Round 1 wind farms in red".
- (February 2015). "Cost Reduction Monitoring Framework". ORE Catapult.
- [https://www.theguardian.com/environment/2017/sep/11/huge-boost-renewable-power-offshore-windfarm-costs-fall-record-low Huge boost for renewables as offshore windfarm costs fall to record low] ''[[The Guardian]]''
- [https://www.theguardian.com/environment/2018/feb/06/uk-built-half-of-europes-offshore-wind-power-in-2017 UK built half of Europe's offshore wind power in 2017] ''[[The Guardian]]''
- Ziady, Hanna. (6 October 2020). "All 30 million British homes could be powered by offshore wind in 2030". CNN.
- ScottishGovernment. "ScottishGovernment – News – Consent for offshore wind development". scotland.gov.uk.
- "About Triton Knoll – Triton Knoll".
- Ltd, Renews. (8 August 2022). "Triton Knoll owners request OFTO handover exemption".
- "Contracts for Difference (CfD) Allocation Round 3: results - published 20 September 2019, revised 11 October 2019".
- "Contracts for Difference (CfD) Allocation Round 4: results (accessible webpage)".
- Vaughan, Adam. (4 February 2020). "UK coal phase-out date pulled forward". Business Green.
- Ambrose, Jillian. (30 September 2024). "End of an era as Britain's last coal-fired power plant shuts down". The Guardian.
- Vaughan, Adam. (10 April 2018). "EDF warns of delays at Flamanville nuclear power station in France". The Guardian.
- Vaughan, Adam. (4 August 2015). "Public support for UK nuclear and shale gas falls to new low". The Guardian.
- (19 December 2019). "Queen's Speech: Government ramps up offshore wind target to 40GW".
- "Offshore wind".
- (16 February 2023). "UK's offshore wind pipeline close to 100GW mark, RenewableUK confirms".
- [http://www.scotland.gov.uk/Publications/2011/03/18141232/4 – Scottish Government Blue Seas – Green Energy Report] {{Webarchive. link. (24 January 2012. Scotland.gov.uk (18 March 2011).)
- [http://www.thecrownestate.co.uk/energy-and-infrastructure/offshore-wind-energy/working-with-us/leasing-rounds/scottish-territorial-waters-n-ireland/ Table of Scottish Offshore Zones, The Crown Estate] {{Webarchive. link. (9 November 2014. Thecrownestate.co.uk.)
- (13 November 2023). "Ministers downgrade Scottish offshore energy projection". BBC News.
- (19 December 2018). "Dorenell's 59 Turbines Delivered!".
- [http://www.delabole.com/windfarm.html Delabole Village website]. Delabole.com.
- (October 2023)
- [http://news.bbc.co.uk/1/hi/england/lancashire/7635159.stm article on opening of Scout Moor wind farm]. BBC News (25 September 2008).
- "Turley Associates Slieve Rushen Project website".
- [http://whiteleewindfarm.co.uk/about_windfarm Whitelee wind farm website] {{Webarchive. link. (16 September 2010 . Whiteleewindfarm.co.uk.)
- Department of Energy and Climate Change. (2010). "Digest of United Kingdom energy statistics (DUKES) 2010". Stationery Office.
- (2009). "Embedded and Renewable Generation". National Grid.
- [http://www.bwea.com/media/news/070302.html BWEA News – Decision makers must heed Stern warning on climate change]. Bwea.com (2 March 2007).
- Harvey, Fiona. (27 February 2012). "Has the wind revolution stalled in the UK?". The Guardian.
- Evans-Pritchard, Ambrose. (3 February 2018). "Britain abandons onshore wind just as new technology makes it cheap". The Daily Telegraph.
- [http://www.ofgem.gov.uk/Sustainability/Environment/RenewablObl/Pages/RenewablObl.aspx Renewables Obligation]. Ofgem.gov.uk.
- (December 2009). "Government Response to the 2009 Consultation on the Renewables Obligation". Department of Energy and Climate Change (DECC).
- (1 July 2015). "NIRO Banding Tables".
- [http://www.ofgem.gov.uk/Sustainability/Environment/RenewablObl/Documents1/Annual%20Report%202008-09.pdf Annual Report 2008-09]. (PDF).
- (December 2025). ["The Times – UK News, World News and Opinion"](https://www.timesonline.co.uk/tol/news/environment/article7078856.ece }}{{Dead link). [[The Times]].
- Renewables Obligation Annual Report 2019-20, Ofgem 2020. https://www.ofgem.gov.uk/system/files/docs/2021/03/ro_annual_report_2019-20_final_v1_0.pdf
- (4 September 2008). "Poverty fears over wind power". BBC News.
- "Changes to onshore wind subsidies protect investment and get the best deal for bill payers". gov.uk.
- (1 November 2016). "Contract for Difference in Great Britain: The offshore wind round?". Norton Rose Fulbright.
- "Actual CfD Generation and avoided GHG emissions". Low Carbon Contracts Company.
- (11 October 2022). "British low-carbon generators face de facto windfall tax". Financial Times.
- Bell, Adam. "Opinion: Welcome to Schrodinger's windfall tax on renewables in the UK".
- "Wind Power Economics, Rhetoric & Reality, Vol. 1: Wind Power Costs in the United Kingdom".
- (May 2019). "Better estimates of LCOE from audited accounts – A new methodology with examples from United Kingdom offshore wind and CCGT". Energy Policy.
- (May 2011). "Costs of low-carbon generation technologies". [[Committee on Climate Change]].
- "Moray Offshore Windfarm (East) Phase 1".
- "Dogger Bank A P1".
- "Sneddon Law Community Wind Farm".
- (2 March 2015). "British public thinks wind power subsidies are 14 times higher than reality". [[The Guardian]].
- Evans-Pritchard, Ambrose. (20 September 2019). "Rejoice: Britain's huge gamble on offshore wind has hit the jackpot". The Daily Telegraph.
- "Clean energy to power over seven million homes by 2025 at record low prices".
- "What is a Contract for Difference and why do we need it?".
- "Drax Electric Insights".
- (November 2016). "ELECTRICITY GENERATION COSTS". BEIS.
- (7 July 2022). "Almost 11GW of capacity secured in biggest CfD auction ever".
- Hughes, Gordon. (2020). "Wind Power Costs in the United Kingdom". Renewable Energy Foundation.
- Graham Sinden. (1 December 2005). "Characteristics of the UK wind resource: Long-term patterns and relationship to electricity demand". Energy Policy.
- Mason, Rowena. (11 January 2010). "Wind farms produced 'practically no electricity' during Britain's cold snap". The Daily Telegraph.
- [http://www.claverton-energy.com/wind-energy-variability-new-reports.html Wind Energy Variability and Intermittency in the UK]. Claverton-energy.com (28 August 2009).
- David Dixon, Nuclear Engineer. (9 August 2006). "Wind Generation's Performance during the July 2006 California Heat Storm". US DOE, Oakland Operations.
- Graham Sinden. (1 December 2005). "Characteristics of the UK wind resource: Long-term patterns and relationship to electricity demand". Energy Policy.
- (2005). "Variability of Wind Power and other Renewables: Management Options and Strategies". IEA.
- Diesendorf, Mark. (2007). "Greenhouse Solutions with Sustainable Energy".
- (8 October 2021). "Where does Britain get its gas from and why does Russia matter?".
- (16 September 2021). "What you need to know about energy prices". MSN.
- (13 September 2021). "Energy Prices in Europe Hit Records After Wind Stops Blowing". [[The Wall Street Journal]].
- "Transmission Constraint Agreement". nationalgrid.com.
- (13 June 2022). "Current± Price Watch: Surging wind pushes power prices negative".
- "National Grid Monthly Balancing Services Summary (MBSS) Mar-2021".
- (June 2008). "Requirement for thermal generation to back-up wind capacity". House of Lords.
- Harrabin, Roger. (24 June 2009). "UK expands wind power potential". BBC News.
- [http://www.energyefficiencynews.com/policy/i/2193/ National Grid report says it can handle variable wind power. Policy] {{Webarchive. link. (5 October 2011. ''Energy Efficiency News'' (22 June 2009).)
- Andrew Ward. (14 October 2016). "UK falls back on fossil fuels to secure winter energy supply". Financial Times.
- (14 July 2020). "Battery storage boost to power greener electricity grid". Department for Business, Energy & Industrial Strategy.
- McCorkindale, Mollie. (19 May 2021). "Top ten UK battery storage projects forecast for 2021 completion".
- "Frequency response services {{!}} National Grid ESO".
- "Wind Energy and the Environment".
- (28 February 2008). "Public attitudes to wind farms". Eon-uk.com.
- "The Social Acceptance of Wind Energy". European Commission.
- Simon Braunholtz. (21 August 2003). "Public Attitudes to Windfarms". Scottish Executive Social Research.
- "Wind farms make good neighbours".
- (19 October 2010). "Rise in Scots wind farm support". BBC News.
- (7 March 2012). "An investigation into the potential barriers facing the development of offshore wind energy in Scotland".
- "Wind energy continues to blow away records". eaem.co.uk.
- (22 June 2015). "Onshore wind farms cancelled as subsidies cut". BBC News.
- Randall Hackley. (14 April 2015). "Cameron's U.K. Conservatives Oppose Onshore Wind Farms". Bloomberg.com.
- (16 December 2014). "David Cameron says people are 'fed up' with onshore wind farms". BBC News.
- [https://www.theguardian.com/environment/2017/jul/23/drop-in-wind-energy-costs-adds-pressure-for-government-rethink Drop in wind energy costs adds pressure for government rethink] ''[[The Guardian]]''
- (16 January 2016). "Tories face fight with Lords over onshore windfarm subsidies". [[The Guardian]].
- (2024-07-08). "Labour lifts Tories' 'absurd' ban on onshore windfarms". The Guardian.
- (23 June 2015). "Amber Rudd: 250 onshore wind farm projects 'unlikely' to be built". businessgreen.com.
- Ambrose, Jillian. (16 March 2020). "Planning applications for UK clean energy projects hit new high". The Guardian.
- (13 December 2021). "Press release – Biggest ever renewable energy support scheme opens". [[HM Government]], [[Department for Business, Energy & Industrial Strategy]].
- (24 September 2020). "UK can be 'Saudi Arabia of wind power' – PM". Ethical Editor.
- (24 September 2020). "UK can be 'Saudi Arabia of wind power' – PM". BBC News.
- "[http://energynumbers.info/wind-records-britain Wind records in Britain]" ''Energy Numbers'', 1 January 2015.
- (20 October 2014). "Record-setting Sunday: Wind supplies a quarter of UK power". edie.net.
- (22 October 2014). "Wind farms outstrip nuclear power". BBC News.
- RenewableUK. "RenewableUK – Press Releases – Record Breaking month for wind energy". renewableuk.com.
- (17 January 2018). "Record-breaker: British wind power output tops 10GW".
- (17 March 2018). "UK sets new wind power record".
- (21 December 2018). "Drax Electric Insights".
- "Drax Electric Insights".
- "Electric Insights {{!}} Demand & price, Environment, Supply".
- "Drax Electric Insights".
- (28 December 2020). "Storm Bella helps Great Britain set new record for wind power generation". The Guardian.
- (29 December 2020). "Weather warning with more snow forecast". The Yorkshire Post.
- "Record-breaking 2020 becomes greenest year for Britain's electricity {{pipe".
- (8 June 2022). "Great Britain's monthly electricity stats". National Grid ESO.
- (2022-11-04). "UK wind power generation reaches over 20 GW for first time".
- "The Wind Record Has Been Broken Again!". National Grid UK.
- Kollewe, Julia. (2023-12-21). "Wind turbines generate more than half of UK's electricity due to Storm Pia". The Guardian.
- (15 February 2019). "500 wind turbine blades lined up in Hull as huge windfarm generates first power".
- Stanley Reedmarch. (25 March 2014). "Siemens to Invest $264 Million in British Wind Turbine Project". The New York Times.
- (16 October 2014). "100 jobs lost as wind farm factory is mothballed".
- "Major boost to far north economy as Nigg is awarded Beatrice contract – and Helmsdale may benefit too".
- (29 September 2021). "Record year sees more than £900M invested in UK offshore wind manufacturing".
- (13 June 2022). "UK Offshore Wind Sector Expected to Employ Almost 100,000 People by 2030".
- "Energy Trends: renewables – GOV.UK".
- "Whitelee Wind Farm website".
- "Clyde".
- "Robin Rigg East and West – Offshore – E.ON".
- (8 December 2009). "Current Marine Renewable Energy Projects". Scottish Government.
- (18 October 2010). "Rise in Scots wind farm support". BBC News.
- Scottish Government. (2003). "Public Attitudes to Windfarms: A Survey of Local Residents in Scotland".
- Scottish Renewables. (22 October 2010). "Scots support wind farms". Sustainable Scotland.
- (25 March 2021). "Renewables met 97% of Scotland's electricity demand in 2020". BBC News.
- Harrabin, Roger. (23 July 2017). "World's first floating wind farm emerges off coast of Scotland". BBC News.
- "Equinor and ORE Catapult collaborating to share Hywind Scotland operational data".
- "BWEA report on onshore wind costs".
- Committee on Climate Change (May 2011) [http://hmccc.s3.amazonaws.com/Renewables%20Review/MML%20final%20report%20for%20CCC%209%20may%202011.pdf Costs of low-carbon generation technologies]. {{webarchive. link. (17 August 2011)
- "The Merit-Order Effect: A Detailed Analysis of the Price Effect of Renewable Electricity Generation on Spot Market Prices in Germany".
- (2013). "30 Years of Policies for Wind Energy: Lessons from United Kingdom". International Renewable Energy Agency; Global Wind Energy Council.
- (3 July 2025). "DESNZ Public Attitudes Tracker: Renewable energy, Spring 2025, UK". Department for Energy Security and Net Zero.
This article was imported from Wikipedia and is available under the Creative Commons Attribution-ShareAlike 4.0 License. Content has been adapted to SurfDoc format. Original contributors can be found on the article history page.
Ask Mako anything about Wind power in the United Kingdom — get instant answers, deeper analysis, and related topics.
Research with MakoFree with your Surf account
Create a free account to save articles, ask Mako questions, and organize your research.
Sign up freeThis content may have been generated or modified by AI. CloudSurf Software LLC is not responsible for the accuracy, completeness, or reliability of AI-generated content. Always verify important information from primary sources.
Report