From Surf Wiki (app.surf) — the open knowledge base
Reference ranges for blood tests
Common human medical data ranges for blood test results

Common human medical data ranges for blood test results
Reference ranges (reference intervals) for blood tests are sets of values used by a health professional to interpret a set of medical test results from blood samples. Reference ranges for blood tests are studied within the field of clinical chemistry (also known as "clinical biochemistry", "chemical pathology" or "pure blood chemistry"), the area of pathology that is generally concerned with analysis of bodily fluids.
Blood test results should always be interpreted using the reference range provided by the laboratory that performed the test.
Interpretation
A reference range is usually defined as the set of values 95 percent of the normal population falls within (that is, 95% prediction interval). It is determined by collecting data from vast numbers of laboratory tests.
Plasma or whole blood
In this article, all values (except the ones listed below) denote blood plasma concentration, which is approximately 60–100% larger than the actual blood concentration if the amount inside red blood cells (RBCs) is negligible. The precise factor depends on hematocrit as well as amount inside RBCs. Exceptions are mainly those values that denote total blood concentration, and in this article they are:
- All values in Hematology – red blood cells (except hemoglobin in plasma)
- All values in Hematology – white blood cells
- Platelet count (Plt) A few values are for inside red blood cells only:
- Vitamin B9 (folic acid/folate) in red blood cells
- Mean corpuscular hemoglobin concentration (MCHC)
Units
- Mass concentration (g/dL or g/L) is the most common measurement unit in the United States. Is usually given with dL (decilitres) as the denominator in the United States, and usually with L (litres) in, for example, Sweden.
- Molar concentration (mol/L) is used to a higher degree in most of the rest of the world, including the United Kingdom and other parts of Europe and Australia and New Zealand.
- International units (IU) are based on measured biological activity or effect, or for some substances, a specified equivalent mass.
- Enzyme activity (kat) is commonly used for e.g. liver function tests like AST, ALT, LD and γ-GT in Sweden.
- Percentages and time-dependent units (mol/s) are used for calculated derived parameters, e.g. for beta cell function in homeostasis model assessment or thyroid's secretory capacity.
Arterial or venous
If not otherwise specified, a reference range for a blood test is generally the venous range, as the standard process of obtaining a sample is by venipuncture. An exception is for acid–base and blood gases, which are generally given for arterial blood.
Still, the blood values are approximately equal between the arterial and venous sides for most substances, with the exception of acid–base, blood gases and drugs (used in therapeutic drug monitoring (TDM) assays). Arterial levels for drugs are generally higher than venous levels because of extraction while passing through tissues.
Usual or optimal
Reference ranges are usually given as what are the usual (or normal) values found in the population, more specifically the prediction interval that 95% of the population fall into. This may also be called standard range. In contrast, optimal (health) range or therapeutic target is a reference range or limit that is based on concentrations or levels that are associated with optimal health or minimal risk of related complications and diseases. For most substances presented, the optimal levels are the ones normally found in the population as well. More specifically, optimal levels are generally close to a central tendency of the values found in the population. However, usual and optimal levels may differ substantially, most notably among vitamins and blood lipids, so these tables give limits on both standard and optimal (or target) ranges. In addition, some values, including troponin I and brain natriuretic peptide, are given as the estimated appropriate cutoffs to distinguish healthy people from people with specific conditions, which here are myocardial infarction and congestive heart failure, respectively, for the aforementioned substances.
Variability
References range may vary with age, sex, race, pregnancy, diet, use of prescribed or herbal drugs and stress. Reference ranges often depend on the analytical method used, for reasons such as inaccuracy, lack of standardisation, lack of certified reference material and differing antibody reactivity. Also, reference ranges may be inaccurate when the reference groups used to establish the ranges are small.
Sorted by concentration
By mass and molarity
Smaller, narrower boxes indicate a more tight homeostatic regulation when measured as standard "usual" reference range.
Hormones predominate at the left part of the scale, shown with a red at ng/L or pmol/L, being in very low concentration. There appears to be the greatest cluster of substances in the yellow part (μg/L or nmol/L), becoming sparser in the green part (mg/L or μmol/L). However, there is another cluster containing many metabolic substances like cholesterol and glucose at the limit with the blue part (g/L or mmol/L).
The unit conversions of substance concentrations from the molar to the mass concentration scale above are made as follows:
- Numerically: :\text{molar concentration} \times \text{molar mass} = \text{mass concentration}
- Measured directly in distance on the scales: :\log_{10} \frac{\text{molar mass}}{1000} = \text{distance to right (decades)} , where distance is the direct (not logarithmic) distance in number of decades or "octaves" to the right the mass concentration is found. To translate from mass to molar concentration, the dividend (molar mass and the divisor (1000) in the division change places, or, alternatively, distance to right is changed to distance to left. Substances with a molar mass around 1000g/mol (e.g. thyroxine) are almost vertically aligned in the mass and molar images. Adrenocorticotropic hormone, on the other hand, with a molar mass of 4540, is 0.7 decades to the right in the mass image. Substances with molar mass below 1000g/mol (e.g. electrolytes and metabolites) would have "negative" distance, that is, masses deviating to the left. Many substances given in mass concentration are not given in molar amount because they haven't been added to the article.
The diagram above can also be used as an alternative way to convert any substance concentration (not only the normal or optimal ones) from molar to mass units and vice versa for those substances appearing in both scales, by measuring how much they are horizontally displaced from one another (representing the molar mass for that substance), and using the same distance from the concentration to be converted to determine the equivalent concentration in terms of the other unit. For example, on a certain monitor, the horizontal distance between the upper limits for parathyroid hormone in pmol/L and pg/mL may be 7 cm, with the mass concentration to the right. A molar concentration of, for example, 5 pmol/L would therefore correspond to a mass concentration located 7 cm to the right in the mass diagram, that is, approximately 45 pg/mL.
By units
Units do not necessarily imply anything about molarity or mass.
A few substances are below this main interval, e.g. thyroid stimulating hormone, being measured in mU/L, or above, like rheumatoid factor and CA19-9, being measured in U/mL.
By enzyme activity

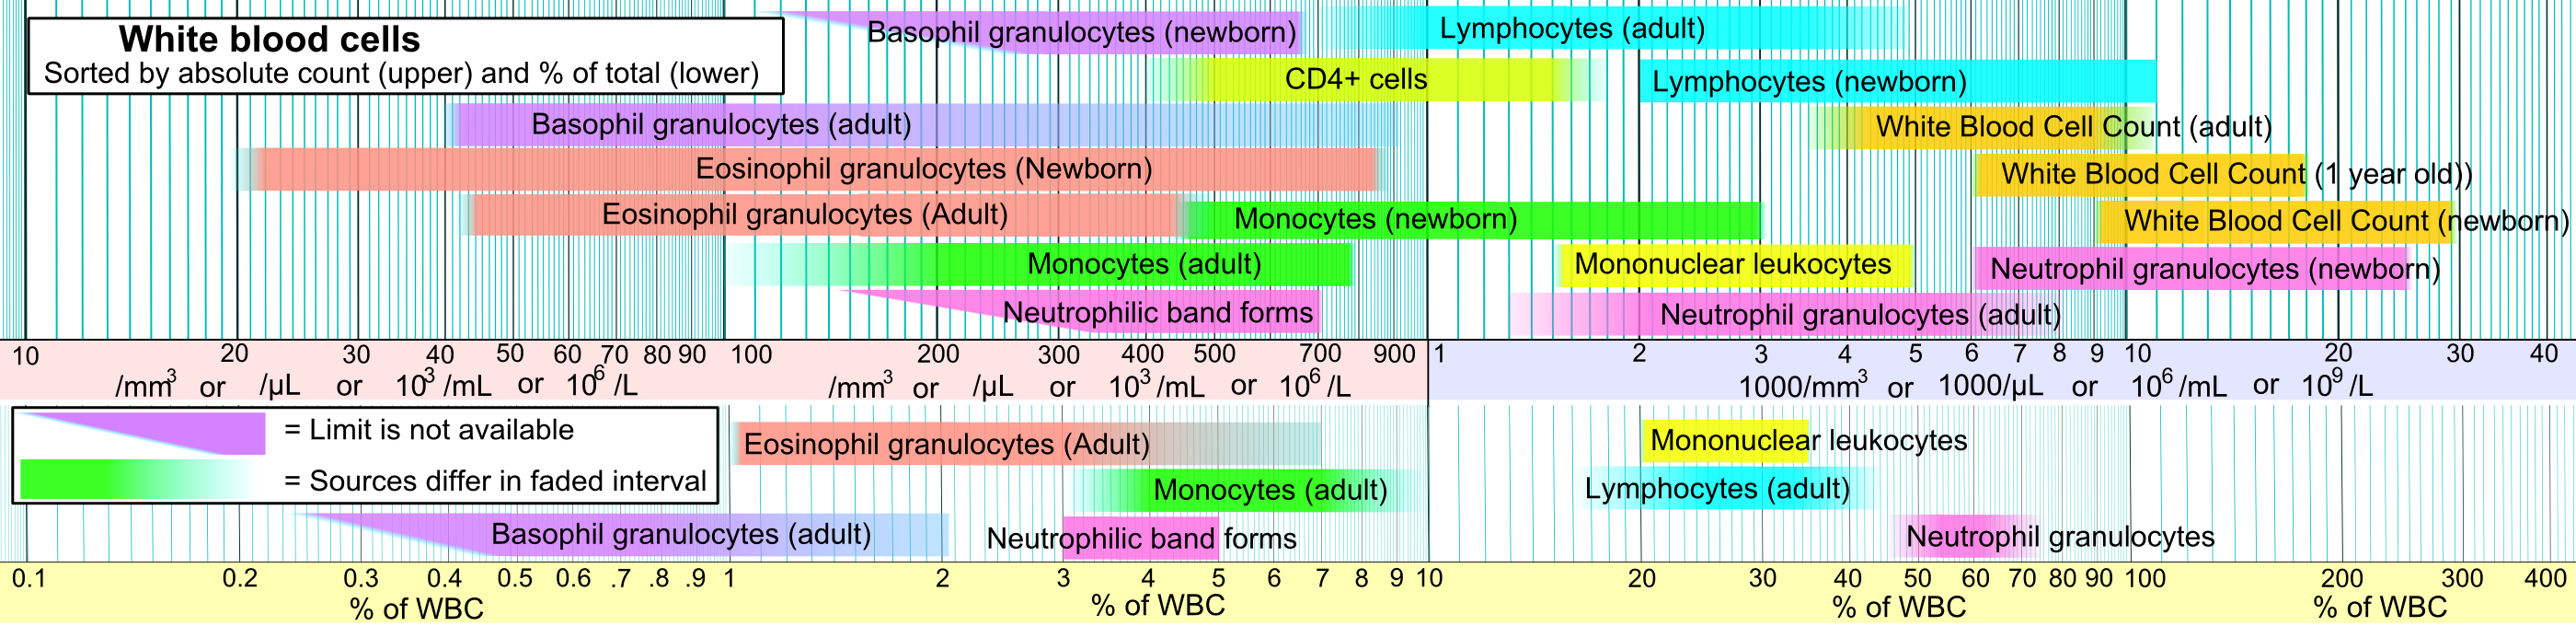
White blood cells
Sorted by category
Ions and trace metals
Included here are also related binding proteins, like ferritin and transferrin for iron, and ceruloplasmin for copper.
| Test | Lower limit | Upper limit | Unit* | Comments | |||||||||||
|---|---|---|---|---|---|---|---|---|---|---|---|---|---|---|---|
| Sodium Sodium (Na) | 135, 137 | 145, 147 | mmol/L or mEq/L | See hyponatremia or hypernatremia | |||||||||||
| 310, 320 | 330, 340 | mg/dL | |||||||||||||
| Potassium Potassium (K) | 3.5, 3.6 | 5.0, 5.1 | mmol/L or mEq/L | See hypokalemia or hyperkalemia | |||||||||||
| 14 | 20 | mg/dL | |||||||||||||
| Chloride Chloride (Cl) | 95, 98, 100 | 105, 106, 110 | mmol/L or mEq/L | See hypochloremia or hyperchloremia | |||||||||||
| 340 | 370 | mg/dL | |||||||||||||
| Calcium Ionized calcium (Ca) | vauthors=Larsson L, Ohman S | title=Serum ionized calcium and corrected total calcium in borderline hyperparathyroidism | journal=Clin. Chem. | volume=24 | issue=11 | pages=1962–65 | date=November 1978 | pmid=709830 | doi= 10.1093/clinchem/24.11.1962 | url=http://www.clinchem.org/cgi/pmidlookup?view=long&pmid=709830 | doi-access=free | url-access=subscription }} 1.10 | 1.23, 1.30 | mmol/L | See hypocalcaemia or hypercalcaemia |
| 4.1, 4.4 | 4.9, 5.2 | mg/dL | |||||||||||||
| Total calcium (Ca) | 2.1, 2.2 | 2.5, 2.6, 2.8 | mmol/L | ||||||||||||
| 8.4, 8.5 | 10.2, 10.5 | mg/dL | |||||||||||||
| Iron Total serum iron (TSI) – male | author=Slon S | title=Serum Iron | url=http://uimc.discoveryhospital.com/main.php?t=enc&id=1456 | date=2006-09-22 | publisher=University of Illinois Medical Center | access-date=2006-07-06 | archive-url=https://web.archive.org/web/20061028111833/http://uimc.discoveryhospital.com/main.php?t=enc&id=1456 | archive-date=2006-10-28 }} 76 | 176, 198 | μg/dL | See hypoferremia or the following: iron overload (hemochromatosis), iron poisoning, siderosis, hemosiderosis, hyperferremia | ||||
| url=https://web.archive.org/web/20090106161044/http://www.dclmexico.com/ingles/hierro_sl.pdf | date=2009-01-06 }} July 15, 2005 13.6 | 30, 32, 35 | μmol/L | ||||||||||||
| Total serum iron (TSI) – female | 26, 50 | 170 | μg/dL | ||||||||||||
| 4.6, 8.9 | 30.4 | μmol/L | |||||||||||||
| Total serum iron (TSI) – newborns | 100 | 250 | μg/dL | ||||||||||||
| 18 | 45 | μmol/L | |||||||||||||
| Total serum iron (TSI) – children | 50 | 120 | μg/dL | ||||||||||||
| 9 | 21 | μmol/L | |||||||||||||
| Total iron-binding capacity (TIBC) | 240, 262 | 450, 474 | μg/dL | ||||||||||||
| 43, 47 | 81, 85 | μmol/L | |||||||||||||
| Transferrin Transferrin | 190, 194, 204 | 326, 330, 360 | mg/dL | ||||||||||||
| 25 | 45 | μmol/L | |||||||||||||
| Transferrin saturation | 20 | 50 | % | ||||||||||||
| Ferritin Ferritin – Males and postmenopausal females | 12 | url=http://emedicine.medscape.com/article/177216-workup#c8 | title=Hemochromatosis Workup | author=Andrea Duchini | website=Medscape | access-date=2016-07-14}} Updated: Jan 02, 2016 | ng/mL or μg/L | ||||||||
| 27 | 670 | pmol/L | |||||||||||||
| Ferritin – premenopausal females | 12 | 150 – 200 | ng/mL or μg/L | ||||||||||||
| 27 | 330 – 440 | pmol/L | |||||||||||||
| Ammonia Ammonia | vauthors=Mitchell ML, Filippone MD, Wozniak TF | title=Metastatic carcinomatous cirrhosis and hepatic hemosiderosis in a patient heterozygous for the H63D genotype | journal=Arch. Pathol. Lab. Med. | volume=125 | issue=8 | pages=1084–87 | date=August 2001 | pmid=11473464 | doi= 10.5858/2001-125-1084-MCCAHH | url=http://journals.allenpress.com/jrnlserv/?request=get-abstract&issn=0003-9985&volume=125&page=1084 | url-access=subscription }} 20 | 35, 65 | μmol/L | See hypoammonemia and hyperammonemia | |
| 17, 34 | 60, 110 | μg/dL | |||||||||||||
| Copper Copper (Cu) | 70 | 150 | μg/dL | See hypocupremia or hypercupremia | |||||||||||
| 1040580630 | Reference range for copper}} | 24 | μmol/L | ||||||||||||
| Ceruloplasmin Ceruloplasmin | 15 | 60 | mg/dL | ||||||||||||
| 1 | 4 | μmol/L | |||||||||||||
| Phosphate Phosphate (HPO42−) | 0.8 | author=Walter F. Boron | title=Medical Physiology: A Cellular And Molecular Approach | publisher=Elsevier/Saunders | year= 2005 | isbn=978-1-4160-2328-9 | page=849}} | mmol/L | See hypophosphatemia or hyperphosphatemia | ||||||
| Inorganic phosphorus (serum) | 1.0 | 1.5 | mmol/L | ||||||||||||
| 3.0 | 4.5 | mg/dL | |||||||||||||
| Zinc Zinc (Zn) | url=http://www.dlolab.com/PDFs/DLO-OCTOBER-2008-LAB-UPDATE.pdf | title=Archived copy | access-date=2010-01-17 | archive-url=https://web.archive.org/web/20100307231954/http://www.dlolab.com/PDFs/DLO-OCTOBER-2008-LAB-UPDATE.pdf | archive-date=2010-03-07 }} 72 | 110, 130 | μg/dL | See zinc deficiency or zinc poisoning | |||||||
| 9.2, 11 | 17, 20 | μmol/L | |||||||||||||
| Magnesium Magnesium | 1.5, | 2.0, 2.3 | mEq/L or mg/dL | See hypomagnesemia or hypermagnesemia | |||||||||||
| 0.6, 0.7 | 0.82, 0.95 | mmol/L |
- Note: Although 'mEq' for mass and 'mEq/L' are sometimes used in the United States and elsewhere, they are not part of SI and are now considered redundant.
Acid–base and blood gases
If arterial/venous is not specified for an acid–base or blood gas value, then it generally refers to arterial, and not venous which otherwise is standard for other blood tests.
Acid–base and blood gases are among the few blood constituents that exhibit substantial difference between arterial and venous values.
| Test | Arterial/Venous | Lower limit | Upper limit | Unit | |
|---|---|---|---|---|---|
| pH | Arterial | 7.34, 7.35 | 7.44, 7.45 | ||
| Venous | 7.31 | 7.41 | |||
| [H+] | Arterial | 36 | 44 | nmol/L | |
| 3.6 | 4.4 | ng/dL | |||
| Base excess | Arterial & venous | −3 | +3 | mEq/L | |
| Oxygen partial pressure (pO2) | Arterial pO2 | 10, 11 | 13, 14 | kPa | |
| 75, 83 | 100, 105 | mmHg or torr | |||
| Venous | 4.0 | 5.3 | kPa | ||
| 30 | 40 | mmHg or torr | |||
| Oxygen saturation | Arterial | 94, 96 | 100 | % | |
| Venous | Approximately 75 | ||||
| Carbon dioxide partial pressure (pCO2) | Arterial PaCO2 | 4.4, | 5.9, 6.0 | kPa | |
| 33, 35 | 44, 45 | mmHg or torr | |||
| Venous | 5.5, | 6.8 | kPa | ||
| 41 | 51 | mmHg or torr | |||
| Absolute content of carbon dioxide (CO2) | Arterial | 23 | 30 | mmol/L | |
| 100 | 132 | mg/dL | |||
| Bicarbonate (HCO3−) | Arterial & venous | url=https://web.archive.org/web/20121102092931/http://www.bloodbook.com/ranges.html | date=2012-11-02 }} Bloodbook.Com | 23 | mmol/L |
| 110 | 140 | mg/dL | |||
| Standard bicarbonate (SBCe) | Arterial & venous | 21, 22 | 27, 28 | mmol/L or mEq/L | |
| 134 | 170 | mg/dL |
Liver function
| Test | Patient type | Lower limit | Upper limit | Unit | Comments | ||||||||
|---|---|---|---|---|---|---|---|---|---|---|---|---|---|
| Total protein (TotPro) | 60, 63 | 78, 82, 84 | g/L | See serum total protein Interpretation | |||||||||
| Albumin | 288686147 | Reference range (albumin)}} | 48, 55 | g/L | See hypoalbuminemia | ||||||||
| 3.5 | 4.8, 5.5 | U/L | |||||||||||
| 540 | 740 | μmol/L | |||||||||||
| Globulins | 23 | 35 | g/L | ||||||||||
| Bilirubin reference ranges Total bilirubin | 1.7, 2, 3.4, 5 | 17, 22, 25 | μmol/L | ||||||||||
| 0.1, 0.2, 0.29 | 1.0, | mg/dL | |||||||||||
| Direct/conjugated bilirubin | 0.0 or N/A | 5, 7 | μmol/L | ||||||||||
| 0 | 0.3, 0.4 | mg/dL | |||||||||||
| Alanine transaminase (ALT/ALAT) | author1=Deepak A. Rao | author2=Le, Tao | author3=Bhushan, Vikas | title=First Aid for the USMLE Step 1 2008 (First Aid for the Usmle Step 1) | publisher=McGraw-Hill Medical | year=2007 | isbn=978-0-07-149868-5 | url-access=registration | url=https://archive.org/details/firstaidforusmle00taol }} | 20, 21, 56 | U/L | Also called *serum glutamic pyruvic transaminase* (SGPT) | |
| Female | 0.15 | 0.75 | μkat/L | ||||||||||
| Male | 0.15 | 1.1 | |||||||||||
| Aspartate transaminase (AST/ASAT) | Female | url=https://web.archive.org/web/20170107125542/http://www.gpnotebook.co.uk/simplepage.cfm?ID=322240579 | date=2017-01-07 }} Retrieved on Dec 7, 2009 | 34 | IU/L | Also called | |||||||
| *serum glutamic oxaloacetic transaminase* (SGOT) | |||||||||||||
| 0.25 | 0.60 | μkat/L | |||||||||||
| Male | 8 | 40 | IU/L | ||||||||||
| 0.25 | 0.75 | μkat/L | |||||||||||
| Alkaline phosphatase (ALP) | 0.6 | 1.8 | μkat/L | ||||||||||
| Female | 978-3-437-15120-0}}. Length: 1288 pages | 98 | U/L | ||||||||||
| Male | 53 | 128 | |||||||||||
| Gamma glutamyl transferase (GGT) | 5, 8 | 40, 78 | U/L | ||||||||||
| Female | url=http://www.mdi-labor.de/l_leistungsverzeichnis_detail.php?u_id=663&init=letter | title=Gamma-GT | work=Leistungsverzeichnis | date=5 November 2009 | publisher=Medizinisch-Diagnostische Institute | access-date=20 November 2011 | archive-url=https://web.archive.org/web/20120425233448/http://www.mdi-labor.de/l_leistungsverzeichnis_detail.php?u_id=663&init=letter | archive-date=25 April 2012 }} | μkat/L | ||||
| Male | 0.92 | μkat/L |
Cardiac tests
| Test | Patient type | Lower limit | Upper limit | Unit | Comments | ||||
|---|---|---|---|---|---|---|---|---|---|
| Creatine kinase (CK) | Male | 1436155929 | Creatine kinase}} 38, 60 | 174, 320 | U/L or ng/mL | ||||
| author=Lee, Mary Ann | title=Basic Skills in Interpreting Laboratory Data | publisher=Amer Soc of Health System | year=2009 | isbn=978-1-58528-180-0 }} | 1.5 | μkat/L | |||
| Female | 24, 38, 96 | 140, 200 | U/L or ng/mL | ||||||
| 0.17 | 1.17 | μkat/L | |||||||
| CK-MB | 0 | 3, 3.8, 5 | ng/mL or μg/L | ||||||
| Myoglobin | Female | 1 | 66 | ng/mL or μg/L | |||||
| Male | 17 | 106 | |||||||
| Cardiac troponin T (low sensitive) | author=Ashvarya Mangla | title=Troponins | url=http://emedicine.medscape.com/article/2073935-overview | access-date=2017-07-24 | website=medscape}} Updated: Jan 14, 2015 | ng/mL | 99th percentile cutoff | ||
| Cardiac troponin I | 0.03 | ng/mL | 99th percentile cutoff | ||||||
| Cardiac troponin T (high sensitive) | Male | 0.022 | ng/mL | 99th percentile cutoff | |||||
| Female | 0.014 | ng/mL | 99th percentile cutoff | ||||||
| newborn/infants | not established | more than adults |
| Interpretation | Range / Cutoff |
|---|---|
| Congestive heart failure unlikely | |
| "Gray zone" | 100–500 pg/mL |
| [Congestive heart failure likely | [](more-than) 500 pg/mL |
| Interpretation | Age | Cutoff |
|---|---|---|
| Congestive heart failure likely | [ 125 pg/mL | |
| 75 years | 450pg/mL |
Lipids
| Test | Patient type | Lower limit | Upper limit | Unit | Therapeutic target | ||||
|---|---|---|---|---|---|---|---|---|---|
| Triglycerides | 10–39 years | 54 | 110 | mg/dL | |||||
| 0.61 | 1.2 | mmol/L | |||||||
| 40–59 years | 70 | 150 | mg/dL | ||||||
| 0.77 | 1.7 | mmol/L | |||||||
| 60 years | 80 | 150 | mg/dL | ||||||
| 0.9 | 1.7 | mmol/L | |||||||
| Total cholesterol | 3.0, 3.6 | -214630397 | Reference range (cholesterol)}} 6.5 | mmol/L | |||||
| 120, 140 | 200, 250 | mg/dL | |||||||
| HDL cholesterol | Female | 1.0, 1.2, 1.3 | 2.2 | mmol/L | 1.0 mg/dL | ||||
| url=http://www.labtestsonline.org/understanding/analytes/hdl/test.html | title=HDL Cholesterol: The Test | date=September 3, 2001 | archive-url=https://web.archive.org/web/20010903133121/http://www.labtestsonline.org/understanding/analytes/hdl/test.html | archive-date=2001-09-03}} | 86 | mg/dL | |||
| HDL cholesterol | Male | 0.9 | 2.0 | mmol/L | |||||
| 35 | 80 | mg/dL | |||||||
| LDL cholesterol | |||||||||
| (Not valid when | |||||||||
| triglycerides 5.0 mmol/L) | 2.0, 2.4 | 3.0, 3.4 | mmol/L | ||||||
| 80, 94 | 120, 130 | mg/dL | |||||||
| LDL/HDL quotient | n/a | 5 | (unitless) |
Tumour markers
| Test | Patient type | Cutoff | Unit | Comments | |||||||||||||
|---|---|---|---|---|---|---|---|---|---|---|---|---|---|---|---|---|---|
| Alpha fetoprotein (AFP) | 44 | ng/mL or μg/L | Hepatocellular carcinoma or testicular cancer | ||||||||||||||
| Beta human chorionic gonadotrophin (β-hCG) | In males and non-pregnant females | 5 | IU/L or mU/mL | choriocarcinoma | |||||||||||||
| CA19-9 | 40 | U/mL | Pancreatic cancer | ||||||||||||||
| CA-125 | url=https://web.archive.org/web/20120626000109/http://www.clinlabnavigator.com/Test-Interpretations/ca-125.html | date=2012-06-26 }} Retrieved on March 8, 2011 | kU/L or U/mL | ||||||||||||||
| Carcinoembryonic antigen (CEA) | Non-smokers, 50 years | vauthors=Bjerner J, Høgetveit A, Wold Akselberg K, etal | s2cid=12545738 | title=Reference intervals for carcinoembryonic antigen (CEA), CA125, MUC1, Alfa-foeto-protein (AFP), neuron-specific enolase (NSE) and CA19.9 from the NORIP study | journal=Scandinavian Journal of Clinical and Laboratory Investigation | volume= 68 | issue= 8 | pages=703–13 | date=June 2008 | pmid=18609108 | doi=10.1080/00365510802126836 | url=https://figshare.com/articles/journal_contribution/11808120 }} | μg/L | ||||
| Non-smokers, 70 years | 4.1 | ||||||||||||||||
| Smokers | 5 | ||||||||||||||||
| Prostate specific antigen (PSA) | 40–49 years | last1=Luboldt | first1=Hans-Joachim | last2=Schindler | first2=Joachim F. | last3=Rübben | first3=Herbert | title=Age-Specific Reference Ranges for Prostate-Specific Antigen as a Marker for Prostate Cancer | journal=EAU-EBU Update Series | volume=5 | issue=1 | year=2007 | pages=38–48 | issn=1871-2592 | doi=10.1016/j.eeus.2006.10.003}} | μg/L or ng/mL | More detailed cutoffs in PSA – Serum levels |
| 70–79 years, non-African-American | 4.0–9.0 | ||||||||||||||||
| 70–79 years, African-American | 7.7–13 | ||||||||||||||||
| PAP | 3 | units/dL (Bodansky units) | |||||||||||||||
| Calcitonin | vauthors=Basuyau JP, Mallet E, Leroy M, Brunelle P | title=Reference intervals for serum calcitonin in men, women, and children | journal=Clinical Chemistry | volume=50 | issue=10 | pages=1828–30 | date=October 2004 | pmid=15388660 | doi=10.1373/clinchem.2003.026963 | doi-access=free }} 15 | ng/L or pg/mL | cutoffs]] in Calcitonin article |
Endocrinology
Thyroid hormones
| Test | Patient type | Lower limit | Upper limit | Unit | ||||||||||
|---|---|---|---|---|---|---|---|---|---|---|---|---|---|---|
| Thyroid stimulating hormone | ||||||||||||||
| (TSH or thyrotropin) | Adults – | |||||||||||||
| standard range | url=https://web.archive.org/web/20160411081930/http://thyroid.about.com/od/gettestedanddiagnosed/a/tshtestwars.htm | date=2016-04-11 }} By Mary Shomon, About.com. Updated: June 19, 2006. About.com Health's Disease and Condition | 4.0, 4.5, 6.0 | mIU/L or μIU/mL | ||||||||||
| Adults – | ||||||||||||||
| optimal range | url=https://web.archive.org/web/20080303175142/http://www.aace.com/newsroom/press/2006/index.php?r=20060110 | date=2008-03-03 }} Contacts: Bryan Campbell American] Association of Clinical Endocrinologists 0.5 | 2.0, 3.0 | |||||||||||
| Infants | last =Demers | first =Laurence M. | author2 =Carole A. Spencer | title =LMPG: Laboratory Support for the Diagnosis and Monitoring of Thyroid Disease | publisher =National Academy of Clinical Biochemistry (USA) | year =2002 | url =http://www.nacb.org/lmpg/thyroid_LMPG_PDF.stm | access-date =2007-04-13 | archive-date =2008-11-20 | archive-url =https://web.archive.org/web/20081120130504/http://www.nacb.org/lmpg/thyroid_LMPG_PDF.stm}} – see *Section 2. Pre-analytic factors* | 19 | |||
| Free thyroxine (FT4) | ||||||||||||||
| Normal adult | url=https://web.archive.org/web/20101222231732/http://labs.unchealthcare.org/labstestinfo/f_tests/free_t4.htm | date=2010-12-22 }} UNC Health Care System 0.8 | 1.4, | ng/dL | ||||||||||
| vauthors=van der Watt G, Haarburger D, Berman P | title=Euthyroid patient with elevated serum free thyroxine | journal=Clinical Chemistry | volume=54 | issue=7 | pages=1239–41 | date=July 2008 | pmid=18593963 | doi=10.1373/clinchem.2007.101428 | doi-access=free }} | 18, 23 | pmol/L | |||
| Child/Adolescent | ||||||||||||||
| 31 d – 18 y | 0.8 | 2.0 | ng/dL | |||||||||||
| 10 | 26 | pmol/L | ||||||||||||
| Pregnant | 0.5 | 1.0 | ng/dL | |||||||||||
| 6.5 | 13 | pmol/L | ||||||||||||
| Total thyroxine | 4, 5.5 | 11, 12.3 | μg/dL | |||||||||||
| 60 | 140, 160 | nmol/L | ||||||||||||
| Free triiodothyronine (FT3) | Normal adult | 0.2 | 0.5 | ng/dL | ||||||||||
| 3.1 | 7.7 | pmol/L | ||||||||||||
| Children 2-16 y | id= | vauthors=Cioffi M, Gazzerro P, Vietri MT, etal | title=Serum concentration of free T3, free T4 and TSH in healthy children | journal=Journal of Pediatric Endocrinology & Metabolism | volume=14 | issue=9 | pages=1635–39 | year=2001 | pmid=11795654 | doi=10.1515/jpem.2001.14.9.1635 | s2cid=34910563 }} | 0.6 | ng/dL | |
| 1.5 | 9.2 | pmol/L | ||||||||||||
| Total triiodothyronine | url=https://web.archive.org/web/20110701163827/http://www.thyroidmanager.org/chapter6/Ch-6b-2.htm | date=2011-07-01 }} – Thyroid Disease Manager | 175, 181 | ng/dL | ||||||||||
| 0.9, 1.1 | 2.5, 2.7 | nmol/L | ||||||||||||
| Thyroxine-binding globulin (TBG) | 12 | 30 | mg/L | |||||||||||
| Thyroglobulin (Tg) | 1.5 | 30 | pmol/L | |||||||||||
| 1 | 20 | μg/L |
Sex hormones
The diagrams below take inter-cycle and inter-woman variability into account in displaying reference ranges for estradiol, progesterone, FSH and LH.

| Test | Patient type | Lower limit | Upper limit | Unit | ||||||||
|---|---|---|---|---|---|---|---|---|---|---|---|---|
| Dihydrotestosterone | adult male | 1.0 | 2.9 | nmol/L | ||||||||
| 30 | 85 | ng/dL | ||||||||||
| Testosterone | Male, overall | url=http://www.andrologyaustralia.org/pageContent.asp?pageCode=LOWTESTDIAG#LOWTESTDIAGNORM | title=Andrology Australia: Your Health Low Testosterone Diagnosis | access-date=2008-11-28 | archive-date=2012-02-17 | archive-url=https://web.archive.org/web/20120217051046/http://www.andrologyaustralia.org/pageContent.asp?pageCode=LOWTESTDIAG#LOWTESTDIAGNORM}} 10 | 27, 35 | nmol/L | ||||
| 230, 300 | 780–1000 | ng/dL | ||||||||||
| Male | 10 | 45 | nmol/L | |||||||||
| 290 | 1300 | ng/dL | ||||||||||
| Male 50 years | 6.2 | 26 | nmol/L | |||||||||
| 180 | 740 | ng/dL | ||||||||||
| Female | 0.7 | 2.8–3.0 | nmol/L | |||||||||
| 20 | 80–85 | ng/dL | ||||||||||
| [17α-Hydroxyprogesterone](17a-hydroxyprogesterone) | male | 0.06 | 3.0 | mg/L | ||||||||
| 0.18 | 9.1 | μmol/L | ||||||||||
| Female (Follicular phase) | 0.2 | 1.0 | mg/L | |||||||||
| 0.6 | 3.0 | μmol/L | ||||||||||
| Follicle-stimulating | ||||||||||||
| hormone (FSH) | ||||||||||||
| Prepubertal | 3 | IU/L | ||||||||||
| Adult male | 1 | 8 | ||||||||||
| Adult female (follicular | ||||||||||||
| and luteal phase) | 1 | 11 | ||||||||||
| Adult female (Ovulation) | PI]] (standard) | 26 | ||||||||||
| 95% PI) | ||||||||||||
| vauthors=Stricker R, Eberhart R, Chevailler MC, Quinn FA, Bischof P, Stricker R | s2cid=524952 | title=Establishment of detailed reference values for luteinizing hormone, follicle stimulating hormone, estradiol, and progesterone during different phases of the menstrual cycle on the Abbott ARCHITECT analyzer | journal=Clinical Chemistry and Laboratory Medicine | volume=44 | issue=7 | pages=883–87 | year=2006 | pmid=16776638 | doi=10.1515/CCLM.2006.160}} | |||
| 90% PI (used in diagram) | 15 | |||||||||||
| (90% PI) | ||||||||||||
| Post-menopausal female | 30 | 118 | ||||||||||
| Luteinizing hormone (LH) | ||||||||||||
| Female, peak | PI]] (used in diagram) | 75 | ||||||||||
| (90% PI) | IU/L | |||||||||||
| Female, post-menopausal | date=April 2018 | bot=InternetArchiveBot | fix-attempted=yes }} Retrieved on Nov 8, 2009 | 60 | ||||||||
| Male aged 18+ | url=https://web.archive.org/web/20160925112456/http://www.mayomedicallaboratories.com/test-catalog/Clinical+and+Interpretive/8663 | date=2016-09-25 }}, retrieved December 2012 | 9 | |||||||||
| Estradiol | ||||||||||||
| (an estrogen) | ||||||||||||
| Adult male | url=https://web.archive.org/web/20120609174939/http://www.gpnotebook.co.uk/simplepage.cfm?ID=570818627&linkID=24801&cook=yes | date=2012-06-09 }} Retrieved on September 27, 2009 | 200 | pmol/L | ||||||||
| 14 | 55 | pg/mL | ||||||||||
| Adult female (day 5 of follicular phase, | ||||||||||||
| and luteal phase) | 70 | 500, 600 | pmol/L | |||||||||
| 19 | 140, 160 | pg/mL | ||||||||||
| Adult female – free (not protein bound) | vauthors=Wu CH, Motohashi T, Abdel-Rahman HA, Flickinger GL, Mikhail G | title=Free and protein-bound plasma estradiol-17 beta during the menstrual cycle | journal=J. Clin. Endocrinol. Metab. | volume=43 | issue=2 | pages=436–45 | date=August 1976 | pmid=950372 | doi= 10.1210/jcem-43-2-436}} | 9 | pg/mL | |
| 1.7 | 33 | pmol/L | ||||||||||
| Post-menopausal female | 0 | 130 | pmol/L | |||||||||
| 0 | 35 | pg/mL | ||||||||||
| Progesterone | ||||||||||||
| Female in mid-luteal phase (day 21–23) | 17, | 92 | nmol/L | |||||||||
| url=https://web.archive.org/web/20100602092012/http://medind.nic.in/jaq/t05/i4/jaqt05i4p350.pdf | date=2010-06-02 }} J Obstet Gynecol India Vol. 55, No. 4 : July/August 2005 pp. 350–52 | 29 | ng/mL | |||||||||
| Androstenedione | Adult male and female | 60 | 270 | ng/dL | ||||||||
| Post-menopausal female | ||||||||||||
| Prepubertal | ||||||||||||
| Dehydroepiandrosterone sulfate | Adult male and female | url=https://web.archive.org/web/20180314080932/https://www.mayomedicallaboratories.com/test-catalog/Clinical+and+Interpretive/8493 | date=2018-03-14 }} at Mayo Foundation For Medical Education And Research. Retrieved July 2012 | 400 | μg/dL | |||||||
| SHBG | ||||||||||||
| Adult female | url=https://web.archive.org/web/20110720111631/http://www.mayomedicallaboratories.com/test-catalog/print.php?unit_code=91215 | date=2011-07-20 }} at Mayo Clinic Medical Laboratories. Retrieved April 2011 | 120 | nmol/L | ||||||||
| Adult male | 20 | 60 | ||||||||||
| Anti-Müllerian hormone (AMH) | ||||||||||||
| 13–45 years | url=https://web.archive.org/web/20130729050717/http://www.mayomedicallaboratories.com/test-catalog/print/89711 | date=2013-07-29 }} from Mayo Medical Laboratories. Retrieved April 2012. | 20 | ng/mL | ||||||||
| 5Derived from mass values using 140,000 g/mol, as given in: |
Other hormones
| Test | Patient type | Lower limit | Upper limit | Unit | |||||||||
|---|---|---|---|---|---|---|---|---|---|---|---|---|---|
| Adrenocorticotropic hormone (ACTH) | last1=Nieman | first1=Lynnette K | title=Measurement of ACTH, CRH, and other hypothalamic and pituitary peptides | url=https://www.uptodate.com/contents/measurement-of-acth-crh-and-other-hypothalamic-and-pituitary-peptides | website=www.uptodate.com | publisher=UpToDate | access-date=25 June 2021 | date=29 September 2019 | archive-date=25 June 2021 | archive-url=https://web.archive.org/web/20210625125528/https://www.uptodate.com/contents/measurement-of-acth-crh-and-other-hypothalamic-and-pituitary-peptides }} | 13.3 | pmol/L | |
| 20 | 100 | pg/mL | |||||||||||
| Cortisol | 09:00 am | url=https://web.archive.org/web/20100720014644/http://www.goodhope.org.uk/Departments/pathweb/refranges.htm | date=2010-07-20 }} Retrieved on Nov 8, 2009 | 700 | nmol/L | ||||||||
| 5 | 25 | μg/dL | |||||||||||
| Midnight | 80 | 350 | nmol/L | ||||||||||
| 2.9 | 13 | μg/dL | |||||||||||
| Growth hormone (fasting) | 0 | 5 | ng/mL | ||||||||||
| Growth hormone (arginine stimulation) | 7 | n/a | ng/mL | ||||||||||
| IGF-1 | |||||||||||||
| Female, 20 yrs | vauthors=Friedrich N, Alte D, Völzke H, etal | title=Reference ranges of serum IGF-1 and IGFBP-3 levels in a general adult population: results of the Study of Health in Pomerania (SHIP) | journal=Growth Hormone & IGF Research | volume=18 | issue=3 | pages=228–37 | date=June 2008 | pmid=17997337 | doi=10.1016/j.ghir.2007.09.005}} | 420 | ng/mL | ||
| Female, 75 yrs | 55 | 220 | |||||||||||
| Male, 20 yrs | 160 | 390 | |||||||||||
| Male, 75 yrs | 48 | 200 | |||||||||||
| Prolactin | |||||||||||||
| Female | 71, 105 | vauthors=Beltran L, Fahie-Wilson MN, McKenna TJ, Kavanagh L, Smith TP | title=Serum total prolactin and monomeric prolactin reference intervals determined by precipitation with polyethylene glycol: evaluation and validation on common immunoassay platforms | journal=Clinical Chemistry | volume=54 | issue=10 | pages=1673–81 | date=October 2008 | pmid=18719199 | doi=10.1373/clinchem.2008.105312 | doi-access=free }} | mIU/L | |
| 3.4, 3.9 | 16.4, 20.3 | μg/L | |||||||||||
| Male | 58, 89 | 277, 365 | mIU/L | ||||||||||
| 2.7, 3.3 | 13.0, 13.5 | μg/L | |||||||||||
| Parathyroid hormone (PTH) | vauthors=Aloia JF, Feuerman M, Yeh JK | title=Reference range for serum parathyroid hormone | journal=Endocr Pract | volume=12 | issue=2 | pages=137–44 | year=2006 | pmid=16690460 | pmc=1482827 | doi= 10.4158/ep.12.2.137}} | 65, 70 | pg/mL | |
| 1.1, | 6.9, 7.5 | pmol/L | |||||||||||
| [25-hydroxycholecalciferol](25-hydroxycholecalciferol) (a vitamin D) | |||||||||||||
| – Standard reference range | 8, 9 | 40, 80 | ng/mL | ||||||||||
| author=Bender, David A. | chapter=Vitamin D | title=Nutritional biochemistry of the vitamins | publisher=Cambridge University Press | location=Cambridge | year=2003 | isbn=978-0-521-80388-5 | chapter-url=https://books.google.com/books?id=pxEJNs0IUo4C}} Retrieved December 10, 2008 through Google Book Search. 23 | 95, 150 | nmol/L | ||||
| [25-hydroxycholecalciferol](25-hydroxycholecalciferol) | |||||||||||||
| – Therapeutic target range | vauthors=Reusch J, Ackermann H, Badenhoop K | title=Cyclic changes of vitamin D and PTH are primarily regulated by solar radiation: 5-year analysis of a German (50 degrees N) population | journal=Horm. Metab. Res. | volume=41 | issue=5 | pages=402–07 | date=May 2009 | pmid=19241329 | doi=10.1055/s-0028-1128131 | s2cid=260166796 }} 40 | 65, 100 | ng/mL | |
| url=https://web.archive.org/web/20090529032656/http://adeeva.com/resources/bloodtestscomplete.html | date=2009-05-29 }} Retrieved on July 9, 2009 100 | 120, 160 | nmol/L | ||||||||||
| Plasma renin activity | 0.29,Converted from values in mcU/mL by dividing with a factor of 11.2 mcU/mL per ng/(mL*hour), as given in: | ||||||||||||
| url=https://web.archive.org/web/20111027045833/http://depts.washington.edu/labweb/referencelab/print/endo.pdf | date=2011-10-27 }} University of Washington, Department of Laboratory Medicine. Retrieved Mars 2011 21Converted from values in ng/(mL*hour) by multiplying with a factor of 11.2 mcU/mL per ng/(mL*hour), as given in: | ||||||||||||
| Aldosterone | |||||||||||||
| Adult | 19, 34.0 | ng/dL | |||||||||||
| 530, | pmol/L | ||||||||||||
| Aldosterone-to-renin ratio | |||||||||||||
| Adult | vauthors=Tiu SC, Choi CH, Shek CC, etal | title=The use of aldosterone-renin ratio as a diagnostic test for primary hyperaldosteronism and its test characteristics under different conditions of blood sampling | journal=The Journal of Clinical Endocrinology and Metabolism | volume=90 | issue=1 | pages=72–78 | date=January 2005 | pmid=15483077 | doi=10.1210/jc.2004-1149 | citeseerx=10.1.1.117.5182 }} | ng/dL per ng/(mL·h) | ||
| 360, 970 | pmol/liter per μg/(L·h) |
Vitamins
Also including the vitamin B12)-related amino acid homocysteine.
| Test | Patient type | Standard range | Optimal range | Unit | Lower limit | Upper limit | Lower limit | Upper limit | |
|---|---|---|---|---|---|---|---|---|---|
| Vitamin A | 30 | 65 | μg/dL | ||||||
| Vitamin B9 | |||||||||
| (Folic acid/Folate) – **Serum** | Age 1 year | url=https://web.archive.org/web/20121130102124/http://www.cmft.nhs.uk/directorates/labmedicine/USERGUIDE/pdfs/Haem%20-%20Coagulation%20Ref%20Ranges.pdf | date=2012-11-30 }} Retrieved on July 9, 2009 | 16 | 5 | ng/mL or μg/L | |||
| 6.8 | 36 | 11 | nmol/L | ||||||
| Vitamin B9 | |||||||||
| (Folic acid/Folate) – **Red blood cells** | 200 | 600 | ng/mL or μg/L | ||||||
| 450 | 1400 | nmol/L | |||||||
| Pregnant | 400 | ng/mL or μg/L | |||||||
| 900 | nmol/L | ||||||||
| Vitamin B12 (Cobalamin) | 130, 160 | 700, 950 | ng/L | ||||||
| 100, 120 | 520, 700 | pmol/L | |||||||
| Homocysteine | |||||||||
| url=http://www.thedoctorsdoctor.com/labtests/homocysteine.htm | title=Homocysteine | website=www.thedoctorsdoctor.com}} 5.9 | 7.2, 15.3 | 6.3 | μmol/L | ||||
| 45, 80 | 100, 210 | 85 | μg/dL | ||||||
| Vitamin C (Ascorbic acid) | 0.4 | 1.5 | 0.9 | mg/dL | |||||
| 23 | 85 | 50 | μmol/L | ||||||
| [25-hydroxycholecalciferol](25-hydroxycholecalciferol) (a vitamin D) | 8, 9 | 40, 80 | 30, 40 | 65, 100 | ng/mL | ||||
| 20, 23 | 95, 150 | 85, 100 | 120, 160 | nmol/L | |||||
| Vitamin E | 28 | μmol/L | |||||||
| 1.2 | mg/dL |
Toxic Substances
| Test | Limit type | Limit | Unit |
|---|---|---|---|
| Lead | Optimal health range | μg/dL | |
| Blood ethanol content | Limit for drunk driving | 0, 0.8 | ‰ or g/L |
| 17.4 | mmol/L |
Hematology
Red blood cells
These values (except Hemoglobin in plasma) are for total blood and not only blood plasma.
| Test | Patient | Lower limit | Upper limit | Unit | Comments | ||||||||||
|---|---|---|---|---|---|---|---|---|---|---|---|---|---|---|---|
| Hemoglobin (Hb) | Male | vauthors=Van Beekvelt MC, Colier WN, Wevers RA, Van Engelen BG | s2cid=15468862 | title=Performance of near-infrared spectroscopy in measuring local O2 consumption and blood flow in skeletal muscle | journal=J Appl Physiol | volume=90 | issue=2 | pages=511–19 | year=2001 | pmid=11160049 | doi=10.1152/jappl.2001.90.2.511 }} 2.1 | 2.5, 2.7 | mmol/L | Higher in neonates, lower in children. | |
| 130, 132, 135 | 162, 170, 175 | g/L | |||||||||||||
| Female | 1.8, 1.9 | 2.3, 2.5 | mmol/L | Sex difference negligible until adulthood. | |||||||||||
| 120 | 150, 152, 160 | g/L | |||||||||||||
| Hemoglobin subunits (sometimes displayed simply as "Hemoglobin") | Male | vauthors=Lodemann P, Schorer G, Frey BM | s2cid=3091357 | title=Wrong molar hemoglobin reference values-a longstanding error that should be corrected | journal=Annals of Hematology | volume=89 | issue=2 | page=209 | date=February 2010 | pmid=19609525 | doi=10.1007/s00277-009-0791-x | doi-access=free }} 8.4 | 10.0, 10.8 | mmol/L | 4 per hemoglobin molecule |
| Female | 7.2, 7.6 | 9.2, 10.0 | |||||||||||||
| Hemoglobin in plasma | 0.16 | 0.62 | μmol/L | Normally diminutive compared with inside red blood cells | |||||||||||
| 1 | 4 | mg/dL | |||||||||||||
| Glycated hemoglobin (HbA1c) | 3.6 | 5.0 | % of Hb | ||||||||||||
| 50 years | 3.9 | 5.3 | |||||||||||||
| Haptoglobin | 0.35 | 1.9 | g/L | ||||||||||||
| 50 years | 0.47 | 2.1 | |||||||||||||
| Hematocrit (Hct) | Male | 0.39, 0.4, 0.41, 0.45 | 0.50, 0.52, 0.53, 0.62 | L/L | |||||||||||
| Female | 0.35, 0.36, 0.37 | 0.46, 0.48 | L/L | ||||||||||||
| Child | 0.31 | 0.43 | L/L | ||||||||||||
| Mean corpuscular volume (MCV) | Male | 76, 82 | 100, 102 | fL | Cells are larger in neonates, though smaller in other children. | ||||||||||
| Female | 78 | 101 | fL | ||||||||||||
| Red blood cell distribution width (RDW) | 11.5 | 14.5 | % | ||||||||||||
| Mean cell hemoglobin (MCH) | 0.39 | 0.54 | fmol/cell | ||||||||||||
| 25, 27 | 32, 33, 35 | pg/cell | |||||||||||||
| Mean corpuscular hemoglobin concentration (MCHC) | vauthors=Van Beekvelt MC, Colier WN, Wevers RA, Van Engelen BG | s2cid=15468862 | title=Performance of near-infrared spectroscopy in measuring local O2 consumption and blood flow in skeletal muscle | journal=J Appl Physiol | volume=90 | issue=2 | pages=511–19 | year=2001 | pmid=11160049 | doi=10.1152/jappl.2001.90.2.511 }}. Subsequently, 1 g/dL = 0.1551 mmol/L 5.0 | 5.4, 5.6 | mmol/L | |||
| 31, 32 | 35, 36 | g/dL or % | |||||||||||||
| Erythrocytes/Red blood cells (RBC) | Male | 4.2, 4.3 | 5.7, 5.9, 6.2, 6.9 | x1012/L | |||||||||||
| or | |||||||||||||||
| million/mm3 | |||||||||||||||
| Female | 3.5, 3.8, 3.9 | 5.1, 5.5 | |||||||||||||
| Infant/Child | 3.8 | 5.5 | |||||||||||||
| Reticulocytes | Adult | 26 | 130 | x109/L | |||||||||||
| 0.5 | 1.5 | % of RBC | |||||||||||||
| Newborn | 1.1 | 4.5 | % of RBC | ||||||||||||
| Infant | 0.5 | 3.1 | % of RBC | ||||||||||||
| Immature reticulocyte fraction (IRF) | Adult | author=Morkis IV, Farias MG, Scotti L | title=Determination of reference ranges for immature platelet and reticulocyte fractions and reticulocyte hemoglobin equivalent. | journal=Rev Bras Hematol Hemoter | year= 2016 | volume= 38 | issue= 4 | pages= 310–313 | pmid=27863758 | doi=10.1016/j.bjhh.2016.07.001 | pmc=5119661 }} | 12.1 | % of reticulocytes | ||
| Reticulocyte hemoglobin equivalent | Adult | 30.0 | 37.6 | % | |||||||||||
| author=Brugnara C, Schiller B, Moran J | title=Reticulocyte hemoglobin equivalent (Ret He) and assessment of iron-deficient states. | journal=Clinical and Laboratory Haematology | year= 2006 | volume= 28 | issue= 5 | pages= 303–8 | pmid=16999719 | doi=10.1111/j.1365-2257.2006.00812.x | pmc=1618805 }} | 35.8 | pg | ||||
| Immature platelet fraction (IPF) | Adult | 0.8 | 5.6 | % |
White blood cells
These values are for total blood and not only blood plasma.
| Test | Patient type | Lower limit | Upper limit | Unit | |||||||
|---|---|---|---|---|---|---|---|---|---|---|---|
| White Blood Cell Count (WBC) | Adult | 3.5, 4.1, 4.5 | 9.0, 10.0, 10.9, 11 | ||||||||
| Newborn | url=https://books.google.com/books?id=3PJVLH1NmQAC | title=Clinical Laboratory Medicine | first=Kenneth D. | last=McClatchey | date=November 28, 2002 | publisher=Lippincott Williams & Wilkins | isbn=978-0-683-30751-1 | via=Google Books}} | 30 | ||
| 1 year old | 6 | 18 | |||||||||
| Neutrophil_count Neutrophil granulocytes | |||||||||||
| (A.K.A. grans, polys, PMNs, or segs) | Adult | 1.3, 1.8, 2 | 5.4, 7, 8 | x109/L | |||||||
| 45–54 | 62, 74 | % of WBC | |||||||||
| Newborn | 6 | 26 | x109/L | ||||||||
| Neutrophilic band forms | Adult | 0.7 | x109/L | ||||||||
| 3 | 5 | % of WBC | |||||||||
| Lymphocytes | Adult | 0.7, 1.0 | 3.5, 3.9, 4.8 | x109/L | |||||||
| 16–25 | 33, 45 | % of WBC | |||||||||
| Newborn | 2 | 11 | x109/L | ||||||||
| Monocytes | Adult | 0.1, | 0.8 | x109/L | |||||||
| 3, 4.0 | 7, 10 | % of WBC | |||||||||
| Newborn | 0.4 | 3.1 | x109/L | ||||||||
| Mononuclear leukocytes | |||||||||||
| (Lymphocytes + monocytes) | Adult | 1.5 | 5 | x109/L | |||||||
| 20 | 35 | % of WBC | |||||||||
| CD4+ T cells | Adult | url=https://web.archive.org/web/20111225185659/http://pathcuric1.swmed.edu/pathdemo/nrrt.htm | date=2011-12-25 }} from The University of Texas Southwestern Medical Center at Dallas. Used in Interactive Case Study Companion to Pathologic basis of disease. 0.5 | 1.5, 1.8 | x109/L | ||||||
| Eosinophil granulocytes | Adult | 0.0, 0.04 | 0.44, 0.45, 0.5 | x109/L | |||||||
| 1 | 3, 7 | % of WBC | |||||||||
| Newborn | 0.02 | 0.85 | x109/L | ||||||||
| Basophil granulocytes | Adult | 40 | 100, 200, 900 | x106/L | |||||||
| 0.0 | 0.75, 2 | % of WBC | |||||||||
| Newborn | 0.64 | x109/L |
Coagulation
| Test | Lower limit | Upper limit | Unit | Comments | ||||||||||
|---|---|---|---|---|---|---|---|---|---|---|---|---|---|---|
| Thrombocyte/Platelet count (Plt) | 140, 150 | 350, 400, 450 | x109/L or | |||||||||||
| x1000/μL | ||||||||||||||
| Mean platelet volume (MPV) | vauthors=Demirin H, Ozhan H, Ucgun T, Celer A, Bulur S, Cil H, Gunes C, Yildirim HA | title=Normal range of mean platelet volume in healthy subjects: Insight from a large epidemiologic study | journal=Thromb. Res. | volume=128 | issue=4 | pages=358–60 | year=2011 | pmid=21620440 | doi=10.1016/j.thromres.2011.05.007 | hdl=20.500.12684/3830 | hdl-access=free }} 7.4, 7.5 | 10.4, 11.5, 11.7 | fL | |
| Prothrombin time (PT) | 003652}} 12 | 13, 13.5, 14, 15 | s | PT reference varies between laboratory kits – INR is standardised | ||||||||||
| INR | 0.9 | 1.2 | The INR is a corrected ratio of a patient's PT to normal | |||||||||||
| Activated partial thromboplastin time (APTT) | 18, 30 | 28, 42, 45 | s | |||||||||||
| Thrombin clotting time (TCT) | 11 | 18 | s | |||||||||||
| Fibrinogen | 1.7, 2.0 | 3.6, 4.2 | g/L | |||||||||||
| Antithrombin | 0.80 | 1.2 | kIU/L | |||||||||||
| article | 2084978 | Antithrombin III}} 0.17[Antithrombin CO000300](http://mghlabtest.partners.org/coagbook/co000300.htm) in *Coagulation Test Handbook* at Massachusetts General Hospital. In turn citing: | ||||||||||||
| Bleeding time | 2 | 9 | minutes | |||||||||||
| Viscosity | url=http://pathology.bsuh.nhs.uk/pathology/Default.aspx?tabid=108 | title=Home | website=pathology.bsuh.nhs.uk | access-date=November 20, 2009}} | 1.72 | cP |
Immunology
Acute phase proteins
Acute phase proteins are markers of inflammation.
| Patient | Lower limit | Upper limit | Unit | Comments | |||||||||
|---|---|---|---|---|---|---|---|---|---|---|---|---|---|
| **Test** | |||||||||||||
| Erythrocyte sedimentation rate | |||||||||||||
| (ESR) | Male | 0 | Age÷2 | mm/h | |||||||||
| Female | vauthors=Miller A, Green M, Robinson D | title=Simple rule for calculating normal erythrocyte sedimentation rate | journal=British Medical Journal | volume=286 | issue=6361 | page=266 | date=January 1983 | pmid=6402065 | pmc=1546487 | doi=10.1136/bmj.286.6361.266}} | |||
| C-reactive protein (CRP) | 946536472 | C-reactive protein}} 6 | mg/L | ||||||||||
| 200, 240 | nmol/L | ||||||||||||
| Alpha 1-antitrypsin (AAT) | vauthors=Sipahi T, Kara C, Tavil B, Inci A, Oksal A | title=Alpha-1 antitrypsin deficiency: an overlooked cause of late hemorrhagic disease of the newborn | journal=Journal of Pediatric Hematology/Oncology | volume=25 | issue=3 | pages=274–75 | date=March 2003 | pmid=12621252 | doi=10.1097/00043426-200303000-00019}} 22 | 38, 53 | μmol/L | ||
| 89, 97 | 170, 230 | mg/dL | |||||||||||
| Procalcitonin | 0.15 | ng/mL or μg/L |
Isotypes of antibodies
| Test | Patient | Lower limit | Upper limit | Unit | |
|---|---|---|---|---|---|
| IgA | Adult | url=https://web.archive.org/web/20091015063657/http://www.ascls.org/labtesting/labchem.asp | date=2009-10-15 }} Retrieved on Nov 26, 2009 | 360, 560 | mg/dL |
| IgD | 0.5 | 3.0 | |||
| IgE | 0.01 | 0.04 | |||
| IgG | 800 | 1800 | |||
| IgM | 54 | 220 |
Autoantibodies
Autoantibodies are usually absent or very low, so instead of being given in standard reference ranges, the values usually denote where they are said to be present, or whether the test is a positive test. There may also be an equivocal interval, where it is uncertain whether there is a significantly increased level.
| Test | Negative | Equivocal | Positive | Unit | ||||
|---|---|---|---|---|---|---|---|---|
| anti-SS-A (Ro) | title=SSA – Clinical: SS-A/Ro Antibodies, IgG, Serum | url= https://www.mayocliniclabs.com/test-catalog/Clinical+and+Interpretive/81360 | website=www.mayocliniclabs.com | publisher=Mayo Clinic Laboratories | access-date=2 July 2020}} | n/a | ≥ 1.0 | Units (U) |
| anti-SS-B (La) | title=SSB – Clinical: SS-B/La Antibodies, IgG, Serum | url= https://www.mayocliniclabs.com/test-catalog/Clinical+and+Interpretive/81359 | website=www.mayocliniclabs.com | publisher=Mayo Clinic Laboratories | access-date=2 July 2020}} | n/a | ≥ 1.0 | |
| Anti ds-DNA | title=ADNA – Clinical: DNA Double-Stranded Antibodies, IgG, Serum | url= https://www.mayocliniclabs.com/test-catalog/Clinical+and+Interpretive/8178 | website=www.mayocliniclabs.com | publisher=Mayo Clinic Laboratories | access-date=2 July 2020}} | 30.0–75.0 | 75.0 | International Units per millilitre (IU/mL) |
| Anti ss-DNA | url=https://web.archive.org/web/20130730010746/http://www.chronolab.com/rheumatic/range.htm | date=2013-07-30 }} Retrieved on April 29, 2010 | 8–10 | 10 | Units per millilitre (U/mL) | |||
| Anti-histone antibodies | n/a | 25 | ||||||
| Cytoplasmic anti-neutrophil | ||||||||
| cytoplasmic antibodies (c-ANCA) | 21–30 | 30 | ||||||
| Perinuclear anti-neutrophil | ||||||||
| cytoplasmic antibodies (p-ANCA) | n/a | 5 | ||||||
| Anti-mitochondrial antibodies (AMA) | title=AMA – Clinical: Mitochondrial Antibodies (M2), Serum | url=https://www.mayocliniclabs.com/test-catalog/Clinical+and+Interpretive/8176 | website=www.mayocliniclabs.com | publisher=Mayo Clinic Laboratories | access-date=2 July 2020}} | 0.1-0.9 | ≥ 1.0 | Units (U) |
| Rheumatoid factor (RF) | 20–30 | 30 | Units per millilitre (U/mL) | |||||
| Antistreptolysin O titre (ASOT) in | ||||||||
| preschoolers | 100 | |||||||
| ASOT at school age | 250 | |||||||
| ASOT in adults | 125 |
| Test | Negative | Low/weak positive | Moderate positive | High/strong positive | Unit |
|---|---|---|---|---|---|
| Anti-phospholipid IgG | 20–30 | 31–50 | 51 | GPLU/mL | |
| Anti-phospholipid IgM | 1.5–2.5 | 2–9.9 | 10 | MPL /mL | |
| Anti-phospholipid IgA | 10–20 | 21–30 | 31 | arb U/mL | |
| Anti-citrullinated protein antibodies | 20–39 | 40–59 | 60 | EU |
Other immunology
| Test | Lower limit | Upper limit | Unit | ||||||||||
|---|---|---|---|---|---|---|---|---|---|---|---|---|---|
| Serum free light chains (FLC): kappa/lambda ratio | vauthors=Rajkumar SV, Kyle RA, Therneau TM | title=Serum free light chain ratio is an independent risk factor for progression in monoclonal gammopathy of undetermined significance | journal=Blood | volume=106 | issue=3 | pages=812–17 | date=August 2005 | pmid=15855274 | pmc=1895159 | doi=10.1182/blood-2005-03-1038 | display-authors=etal }} | 1.65 | (unitless) |
Other enzymes and proteins
| Test | Lower limit | Upper limit | Unit | Comments | |
|---|---|---|---|---|---|
| Serum total protein | 60, 63 | 78, 82, 84 | g/L | ||
| Lactate dehydrogenase Lactate dehydrogenase (LDH) | 50 | 150 | U/L | ||
| 0.4 | 1.7 | μmol/L | |||
| 1.8 | 3.4 | μkat/L | |||
| Amylase | 25, 30, 53 | 309002307 | Reference range (amylase)}} 123, 125, 190 | U/L | |
| 0.15 | 1.1 | μkat/L | |||
| 200 | 240 | nmol/L | |||
| D-dimer | |||||
| n/a | 500 | ng/mL | Higher in pregnant women | ||
| 0.5 | mg/L | ||||
| Lipase | 7, 10, 23 | 60, 150, 208 | U/L | ||
| Angiotensin-converting enzyme (ACE) | 23 | 57 | U/L | ||
| Acid phosphatase | 3.0 | ng/mL | |||
| Eosinophil cationic protein (ECP) | 2.3 | 16 | μg/L |
Other electrolytes and metabolites
Electrolytes and metabolites: For iron and copper, some related proteins are also included.
| Test | Patient type | Lower limit | Upper limit | Unit | Comments | ||||||||||
|---|---|---|---|---|---|---|---|---|---|---|---|---|---|---|---|
| Osmolality | 275, 280, 281 | 295, 296, 297 | mOsm/kg | Plasma weight excludes solutes | |||||||||||
| Osmolarity | Slightly less than osmolality | mOsm/L | Plasma volume includes solutes | ||||||||||||
| Urea | vauthors=Gardner MD, Scott R | title=Age- and sex-related reference ranges for eight plasma constituents derived from randomly selected adults in a Scottish new town | journal=Journal of Clinical Pathology | volume=33 | issue=4 | pages=380–85 | date=April 1980 | pmid=7400337 | pmc=1146084 | doi=10.1136/jcp.33.4.380}} | 7.0 | mmol/L | BUN – blood urea nitrogen | ||
| 7 | 18, 21 | mg/dL | |||||||||||||
| * Uric acid | 0.18 | 0.48 | mmol/L | ||||||||||||
| Female | 2.0 | 7.0 | mg/dL | ||||||||||||
| Male | 2.1 | 8.5 | mg/dL | ||||||||||||
| Creatinine | Male | vauthors=Finney H, Newman DJ, Price CP | s2cid=35866310 | title=Adult reference ranges for serum cystatin C, creatinine and predicted creatinine clearance | journal=Annals of Clinical Biochemistry | volume=37 | issue=1 | pages=49–59 | date=January 2000 | pmid=10672373 | doi=10.1258/0004563001901524 | doi-access=free }} | 90, 118 | μmol/L | May be complemented with creatinine clearance |
| 0.7, | 1.0, 1.3 | mg/dL | |||||||||||||
| Female | 50, 68 | 90, 98 | μmol/L | ||||||||||||
| 0.6, 0.8 | 1.0, 1.1 | mg/dL | |||||||||||||
| BUN/Creatinine Ratio | 5 | 35 | – | ||||||||||||
| Blood glucose reference ranges Plasma glucose (fasting) | 3.8, 4.0 | 003466 | Glucose tolerance test}} | mmol/L | *See also* glycated hemoglobin (in hematology) | ||||||||||
| 65, | 100, 110 | mg/dL | |||||||||||||
| Full blood glucose (fasting) | 3.3 | 5.6 | mmol/L | ||||||||||||
| 60 | 100 | mg/dL | |||||||||||||
| Random glucose | 3.9 | 7.8 | mmol/L | ||||||||||||
| url=http://my.clevelandclinic.org/health/diseases_conditions/hic_Diabetes_Basics/hic_Understanding_Pre-Diabetes | title=Diabetes – Prevention | website=Cleveland Clinic | access-date=2016-06-23}} Last revised 1/15/2013 | 140 | mg/dL | ||||||||||
| lactate Lactate (Venous) | 4.5 | 19.8 | mg/dL | ||||||||||||
| 0.5 | 2.2 | mmol/L | |||||||||||||
| Lactate (Arterial) | 4.5 | 14.4 | mg/dL | ||||||||||||
| 0.5 | 1.6 | mmol/L | |||||||||||||
| Pyruvate | 300 | 900 | μg/dL | ||||||||||||
| 34 | 102 | μmol/L | |||||||||||||
| Ketones | article | 2087982 | Ketones}} | mg/dL | |||||||||||
| 0.1 | mmol/L |
Medication
| Test | Lower limit | Upper limit | Unit | Comments | ||||||
|---|---|---|---|---|---|---|---|---|---|---|
| Digoxin | title=Medical Toxicology | author=Richard C. Dart | publisher=Lippincott Williams & Wilkins=year=2004 | isbn=978-0-7817-2845-4 | year=2004}} | 2.0 | ng/mL | Narrow therapeutic window | ||
| 0.6 | 2.6 | nmol/L | ||||||||
| Lithium | url=https://web.archive.org/web/20160304000941/http://www.medicines.org.uk/emc/document.aspx?documentId=1239 | date=2016-03-04 }} Revision 2 December 2010, Retrieved 5 May 2011 0.5, 0.8One study ({{Cite journal | first1 = D. | first2 = W. | first3 = M. | |||||
| Paracetamol | title=Rosen's Emergency Medicine – Concepts and Clinical Practice | author1=John Marx | author2=Ron Walls | author3=Robert Hockberger | publisher=Elsevier Health Sciences | year=2013 | isbn=978-1-4557-4987-4}} | mg/L | Risk of paracetamol toxicity at higher levels | |
| 200 | μmol/L |
Notes
References
References
- (2014). "Comprehensive reference ranges for hematology and clinical chemistry laboratory parameters derived from normal Nigerian adults". PLOS ONE.
- (April 2012). "Reference Intervals of Common Clinical Chemistry Analytes for Adults in Hong Kong". EJIFCC.
- (2025). "Chemistry & Hematology Reference Intervals". McGraw Hill.
- "Reference Ranges and What They Mean". Lab Tests Online (USA).
- (2008). "Clinical biochemistry: metabolic and clinical aspects". Churchill Livingstone/Elsevier.
- Boyd, James C.. (January 2010). "Defining laboratory reference values and decision limits: populations, intervals, and interpretations". Asian Journal of Andrology.
- "Reference Ranges & What They Mean".
- (2021). "A Novel Approach to Hematology Testing at the Point of Care.". J Appl Lab Med.
- Dart, Richard C.. (2004). "Medical toxicology". Lippincott Williams & Wilkins.
- (11 July 2013). "Expansion of the Homeostasis Model Assessment of β-Cell Function and Insulin Resistance to Enable Clinical Trial Outcome Modeling Through the Interactive Adjustment of Physiology and Treatment Effects: iHOMA2". Diabetes Care.
- "Reference Interval and Critical Results Table".
- Dufour, D. Robert. (April 2000). "Arterial versus venous reference ranges".
- (2009). "Pregnancy and Laboratory Studies". Obstetrics & Gynecology.
- (August 2007). "The Joint Committee for Traceability in Laboratory Medicine (JCTLM): A Global Approach to Promote the Standardisation of Clinical Laboratory Test Results". The Clinical Biochemist Reviews.
- (1982). "Sample Sizes for Prediction Intervals". Journal of Quality Technology.
- [https://www.uniprot.org/uniprot/P01189 PROOPIOMELANOCORTIN; NCBI / POMC] Retrieved on September 28, 2009
- Derived from molar values using molar mass of 22.99 g•mol−1
- Derived from molar values using molar mass of 39.10 g•mol−1
- Derived from molar values using molar mass of 35.45 g•mol−1
- (November 1978). "Serum ionized calcium and corrected total calcium in borderline hyperparathyroidism". Clin. Chem..
- Derived from molar values using molar mass of 40.08 g•mol−1
- Derived from mass values using molar mass of 40.08 g•mol−1
- Slon S. (2006-09-22). "Serum Iron". University of Illinois Medical Center.
- [http://www.dclmexico.com/ingles/hierro_sl.pdf Diagnostic Chemicals Limited > Serum Iron-SL Assay] {{webarchive. link. (2009-01-06 July 15, 2005)
- Derived from mass values using molar mass of 55.85 g•mol−1
- [http://www.clinchem.org/cgi/reprint/45/1/131.pdf Table 1.] Page 133" ''Clinical Chemistry'' 45, No. 1, 1999 (stating 1.9–3.3 g/L)
- Derived by dividing mass values with molar mass
- [https://medlineplus.gov/ency/article/003490.htm Ferritin] by: Mark Levin, MD, Hematologist and Oncologist, Newark, NJ. Review provided by VeriMed Healthcare Network
- Andrea Duchini. "Hemochromatosis Workup".
- Derived from mass values using molar mass of 450,000 g•mol−1
- (August 2001). "Metastatic carcinomatous cirrhosis and hepatic hemosiderosis in a patient heterozygous for the H63D genotype". Arch. Pathol. Lab. Med..
- (July 1995). "Reference intervals for blood ammonia in healthy subjects, determined by microdiffusion". Clin. Chem..
- Derived from molar values using molar mass of 17.03 g/mol
- Derived from mass values using molar mass of 63.55 g•mol−1
- {{Cite GPnotebook. 1040580630. Reference range for copper
- Derived from mass using molar mass of 151kDa
- Walter F. Boron. (2005). "Medical Physiology: A Cellular And Molecular Approach". Elsevier/Saunders.
- "Archived copy".
- Derived from molar values using molar mass of 65.38 g/mol
- Derived from mass values using molar mass of 65.38 g/mol
- 1.7Derived from molar values using molar mass of 24.31 g/mol
- Derived from mass values using molar mass of 24.31 g/mol
- (August 2006). "Agreements between arterial and central venous values for pH, bicarbonate, base excess, and lactate". Emerg Med J.
- [http://www.brooksidepress.org/Products/OperationalMedicine/DATA/operationalmed/Lab/ABG_ArterialBloodGas.htm The Medical Education Division of the Brookside Associates / ABG (Arterial Blood Gas)] Retrieved on Dec 6, 2009
- Derived from molar values using molar mass of 1.01 g•mol−1
- 95,[http://www.merck.com/mmhe/appendixes/ap2/ap2b.html Merck Manuals > Common Medical Tests > Blood Tests] Last full review/revision February 2003
- Derived from molar values using molar mass of 44.010 g/mol
- [http://www.bloodbook.com/ranges.html Blood Test Results – Normal Ranges] {{Webarchive. link. (2012-11-02 Bloodbook.Com)
- Derived from molar values using molar mass of 61 g/mol
- Derived from mass using molecular weight of 65kD
- Derived from mass values using molar mass of 585g/mol
- (2007). "First Aid for the USMLE Step 1 2008 (First Aid for the Usmle Step 1)". McGraw-Hill Medical.
- Fachwörterbuch Kompakt Medizin E-D/D-E. Author: Fritz-Jürgen Nöhring. Edition 2. Publisher:Elsevier, Urban&FischerVerlag, 2004. {{ISBN. 978-3-437-15120-0. Length: 1288 pages
- (5 November 2009). "Gamma-GT". Medizinisch-Diagnostische Institute.
- {{Cite GPnotebook. 1436155929. Creatine kinase
- Lee, Mary Ann. (2009). "Basic Skills in Interpreting Laboratory Data". Amer Soc of Health System.
- [http://www.medialabinc.net/muscle-keyword.aspx Muscle Information and Courses from MediaLab, Inc. > Cardiac Biomarkers] Retrieved on April 22, 2010
- Ashvarya Mangla. "Troponins".
- (2016-07-01). "Plasma cardiac troponin I concentrations in healthy neonates, children and adolescents measured with a high sensitive immunoassay method: High sensitive troponin I in pediatric age". Clinica Chimica Acta.
- (2004-12-01). "Reference values for cardiac troponins T and I in healthy neonates". Clinical Biochemistry.
- (May 2006). "Gray zone BNP levels in heart failure patients in the emergency department: results from the Rapid Emergency Department Heart Failure Outpatient Trial (REDHOT) multicenter study". American Heart Journal.
- (January 2006). "Impact of the history of congestive heart failure on the utility of B-type natriuretic peptide in the emergency diagnosis of heart failure: results from the Breathing Not Properly Multinational Study". The American Journal of Medicine.
- Lee, Mary Ann. (2009). "Basic Skills in Interpreting Laboratory Data". Amer Soc of Health System.
- Derived from values in mg/dL to mmol/L, by dividing by 89, according to [http://www.faqs.org/faqs/diabetes/faq/part1/section-9.html faqs.org: What are mg/dL and mmol/L? How to convert? Glucose? Cholesterol?] Last Update July 21, 2009. Retrieved on July 21, 2009
- Derived from values in mg/dL to mmol/L, using molar mass of 386.65 g/mol
- [http://www.rcpamanual.edu.au/sections/pathologytest.asp?s=33&i=450 Royal College of Pathologists of Australasia; Cholesterol (HDL and LDL) – plasma or serum] Last Updated: Monday, 6 August 2007
- Derived from values in mmol/L, using molar mass of 386.65 g/mol
- (September 3, 2001). "HDL Cholesterol: The Test".
- [http://www.gpnotebook.co.uk/simplepage.cfm?ID=-100270014 GP Notebook > range (reference, ca-125)] Retrieved on Jan 5, 2009
- [http://www.clinlabnavigator.com/Test-Interpretations/ca-125.html ClinLab Navigator > Test Interpretations > CA-125] {{Webarchive. link. (2012-06-26 Retrieved on March 8, 2011)
- [http://www.medicinenet.com/carcinoembryonic_antigen/article.htm Carcinoembryonic Antigen(CEA)] at MedicineNet
- (2007). "Age-Specific Reference Ranges for Prostate-Specific Antigen as a Marker for Prostate Cancer". EAU-EBU Update Series.
- (October 2004). "Reference intervals for serum calcitonin in men, women, and children". Clinical Chemistry.
- link. (2008-03-03 Contacts: Bryan Campbell American] Association of Clinical Endocrinologists)
- [http://thyroid.about.com/od/gettestedanddiagnosed/a/tshtestwars.htm The TSH Reference Range Wars: What's "Normal?", Who is Wrong, Who is Right...] {{Webarchive. link. (2016-04-11 By Mary Shomon, About.com. Updated: June 19, 2006)
- Demers, Laurence M.. (2002). "LMPG: Laboratory Support for the Diagnosis and Monitoring of Thyroid Disease". [[National Academy of Clinical Biochemistry]] (USA).
- [http://labs.unchealthcare.org/labstestinfo/f_tests/free_t4.htm Free T4; Thyroxine, Free; T4, Free] {{webarchive. link. (2010-12-22 UNC Health Care System)
- || 1.4, 1.5, 1.8Derived from molar values using molar mass of 776.87 g/mol
- Derived from mass values using molar mass of 650.98 g/mol
- (2001). "Serum concentration of free T3, free T4 and TSH in healthy children". Journal of Pediatric Endocrinology & Metabolism.
- (2014). "Reference ranges for estradiol, progesterone, luteinizing hormone and follicle-stimulating hormone during the menstrual cycle". WikiJournal of Medicine.
- "Andrology Australia: Your Health > Low Testosterone > Diagnosis".
- Derived from mass values using molar mass of 288.42g/mol
- Derived from molar values using molar mass of 288.42g/mol
- [https://www.medlineplus.gov/ency/article/003707.htm#Normal%20Values MedlinePlus > Testosterone] Update Date: 3/18/2008. Updated by: Elizabeth H. Holt, MD, PhD, Yale University. Review provided by VeriMed Healthcare Network. Also reviewed by David Zieve, MD, MHA, Medical Director
- Derived from mass values using molar mass of 330.46g/mol
- [http://www.gpnotebook.co.uk/simplepage.cfm?ID=436600899 reference range (FSH)] GPnotebook. Retrieved on September 27, 2009
- (2006). "Establishment of detailed reference values for luteinizing hormone, follicle stimulating hormone, estradiol, and progesterone during different phases of the menstrual cycle on the Abbott ARCHITECT analyzer". Clinical Chemistry and Laboratory Medicine.
- [http://www.nyhq.org/Reference_Ranges& New York Hospital Queens > Services and Facilities > Patient Testing > Pathology > New York Hospital Queens Diagnostic Laboratories > Test Directory > Reference Ranges]{{dead link. (April 2018)
- [http://www.mayomedicallaboratories.com/test-catalog/Clinical+and+Interpretive/8663 Mayo Medical Laboratories > Test ID: LH, Luteinizing Hormone (LH), Serum] {{Webarchive. link. (2016-09-25 , retrieved December 2012)
- link. (2012-06-09 Retrieved on September 27, 2009)
- Derived from molar values using molar mass of 272.38g/mol
- (August 1976). "Free and protein-bound plasma estradiol-17 beta during the menstrual cycle". J. Clin. Endocrinol. Metab..
- 35Derived from mass values using molar mass of 314.46 g/mol
- [http://www.mayomedicallaboratories.com/test-catalog/Clinical+and+Interpretive/8493 Dehydroepiandrosterone Sulfate (DHEA-S), Serum] {{Webarchive. link. (2018-03-14 at Mayo Foundation For Medical Education And Research. Retrieved July 2012)
- link. (2011-07-20 at [[Mayo Clinic]] Medical Laboratories. Retrieved April 2011)
- [http://www.mayomedicallaboratories.com/test-catalog/print/89711 Antimullerian Hormone (AMH), Serum] {{Webarchive. link. (2013-07-29 from Mayo Medical Laboratories. Retrieved April 2012.)
- (29 September 2019). "Measurement of ACTH, CRH, and other hypothalamic and pituitary peptides". UpToDate.
- [http://www.goodhope.org.uk/departments/pathweb/refranges.htm Biochemistry Reference Ranges at Good Hope Hospital] {{Webarchive. link. (2010-07-20 Retrieved on Nov 8, 2009)
- Derived from molar values using molar mass of 362 g/mol
- (June 2008). "Reference ranges of serum IGF-1 and IGFBP-3 levels in a general adult population: results of the Study of Health in Pomerania (SHIP)". Growth Hormone & IGF Research.
- (October 2008). "Serum total prolactin and monomeric prolactin reference intervals determined by precipitation with polyethylene glycol: evaluation and validation on common immunoassay platforms". Clinical Chemistry.
- Derived from molar values using molar mass of 9.4 kDa
- (2006). "Reference range for serum parathyroid hormone". Endocr Pract.
- Bender, David A.. (2003). "Nutritional biochemistry of the vitamins". Cambridge University Press.
- (September 2004). "Higher 25-hydroxyvitamin D concentrations are associated with better lower-extremity function in both active and inactive persons aged > or {{=}}60 y". The American Journal of Clinical Nutrition.
- (May 2009). "Cyclic changes of vitamin D and PTH are primarily regulated by solar radiation: 5-year analysis of a German (50 degrees N) population". Horm. Metab. Res..
- (July 2005). "Calcium and vitamin D in preventing fractures: data are not sufficient to show inefficacy". BMJ.
- [http://www.adeeva.com/resources/bloodtestscomplete.html Adëeva Nutritionals Canada > Optimal blood test values] {{webarchive. link. (2009-05-29 Retrieved on July 9, 2009)
- (March 1988). "Different secretory pathways of renin from mouse cells transfected with the human renin gene". The Journal of Biological Chemistry.
- [http://depts.washington.edu/labweb/referencelab/print/endo.pdf New Assays for Aldosterone, Renin and Parathyroid Hormone] {{webarchive. link. (2011-10-27 University of Washington, Department of Laboratory Medicine. Retrieved Mars 2011)
- 940Converted from mass values using molar mass of 360.44 g/mol
- (January 2005). "The use of aldosterone-renin ratio as a diagnostic test for primary hyperaldosteronism and its test characteristics under different conditions of blood sampling". The Journal of Clinical Endocrinology and Metabolism.
- [http://www.cmft.nhs.uk/directorates/labmedicine/USERGUIDE/pdfs/Haem%20-%20Coagulation%20Ref%20Ranges.pdf Central Manchester University Hospitals / Reference ranges] {{Webarchive. link. (2012-11-30 Retrieved on July 9, 2009)
- || 5[http://www.hosp.uky.edu/Clinlab/report.pdf University of Kentucky Chandler Medical Center > Clinical Lab Reference Range Guide] Retrieved on April 28, 2009
- Derived from mass values using molar mass of 441 mol−1
- [http://www.gpnotebook.co.uk/simplepage.cfm?ID=-2087059389&linkID=35554&cook=no GPnotebook > B12] Retrieved on April 28, 2009
- Derived form molar values using molar mass of 1355g/mol
- Derived from mass values using molar mass of 1355g/mol
- "Homocysteine".
- Derived from molar values using molar massof 135 g/mol
- Derived from mass values using molar mass of 176 grams per mol
- 0.2,For [[Driving under the influence]] by country, see [[Drunk driving law by country]]
- Derived from mass values using molar mass of 46g/mol
- (2001). "Performance of near-infrared spectroscopy in measuring local O2 consumption and blood flow in skeletal muscle". J Appl Physiol.
- Reference range list from Uppsala University Hospital ("Laborationslista"). Artnr 40284 Sj74a. Issued on April 22, 2008
- (February 2010). "Wrong molar hemoglobin reference values-a longstanding error that should be corrected". Annals of Hematology.
- (2001). "Performance of near-infrared spectroscopy in measuring local O2 consumption and blood flow in skeletal muscle". J Appl Physiol.
- Morkis IV, Farias MG, Scotti L. (2016). "Determination of reference ranges for immature platelet and reticulocyte fractions and reticulocyte hemoglobin equivalent.". Rev Bras Hematol Hemoter.
- Brugnara C, Schiller B, Moran J. (2006). "Reticulocyte hemoglobin equivalent (Ret He) and assessment of iron-deficient states.". Clinical and Laboratory Haematology.
- McClatchey, Kenneth D.. (November 28, 2002). "Clinical Laboratory Medicine". Lippincott Williams & Wilkins.
- [http://www.gpnotebook.co.uk/simplepage.cfm?ID=-637140985 gpnotebook.co.uk > blood constituents (reference range)] Retrieved on May 14, 2009
- [http://pathcuric1.swmed.edu/PathDemo/nrrt.htm Normal Reference Range Table] {{webarchive. link. (2011-12-25 from The University of Texas Southwestern Medical Center at Dallas. Used in Interactive Case Study Companion to Pathologic basis of disease.)
- (2011). "Normal range of mean platelet volume in healthy subjects: Insight from a large epidemiologic study". Thromb. Res..
- [http://www.labcareplus.org/docs/REFERENCE_RANGES.pdf Normal Values: RBC, Hgb, Hct, Indices, RDW, Platelets, and MPV (Conventional Units)] {{Webarchive. link. (2011-07-27 From labcareplus. Retrieved 4 nov, 2010)
- (1998). "[Platelet count and mean platelet volume in the Spanish population]". Med Clin (Barc).
- 003652
- {{EMedicine. article. 2084978. Antithrombin III
- "Home".
- (1967). "Normal erythrocyte sedimentation rate and age". Br Med J.
- (January 1983). "Simple rule for calculating normal erythrocyte sedimentation rate". British Medical Journal.
- [http://iadr.confex.com/iadr/2008Toronto/techprogram/abstract_106289.htm 2730 Serum C-Reactive Protein values in Diabetics with Periodontal Disease] {{webarchive. link. (2008-12-20 A.R. Choudhury, and S. Rahman, Birdem, Diabetic Association of Bangladesh, Dhaka, Bangladesh. (the diabetics were not used to determine the reference ranges))
- (March 2003). "Alpha-1 antitrypsin deficiency: an overlooked cause of late hemorrhagic disease of the newborn". Journal of Pediatric Hematology/Oncology.
- Derived from mass values using molar mass of 44324.5 g/mol
- Derived from molar values using molar mass of 44324.5 g/mol
- "Procalcitonin, Serum". [[Mayo Clinic]].
- "SSA – Clinical: SS-A/Ro Antibodies, IgG, Serum". Mayo Clinic Laboratories.
- "SSB – Clinical: SS-B/La Antibodies, IgG, Serum". Mayo Clinic Laboratories.
- "ADNA – Clinical: DNA Double-Stranded Antibodies, IgG, Serum". Mayo Clinic Laboratories.
- [http://www.chronolab.com/rheumatic/range.htm chronolab.com > Autoantibodies associated with rheumatic diseases > Reference ranges] {{Webarchive. link. (2013-07-30 Retrieved on April 29, 2010)
- "AMA – Clinical: Mitochondrial Antibodies (M2), Serum". Mayo Clinic Laboratories.
- (August 2005). "Serum free light chain ratio is an independent risk factor for progression in monoclonal gammopathy of undetermined significance". Blood.
- Derived from mass using molar mass of 25,106 g/mol
- (2002). "Plasma measurement of D-dimer levels for the early diagnosis of ischemic stroke subtypes". Archives of Internal Medicine.
- (May 2005). "D-dimer concentrations in normal pregnancy: new diagnostic thresholds are needed". Clinical Chemistry.
- (April 1980). "Age- and sex-related reference ranges for eight plasma constituents derived from randomly selected adults in a Scottish new town". Journal of Clinical Pathology.
- 0.8Derived from molar values by multiplying with the molar mass of 113.118 g/mol, and divided by 10.000 to adapt from μg/L to mg/dL
- Derived from mass values using molar mass of 180g/mol
- "Diabetes – Prevention".
- Derived from mass values using molar mass of 90.08 g/mol
- Derived from mass values using molar mass of 88.06 g/mol
- {{EMedicine. article. 2087982. Ketones
- Richard C. Dart. (2004). "Medical Toxicology". Lippincott Williams & Wilkins=year=2004.
- link. (2016-03-04 Revision 2 December 2010, Retrieved 5 May 2011)
- Amdisen A.. (1978). "Clinical and serum level monitoring in lithium therapy and lithium intoxication". J. Anal. Toxicol..
- R. Baselt, ''Disposition of Toxic Drugs and Chemicals in Man'', 8th edition, Biomedical Publications, Foster City, CA, 2008, pp. 851–54.
- (2013). "Rosen's Emergency Medicine – Concepts and Clinical Practice". Elsevier Health Sciences.
This article was imported from Wikipedia and is available under the Creative Commons Attribution-ShareAlike 4.0 License. Content has been adapted to SurfDoc format. Original contributors can be found on the article history page.
Ask Mako anything about Reference ranges for blood tests — get instant answers, deeper analysis, and related topics.
Research with MakoFree with your Surf account
Create a free account to save articles, ask Mako questions, and organize your research.
Sign up freeThis content may have been generated or modified by AI. CloudSurf Software LLC is not responsible for the accuracy, completeness, or reliability of AI-generated content. Always verify important information from primary sources.
Report