From Surf Wiki (app.surf) — the open knowledge base
Poverty in the United States
none

none
Proportion of Americans living below the poverty line in each county of the fifty states, the District of Columbia, and Puerto Rico according to the 2016–2020 American Community Survey]]

In the United States, poverty has both social and political implications. Based on poverty measures used by the Census Bureau (which exclude non-cash factors such as food stamps or medical care or public housing), America had 37 million people defined as living in poverty in 2023; this is 11 percent of the population. Some of the many causes include income, inequality, inflation, unemployment, debt traps and poor education. The majority of adults living in poverty are employed and have at least a high school education. Although the US is a relatively wealthy country by international standards, it has a persistently high poverty rate compared to other developed countries due in part to a less generous welfare system.
Efforts to alleviate poverty include New Deal-era legislation during the Great Depression, to the national war on poverty in the 1960s and poverty alleviation efforts during the 2008 Great Recession. The federal government has two departments which measure poverty. Under the Department of Commerce, the Census Bureau has been reporting the Official Poverty Measure (OPM) since the 1960s, while the Department of Health and Human Services defines income levels for which people are eligible for governmental anti-poverty assistance. The OPM includes cash assistance from programs like Supplemental Security Income and Temporary Assistance to Needy Families (welfare) as part of someone's income when reporting on how many people are in poverty. Since 2011 the Census Bureau has also been reporting a newer Supplemental Poverty Measure (SPM), which includes non-cash anti-poverty government assistance like Supplemental Nutrition Assistance Program (food stamps) and Medicaid (health care for the poor), and also accounts for regional differences in the cost of living. The SPM is considered a more comprehensive estimate of poverty.
For 2021, the percentage of Americans in poverty per the SPM was 7.8%, and per the OPM was 11.6%. By the OPM, the poverty threshold for 2021 for a single person was $13,800, and for a family of four was $27,700. In 2020, the World Bank reported that 0.25% of Americans lived below the international definition of extreme poverty, which is living on less than $2.15 per day in 2017 Purchasing Power Parity dollars. The SPM increased by 4.6% in 2022 to 12.4%, due to the ending of pandemic stimulus payments and tax credits, with around 15.3 million Americans falling into poverty over this time period according to the Center on Budget and Policy Priorities.
The 2020 assessment by the U.S. Census Bureau showed the percentage of Americans living in poverty for 2019 (before the COVID-19 pandemic) had fallen to some of the lowest levels ever recorded due to the record-long period of economic growth. However, between May and October 2020, some eight million people were put into poverty due to the economic effects of the COVID-19 pandemic and the ending of funds from the CARES Act.
History
Main article: History of poverty in the United States
Progressive era 1890s-1920s
Catalyzed by Henry George's 1873 book Progress and Poverty, public interest in how poverty could arise even in a time of economic progress arose in the 19th century with the rise of the Progressive movement. The Progressive American social survey began with the publication of Hull House Maps and Papers in 1895. This study included essays and maps collected by Florence Kelley and her colleagues working at Hull House and staff of the United States Bureau of Labor. It focused on studying the conditions of the slums in Chicago, including four maps color-coded by nationality and income level, which were based on Charles Booth's earlier pioneering work, Life and Labour of the People in London.
Another social reformer, Jacob Riis, documented the living conditions of New York tenements and slums in his 1890 work How the Other Half Lives.
Great Depression
A group especially vulnerable to poverty consisted of poor sharecroppers and tenant farmers in the South. These farmers consisted of around a fourth of the South's population, and over a third of these people were African Americans. Historian James T. Patterson refers to these people as the "old poverty," as opposed to the "new poverty" that emerged after the onset of the Great Depression.
During the Depression, the government did not provide any unemployment insurance, so people who lost jobs easily became impoverished. People who lost their jobs or homes lived in shantytowns or Hoovervilles. Many New Deal programs were designed to increase employment and reduce poverty. The Federal Emergency Relief Administration specifically focused on creating jobs for alleviating poverty. Jobs were more expensive than direct cash payments (called "the dole"), but were psychologically more beneficial to the unemployed, who wanted any sort of job for morale. Other New Deal initiatives that aimed at job creation and wellbeing included the Civilian Conservation Corps and Public Works Administration. Additionally, the institution of Social Security was one of the largest factors that helped to reduce poverty.
War on poverty
Main article: War on poverty
A number of factors helped start the national war on poverty in the 1960s. In 1962, Michael Harrington's book The Other America helped increase public debate and awareness of the poverty issue. The war on poverty embraced expanding the federal government's roles in education and health care as poverty reduction strategies, and many of its programs were administered by the newly established Office of Economic Opportunity. The war on poverty coincided with more methodological and precise statistical versions of studying poverty; the "official" U.S. statistical measure of poverty was only adopted in 1969.
21st century
_0504fIMG_3526_(51354888176).jpg)
In the 21st century, the Great Recession helped to raise the poverty levels again. , the number of people who were in poverty was approaching 1960s levels that led to the national war on poverty. The 2010 census data shows that half the population qualifies as poor or low income, with one in five millennials living in poverty. Academic contributors to The Routledge Handbook of Poverty in the United States postulate that new and extreme forms of poverty have emerged in the U.S. as a result of neoliberal structural adjustment policies and globalization, which have rendered economically marginalized communities as destitute "surplus populations" in need of control and punishment.
Many international bodies have emphasized the issues of poverty that the United States faces. A 2013 UNICEF report ranked the U.S. as having the second-highest relative child poverty rates in the developed world. , the IMF warned the United States that its high poverty rate needs to be tackled urgently by raising the minimum wage and offering paid maternity leave to women to encourage them to enter the labor force. In December 2017, the United Nations special rapporteur on extreme poverty and human rights, Philip Alston, undertook a two-week investigation on the effects of systemic poverty in the United States, and sharply condemned "private wealth and public squalor," declaring the state of Alabama to have the "worst poverty in the developed world." Alston's report was issued in May 2018 and highlights that 40 million people live in poverty and over five million live "in 'Third World' conditions."
According to a 2020 assessment by the U.S. Census Bureau, the percentage of Americans living in poverty for 2019 (before the COVID-19 pandemic) had fallen to some of lowest levels ever recorded due to the record-long economic growth period and stood at 11.1% (adjusted for smaller response during the pandemic). However, between May and October 2020, the economic effects of the COVID-19 pandemic, and the exhaustion of the funding provided by the CARES Act, dragged some eight million people into poverty. According to OECD, nearly 23 percent of American workers work in low-wage jobs, compared with 17 percent in Britain, 11 percent in Japan and 5 percent in Italy. In January 2021, according to the U.S. Census Bureau, 11.6 percent of the US population, or 37.9 million people, were living in poverty(using as an example a family of three earning less than $21,559). In his 2023 book Poverty, by America, sociologist Matthew Desmond writes that the poverty rate in the United States has not improved in half a century, with 11% of the population living in poverty in 2019, compared to 12% in 1970.
Social scientist Mark Robert Rank writes in 2023 that the last four decades has seen a retrenchment of the social safety net, with a reduction in eligibility and amount of benefits transferred. This, along with the failure of the US to provide universal child care, medical insurance and other social benefits as done in peer countries, has resulted in the US having much higher poverty rates by comparison.
The official poverty rate in the United States decreased to 10.6 percent in 2024. This figure is a reduction from 11.1 percent in 2023. In 2024, there were 35.9 million individuals living in poverty.
Measuring poverty==
There are several measures used by the U.S. federal government to measure poverty. The Census Bureau issues the poverty thresholds, which are generally used for statistical purposes—for example, to estimate the number of people in poverty nationwide each year and classify them by type of residence, race, and other social, economic, and demographic characteristics. The Department of Health and Human Services issues the poverty guidelines for administrative purposes—for instance, to determine whether a person or family is eligible for assistance through various federal programs. Both the poverty thresholds and poverty guidelines are updated yearly. More recently, the Census Bureau has begun using the Supplemental Poverty Measure as an additional statistic to measure poverty and supplement the existing measures.
Poverty income thresholds
The poverty income thresholds originate from work done by Mollie Orshansky, an American economist working for the Social Security Administration. Orshansky introduced the poverty thresholds in a 1963 Social Security Bulletin article, "Children of the Poor."
Orshansky based her thresholds on work she had done with the economy food plan while at the USDA. According to the USDA's 1955 Household Food Consumption Survey, families of three or more people spent one-third of their after-tax income on food. For these families, poverty thresholds were set at three times the cost of the economy food plan. Different procedures were used for calculating poverty thresholds for two-person households and persons living alone.
Her work appeared at an opportune moment, as President Johnson declared the war on poverty just six months later—and Orshansky's work offered a numerical way to measure progress in this effort. The newly formed Office of Economic Opportunity (OEO) adopted the Orshansky poverty thresholds for statistical, planning, and budgetary purposes in May 1965. Officials at the OEO were enthusiastic; as research director Joseph Kershaw remarked, "Mollie Orshansky says that when you have more people in the family, you need more money. Isn't that sensible?"
Officials at the Social Security Administration began to plan on how to adjust poverty thresholds for changes in the standard of living. The Bureau of the Budget resisted these changes, but formed an interagency committee that, in 1969, decided that poverty thresholds would be adjusted for inflation by being tied to the Consumer Price Index, rather than changes in the standard of living. In August 1969, the Bureau of the Budget designated these revised thresholds as the federal government's official definition of poverty.
Apart from minor changes in 1981 that changed the number of thresholds from 124 to 48, poverty thresholds have remained static for the past fifty years despite criticism that the thresholds may not be completely accurate. Although the poverty thresholds assumes that the average household of three spends one-third of its budget on food, more recent surveys have shown that that number has decreased to one-fifth in the 1980s and one-sixth by the 1990s. If the poverty thresholds were recalculated based on the share of household budgets taken by food costs as of 2008, the economy food budget multiplier would have been 7.8 rather than 3, greatly increasing the thresholds.
Federal poverty level
Poverty income guidelines
| Persons in | |||
|---|---|---|---|
| Family Unit | 48 Contiguous States | ||
| and D.C. | Alaska | Hawaii | |
| 1 | $15,650 | $19,550 | $17,990 |
| 2 | $21,150 | $26,430 | $24,320 |
| 3 | $26,650 | $33,310 | $30,650 |
| 4 | $32,150 | $40,190 | $36,980 |
| 5 | $37,650 | $47,070 | $43,310 |
| 6 | $43,150 | $53,950 | $49,640 |
| 7 | $48,650 | $60,830 | $55,970 |
| 8 | $54,150 | $67,710 | $62,300 |
| Each additional | |||
| person over 8 adds | $5,500 | $6,880 | $6,330 |
The poverty guidelines are a version of the poverty thresholds used by federal agencies for administrative purposes, such as determining eligibility for federal assistance programs. They are useful because poverty thresholds for one calendar year are not published until the summer of the next calendar year; poverty guidelines, on the other hand, allow agencies to work with more timely data.
Poverty guidelines were issued by the OEO starting in December 1965. After the Omnibus Budget Reconciliation Act of 1981, responsibility for issuing the guidelines was transferred to the Department of Health and Human Services. Poverty guidelines are also referred to as the "federal poverty level" (FPL), but the HHS discourages that term as ambiguous.
Supplemental Poverty Measure
In 1990, a Congressional committee requested the National Research Council (NRC) to conduct a study on revising the poverty measure. The NRC convened a panel, which published a 1995 report Measuring Poverty: A New Approach that concluded that the official poverty measure in the United States is flawed. The panel noted that the thresholds are the same irrespective of geography and stated that due to "rising living standards in the United States, most approaches for developing poverty thresholds (including the original one) would produce higher thresholds today than the current ones."
Additionally, the report suggested an alternative measure of poverty, which uses actual expenditure data to develop a threshold value for a family of four—and then update this threshold every year and according to geographic location. This alternative measure of poverty would also change the income calculation for a family, including certain non-cash benefits that satisfied "basic needs" such as food stamps and public housing while excluding "non-basic needs" such as medical costs and child care.
The work of the panel led to the development of the Supplemental Poverty Measure (SPM), which was intended to address some of the weaknesses of the existing poverty guidelines. In October 2014, the Census Bureau released a report describing the SPM and stated its intention to publish SPM measures every year. However, SPM is intended to "supplement" the existing poverty thresholds, not "replace" them, as poverty thresholds will remain the "official" Census Bureau measure and poverty guidelines will be derived only from the "official" poverty measures.
Unlike the poverty thresholds, and in line with the NRC recommendations, the SPM both includes certain non-cash benefits in a family's income and adjusts thresholds for differences in housing costs by geographic area. Additionally, the SPM thresholds are based on how much a "reference" family with two children spends on food, clothing, shelter, and utilities (FCSU).
Criticism
There is controversy over how accurate American poverty estimates are, with two sides wrangling over whether the official measures understate or overstate poverty.
Understating poverty
Many sociologists and government officials have argued that poverty in the United States is understated, meaning that there are more households living in actual poverty than there are households below the poverty threshold. A study taken in 2012 estimated that roughly 38% of Americans live "paycheck to paycheck."
In 1969, the Bureau of Labor Statistics put forward suggested budgets for adequate family living. 60% of working-class Americans lived below the "intermediate" budget, which allowed for the following:It assumes, for example, that the family will own:
:A toaster that will last for 33 years. :A vacuum cleaner that will last 14 years. :The budget assumes that a family will buy a two-year-old car and keep it for four years... Finally, the budget allows nothing whatever for savings.Given that the "intermediate" budget was fairly modest, observers questioned whether poverty levels were really capturing the full extent of prosperity, challenging the long-established view that most Americans had attained an affluent standard of living in the two decades following the end of the Second World War.
There have also been criticism of the methodology used to develop the U.S. poverty thresholds in the first place. The poverty thresholds used by the US government were originally developed during the Johnson administration's war on poverty initiative in the early 1960s. The thresholds were based on the cost of a food basket at the time, multiplied by three, under the assumption that the average family spent one-third of its income on food.
However, the poverty line only takes into account food purchases that were common more than 50 years ago. It assumes that Americans spend one third of their income on food; in fact, Americans typically spent less than one tenth of their after-tax income on food in 2000. For many families, the costs of housing, health insurance and medical care, transportation, and access to basic telecommunications take a much larger bite out of the family's income than a half century ago, yet none of these costs are considered in determining the official poverty thresholds. According to John Schwarz, a political scientist at the University of Arizona:The official poverty line today is essentially what it takes in today's dollars, adjusted for inflation, to purchase the same poverty-line level of living that was appropriate to a half century ago, in 1955 .... Updated thereafter only for inflation, the poverty line lost all connection over time with current consumption patterns of the average family. Quite a few families then didn't have their own private telephone, or a car, or even a mixer in their kitchen... The official poverty line has thus been allowed to fall substantially below a socially decent minimum, even though its intention was to measure such a minimum.
The issue of understating poverty is especially pressing in states with both a high cost of living and a high poverty rate such as California where the median home price in 2006 was $564,430. In the Monterey area, where the low-pay industry of agriculture is the largest sector in the economy and the majority of the population lacks a college education, the median home price was $723,790, requiring an upper middle class income only earned by roughly 20% of all households in the county. Such fluctuations in local markets are, however, not considered in the federal poverty threshold and may leave many who live in poverty-like conditions out of the total number of households classified as poor.
The Supplemental Poverty Measure, introduced in 2011, aims at providing a more accurate picture of the true extent of poverty in the United States by taking account of non-cash benefits and geographic variations. According to this new measure, 16% of Americans lived in poverty in 2011, compared with the official figure of 15.2%. With the new measure, one study estimated that nearly half of all Americans lived within 200% of the federal poverty line.
According to American economist Sandy Darity, Jr., "There is no exact way of measuring poverty. The measures are contingent on how we conceive of and define poverty. Efforts to develop more refined measures have been dominated by researchers who intentionally want to provide estimates that reduce the magnitude of poverty."
Matthew Desmond writes that the "overwhelming majority" of prisoners and former prisoners of the US prison system are extremely poor, and this group is largely omitted from poverty statistics and national surveys, "which means there are millions more poor Americans than official statistics let on."
Overstating poverty
According to Vox, there is a "near-unanimous consensus among poverty researchers that the official poverty measure (OPM) in the United States is a disaster" primarily because of its failure to include all anti-poverty government benefits as income when calculating whether or not an individual is poor. The OPM includes governmental anti-poverty cash aid like Supplemental Security Income and Welfare but does not include non-cash aid like Food stamps, housing assistance, and Medicaid (health care for the poor). Since 2011, the Census Bureau has started publishing the Supplemental Poverty Measure (SPM), which factors some non-cash benefits into the calculation, along with regional differences in cost of living.
Burkhauser et al. find that accounting for cash income, taxes, and major in-kind transfers and updating poverty thresholds for inflation show that a Full-income Poverty Rate based on President Johnson's standards fell from 19.5 percent to 2.3 percent over the 1963–2017 period.
Geography
Poverty in U.S. territories
The highest poverty rates in the United States are in the U.S. territories (American Samoa, Guam, the Northern Mariana Islands, Puerto Rico and the U.S. Virgin Islands). American Samoa has the lowest per capita income in the United States — it has a per capita income comparable to that of Botswana. In 2010, American Samoa had a per capita income of $6,311. The county or county-equivalent with the lowest per capita income in the United States is the Manu'a District in American Samoa (per capita income of $5,441). In 2018, Puerto Rico had the lowest median household income of any state/territory in the United States ($20,166). Also in 2018, Comerío, Puerto Rico had a median household income of $12,812 — the lowest median household income of any county or county-equivalent in the United States.
In the 2010 U.S. Census, Guam had a poverty rate of 22.9%, the Northern Mariana Islands had a poverty rate of 52.3%, and the U.S. Virgin Islands had a poverty rate of 22.4% (all higher than any U.S. state). In 2018, Puerto Rico had a poverty rate of 43.1%. In 2017, American Samoa had a poverty rate of 65% — the highest poverty rate of any state or territory in the United States.
Poverty in U.S. states
As of 2018, the state with the lowest poverty rate was New Hampshire (7.6% poverty rate). Other states with low poverty rates in 2018 include Hawaii (8.8% poverty rate), Maryland (9.0% poverty rate), and Minnesota (9.6% poverty rate). Among U.S. states, Mississippi had the highest poverty rate in 2018 (19.7% poverty rate), followed by Louisiana (18.65%), New Mexico (18.55%) and West Virginia (17.10%).
Poverty and demographics using Census OPM
Poverty and family status
Among married couple families: 5.8% lived in poverty. This number varied by race and ethnicity as follows:
- 5.4% of all white persons (which includes white Hispanics),
- 10.7% of all black persons (which includes black Hispanics),
- 14.9% of all Hispanic persons (of any race) living in poverty.
Among single-parent (male or female) families: 26.6% lived in poverty. This number varied by race and ethnicity as follows:
- 22.5% of all white persons (which includes white Hispanics),
- 44.0% of all black persons (which includes black Hispanics),
- 33.4% of all Hispanic persons (of any race) living in poverty.
Among individuals living alone: 19.1% lived in poverty. This number varied by race and ethnicity as follows:
- 18% of white persons (which includes white Hispanics),
- 28.9% of black persons (which includes black Hispanics)
- 27% of Hispanic persons (of any race) are living in poverty.
Poverty and race/ethnicity
As of 2010 about half of those living in poverty are non-Hispanic white (19.6 million). Non-Hispanic white children comprised 57% of all poor rural children.
In FY 2009, African American families comprised 33.3% of TANF families, non-Hispanic white families comprised 31.2%, and 28.8% were Hispanic.
As of 2024, 11.1% of the population lived in poverty for a total of 36.8 million people.
In 2009, the Census Bureau created the Supplemental Poverty Measure to measure for things left out by traditional poverty measures; according to the Official Congress website, it measures "having insufficient financial resources to achieve a specified standard of living. The SPM expands "this definition [of poverty] by including income and payroll taxes, tax credits and other noncash benefits like the Supplemental Nutritional Assistance Program (SNAP) and housing subsidies. Necessary expenses such as child support paid, work and child care and medical expenses are deducted from SPM resources,"
The SPM in 2022 sat at 12.9% which has risen from 12.4% in 2022 and continues to be above pre-pandemic rates of 11.8%
Poverty among Native Americans
Poverty is also notoriously high on Native American reservations (see Reservation poverty). 7 of the 11 poorest counties in per capita income (in the 50 states), including the 2 poorest in the 50 states, encompass Lakota Sioux reservations in South Dakota. This fact has been cited by some critics as a mechanism that enables the "kidnapping" of Lakota children by the state of South Dakota's Department of Social Services. The Lakota People's Law Project, among other critics, allege that South Dakota "inappropriately equates economic poverty with neglect ... South Dakota's rate of identifying "neglect" is 18% higher than the national average... In 2010, the national average of state discernment of neglect, as a percent of total maltreatment of foster children prior to their being taken into custody by the state, was 78.3%. In South Dakota the rate was 95.8%."
Poverty in the Pine Ridge Reservation in particular has had unprecedented effects on its residents' longevity. "Recent reports state the average life expectancy is 45 years old while others state that it is 48 years old for men and 52 years old for women. With either set of figures, that's the shortest life expectancy for any community in the Western Hemisphere outside Haiti, according to The Wall Street Journal."
In the 2013—2017 American Community Survey, Wounded Knee, South Dakota (located in the Pine Ridge Indian Reservation) had the 7th-lowest median household income out of all places in the 50 states/D.C./Puerto Rico.
Poverty among African Americans
In 2019, the poverty rate overall was 10.5% and for Blacks it was 18.8%, the lowest rates for both since the Census Bureau started keeping statistics in 1959. However, African Americans are over-represented in the poverty population: they represented 13.2% of the total population in the country, but 23.8% of the poverty population.
After Covid-19, the poverty rates of African Americans has fluctuated from 17.1% in 2022, a record low, to 18.4% in 2024 This translates to over 8 million recorded African Americans with incomes below the poverty line. The SPM has also seen a modest increase from 2022 to 2024, likely due to certain protections from Covid-19 being lifted
Poverty and LGBTQ+ status
With data collected from 35 states from 2014-2017, the Behavioral Risk Factor Surveillance System (BRFSS) survey shows that 21.6% of the LGBTQ+ population is living in poverty. The number varies depending on identity:
- 12.1% of gay men
- 17.9% of lesbian women
- 19.5% of bisexual men
- 29.4% of bisexual women
- 33.7% of transgender men
- 29.6% of transgender women, and
- 23.8% of gender nonconforming people.
For comparison, 13.4% of straight men and 17.8% of straight women are living in poverty.
Updated data from the Behavioral Risk Factor Surveillance System reported that the rate rose to 23% in 2020 . This updated data shows that poverty rates dropped for all genders and sexualities in 2021 except for lesbian women. The updates numbers, as of 2021 are as follows:
- 19.9% of bisexual women
- 17.5% of lesbian women
- 12.9% of bisexual men
- 10.3% of gay men
- The updated report includes 'transgender people' instead of a breakdown within there which sits at 21.2%
The rates for straight men living in poverty is 9.4% and straight women is 13.6%https://williamsinstitute.law.ucla.edu/wp-content/uploads/LGBT-Poverty-COVID-Feb-2023.pdf
Transgender poverty
The rate of poverty for the transgender community is larger than any other LGBTQ+ population. The 2015 U.S. Transgender Survey shows that this percentage varies depending on racial and ethnic identity:
- 43% Hispanic or Latino
- 41% Native American or American Indian
- 38% Black or African American
- 34% Middle Eastern
- 32% Asian
- 24% White
- 40% Multiracial
The percentage of those living in poverty also increases for transgender people with HIV (51%) and disabilities (45%).
The percentage of transgender respondents to the USTS in 2022 living in poverty was 34% but did not provide a racial breakdown of these rates.
Poverty and age

As of 2010, the US Census declared that 15.1% of the general population of the United States lived in poverty:
- 22% of all people under the age of 18
- 13.7% of those between the ages of 19-21
- 9% of all people either 65 or older
The Organisation for Economic Co-operation and Development (OECD) uses a different measure for poverty and declared in 2008 that child poverty in the US is 20% and poverty among the elderly is 23%. [[File:Homeless children in US 2006-10.png|thumb|[[Homeless children in the United States]]. The number of homeless children reached record highs in 2011, 2012, and 2013 at about three times their number in 1983.]]
Child poverty
Main article: Child poverty in the United States
In May 2009, the non-profit advocacy group Feeding America released a study based on 2005–2007 data from the U.S. Census Bureau and the Agriculture Department, which claims that 3.5 million children under the age of 5 are at risk of hunger in the United States. The study claims that in 11 states, Louisiana, which has the highest rate, followed by North Carolina, Ohio, Kentucky, Texas, New Mexico, Kansas, South Carolina, Tennessee, Idaho and Arkansas, more than 20 percent of children under 5 are allegedly at risk of going hungry. (receiving fewer than 1,800 calories per day).
In 2012, 16.1 million American children were living in poverty. Outside of the 49 million Americans living in food-insecure homes, 15.9 million of them were children. In 2013, child poverty reached record high levels in the U.S., with 16.7 million children living in food insecure households. Many of the neighborhoods these children live in lack basic produce and nutritious food. 47 million Americans depend on food banks, more than 30% above 2007 levels. Households headed by single mothers are most likely to be affected. 30 percent of low-income single mothers cannot afford diapers. Inability to afford this necessity can cause a chain reaction, including mental, health, and behavioral problems. Some women are forced to make use of one or two diapers, using them more than once. This causes rashes and sanitation problems as well as health problems. Without diapers, children are unable to enter into daycare. The lack of childcare can be detrimental to single mothers, hindering their ability to obtain employment. Worst affected are Oregon, Arizona, New Mexico, Florida, and the District of Columbia, while North Dakota, New Hampshire, Virginia, Minnesota and Massachusetts are the least affected. 31 million low-income children received free or reduced-price meals daily through the National School lunch program during the 2012 federal fiscal year. Nearly 14 million children are estimated to be served by Feeding America with over 3 million being of the ages of 5 and under.
A 2014 report by the National Center on Family Homelessness states the number of homeless children in the U.S. has reached record levels, calculating that 2.5 million children, or one child in every 30, experienced homelessness in 2013. High levels of poverty, lack of affordable housing and domestic violence were cited as the primary causes. A 2017 peer-reviewed study published in Health Affairs found that the U.S. has the highest levels of child mortality among 20 OECD countries.
Racial inequality is also visible when it comes to discerning poverty among children in America. In 2021, Children's Defense Fund estimated that 71% of children living in poverty are children of color.
Poverty is also associated with expanded adverse childhood experiences, such as witnessing violence, feeling discrimination, and experiencing bullying. According to a 2016 study by the Urban Institute, teenagers in low income communities are often forced to join gangs, save school lunches, sell drugs or exchange sexual favors because they cannot afford food.
According to the Save the Children fund, food insecurity among families with children as increased by two-thirds since March 2020. The fund further states that "the U.S. continues to lag behind most peer countries in meeting the needs of children and families during the pandemic".
Children living in poverty may also experience many health and developmental problems due to food insecurity and malnutrition. Children in low socioeconomic statuses are shown to have more gray matter which affects educational and life outcomes. They may have a lower immune systems due to malnutrition, and they are more likely to have chronic disease like asthma.
Child poverty more than doubled from 5.2% in 2021 to 12.4% in 2022 largely as the result of pandemic aid running out, in particular the expansion of the child tax credit.
Poverty and incarceration
Poverty and disability
Disabled people in the United States are twice as likely to live in poverty due to persistent discrimination, structural and institutional barriers to economic security, and employment disparities. In 2019, 21.6 percent of disabled people were considered poor under the Census’s Supplemental Poverty Measure. People with disabilities experience income disparities in the form of a wage gap that heavily contributes to the increased risk of poverty. In 2020, workers with disabilities (ages 18–64) were paid, on average, 74 cents for every dollar paid to their non-disabled peers. People with disabilities face additional challenges including an added cost of living, a lack of affordable and accessible transportation and housing, and a lack of access to affordable support and services that contribute to their increased risk of experiencing poverty. Income disparities, employment challenges, and additional barriers can cause difficulties in affording rent, as 4 in 10 disabled people in the United States are struggling to afford their rent. Additionally, people with disabilities are three times more likely to not have enough to eat and are almost twice as likely to be unable to pay monthly bills.
Effects of poverty
.jpg)
Education
Poverty affects individual access to quality education.
Health disparities
Factors in poverty
There are numerous factors related to poverty in the United States.
- Income has a high correlation with educational levels. In 2007, the median earnings of household headed by individuals with less than a 9th grade education was $20,805 while households headed by high school graduates earned $40,456, households headed by holders of bachelor's degrees earned $77,605, and families headed by individuals with professional degrees earned $100,000. Federal Reserve Chair Janet Yellen stated in 2014: "Public funding of education is another way that governments can help offset the advantages some households have in resources available for children. One of the most consequential examples is early childhood education. Research shows that children from lower-income households who get good-quality pre-Kindergarten education are more likely to graduate from high school and attend college as well as hold a job and have higher earnings, and they are less likely to be incarcerated or receive public assistance."
- In many cases, poverty is caused by job loss. In 2007, the poverty rate was 21.5% for individuals who were unemployed, but only 2.5% for individuals who were employed full-time.
- Children growing up in female-headed families with no spouse present have a poverty rate over four times that of children in married-couple families.{{cite web | access-date =20 December 2020}}
- Income levels vary with age. For example, the median 2009 income for households headed by individuals age 15–24 was only $30,750, but increased to $50,188 for household headed by individuals age 25–34 and $61,083 for household headed by individuals 35–44. Work experience and additional education may be factors.
- Income levels vary along racial/ethnic lines: 21% of all children in the United States live in poverty, about 46% of black children and 40% of Latino children. The poverty rate is 9.9% for black married couples, and only 30% of black children are born to married couples (see Marriage below). The poverty rate for native born and naturalized whites is identical (9.6%). On the other hand, the poverty rate for naturalized blacks is 11.8% compared to 25.1% for native born blacks, suggesting race alone does not explain income disparity. Not all minorities have low incomes. Asian families have higher incomes than all other ethnic groups. For example, the 2005 median income of Asian families was $68,957 compared to the median income of white families of $59,124. Asians, however, report discrimination occurrences more frequently than blacks. Specifically, 31% of Asians reported employment discrimination compared to 26% of blacks in 2005.
- Policies that address income and wealth inequality (i.e., policies that transfer money from higher-income and more wealthy families to less wealthy families) bear significantly on poverty. Economist Jared Bernstein and Elise Gould of the Economic Policy Institute suggest that poverty could have decreased significantly if inequality had not increased over the last few decades. Economist Larry Summers estimated that at 1979 levels of income inequality, the bottom 80% of families would have an average of $11,000 more per year in income in 2014.
- According to Mark Robert Rank, the high rates of poverty in the U.S. cannot be explained as simply the result of personal and behavioral failures of individuals, but rather structural failures at the economic and political levels. The free market economy of the U.S. mostly produces jobs that are inadequate in supporting families, and the very nature of capitalism itself is to make certain that a "modest level" of unemployment always exists. Both of these, combined with failings at the policy level to support the economically vulnerable, have ensured that "there are not nearly enough opportunities and resources to support the entire population." Matthew Desmond writes that the U.S. "offers some of the lowest wages in the industrialized world," which has "swelled the ranks of the working poor, most of whom are thirty-five or older."
- The relationship between tax rates and poverty is disputed. A study comparing high tax Scandinavian countries with the U. S. suggests high tax rates are inversely correlated with poverty rates. The poverty rate, however, is low in some low tax countries like Switzerland. A comparison of poverty rates between states reveals that some low tax states have low poverty rates. For example, New Hampshire has the lowest poverty rate of any state in the U. S., and has very low taxes (46th among all states). It is true however that both Switzerland and New Hampshire have a very high household income and other measures offsetting the lack of taxation. For example, Switzerland has Universal Healthcare and a free system of education for children as young as four years old. New Hampshire has no state income tax or sales tax, but does have the nation's highest property taxes.[[File:US incarceration timeline.gif|thumb|Total [[incarceration in the United States|incarceration]] in the United States by year]]
- The poor in the United States are incarcerated at a much higher rate than their counterparts in other developed nations, with penal confinement being, according to sociologist Bruce Western, "commonplace for poor men of working age." Scholars assert that the transformation of the already anemic U.S. welfare state to a post-welfare punitive state, along with neoliberal structural adjustment policies, the globalization of the U.S. economy and the dominance of global financial institutions, have created more extreme forms of "destitute poverty" in the U.S. which must be contained by expanding the criminal justice system and the carceral state into every aspect of the lives of the poor, which, according to Reuben Jonathan Miller and Emily Shayman, has resulted in "transforming what it means to be poor in America."
- Matthew Desmond writes that in 2020 around 18 million people, including more than 5 million children, lived in "deep poverty" (the poverty line cut in half), which amounted to an annual income below $6,380 for individuals and $13,100 for family of four.
- A 2012 study by the Urban Institute found that 75% of adults in "deep poverty" had not worked in the previous year.
- According to a 2017 academic study by MIT economist Peter Temin, Americans trapped in poverty live in conditions rivaling the developing world, and are forced to contend with substandard education, dilapidated housing, and few stable employment opportunities. A 2017 study published in *The American Journal of Tropical Medicine and Hygiene * found that hookworm, a parasite that thrives on extreme poverty, is flourishing in the Deep South. A report on the study in The Guardian stated:{{cquote|Scientists in Houston, Texas, have lifted the lid on one of America’s darkest and deepest secrets: that hidden beneath fabulous wealth, the US tolerates poverty-related illness at levels comparable to the world’s poorest countries. More than one in three people sampled in a poor area of Alabama tested positive for traces of hookworm, a gastrointestinal parasite that was thought to have been eradicated from the US decades ago.
- Some 12 million Americans live with diseases associated with extreme poverty.
- Poverty may be fueling the Obesity epidemic, with the poorest states, counties and neighborhoods having the highest death rates from heart disease, stroke, diabetes and other diseases related to obesity. For every $10,000 poorer a neighborhood is, the death rate of heart disease increases by 10%
- In poor and disadvantaged neighborhoods, landlord]]s extract higher profits from tenants than from their counterparts in affluent communities, which Matthew Desmond and Nathan Wilmers describe in a 2019 article published in the American Journal of Sociology as tenant exploitation ("overcharging renters relative to the market value of their home"). Landlords perceive operating in poorer neighborhoods as a greater risk, even though losses are rare, and therefore raise rents on all tenants, which "contributes to their economic scarcity and hardship and is a source of residential insecurity, eviction, and homelessness." The authors argue that the higher profit margins implies that the lack of affordable housing in these areas is driven in part by "the market dynamics of landlords" in addition to "supply levels or regulatory barriers."
Public beliefs about causes of poverty
In terms of popular opinion, a poll in 2019 showed a sharp divide along ideological lines. Strong liberals believe that the chief causes of poverty are discrimination (51%), an unfair economic system (48%), and lack of educational opportunities (48%). On the other hand, strong conservatives believe the chief causes are poor life choices (60%), a lack of work ethic (52%), breakdown of families (47%), and drugs and alcohol (47%).
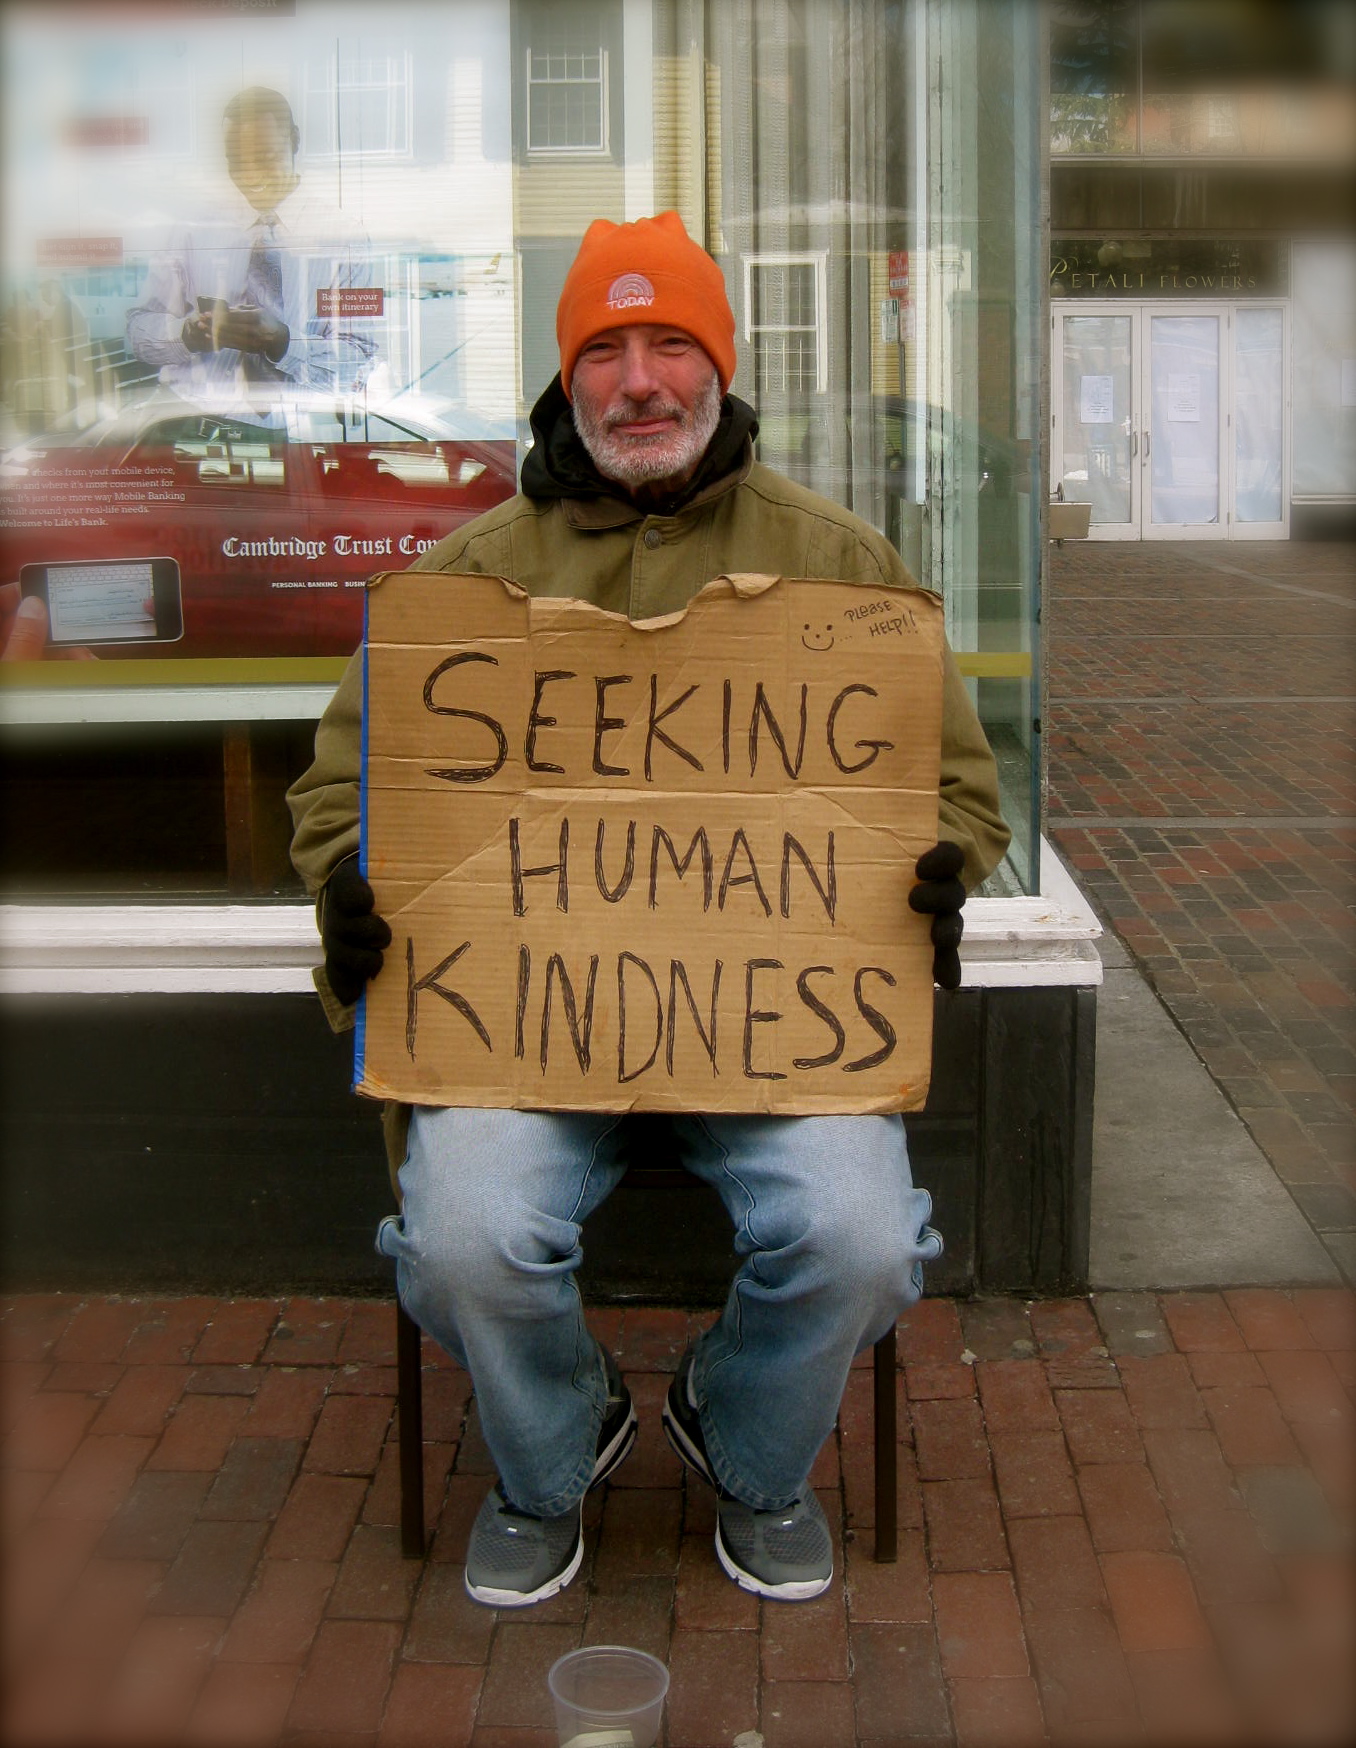
Fighting poverty
_0504IMG_3575_(51355112013).jpg)
There have been governmental and nongovernmental efforts to reduce poverty and their effects. These range in scope from neighborhood efforts to campaigns with a national focus. They target specific groups affected by poverty such as children, people who are autistic, immigrants, or people who are homeless. Efforts to alleviate poverty use a disparate set of methods, such as advocacy, education, social work, legislation, direct service or charity, and community organizing.
Recent debates have centered on the need for policies that focus on both "income poverty" and "asset poverty." Advocates for the approach argue that traditional governmental poverty policies focus solely on supplementing the income of the poor through programs such as Temporary Assistance for Needy Families (TANF, formerly Aid to Families with Dependent Children, AFDC) and Supplemental Nutrition Assistance Program (SNAP, formerly the Food Stamp Program). According to the CFED 2012 Assets & Opportunity Scorecard, 27 percent of households – nearly double the percentage that are income poor – are living in "asset poverty." These families do not have the savings or other assets to cover basic expenses (equivalent to what could be purchased with a poverty level income) for three months if a layoff or other emergency leads to loss of income. Since 2009, the number of asset poor families has increased by 21 percent from about one in five families to one in four families. In order to provide assistance to such asset poor families, Congress appropriated $24 million to administer the Assets for Independence Program under the supervision of the US Department for Health and Human Services. The program enables community-based nonprofits and government agencies to implement Individual Development Account or IDA programs, which are an asset-based development initiative. Every dollar accumulated in IDA savings is matched by federal and non-federal funds to enable households to add to their assets portfolio by buying their first home, acquiring a post-secondary education, or starting or expanding a small business.
Additionally, the Earned Income Tax Credit (EITC or EIC) is a credit for people who earn low-to-moderate incomes. This credit allows them to get money from the government if their total tax outlay is less than the total credit earned, meaning it is not just a reduction in total tax paid but can also bring new income to the household. The Earned Income Tax Credit is viewed as the largest poverty reduction program in the United States. There is an ongoing debate in the U.S. about what the most effective way to fight poverty is, through the tax code with the EITC, or through the minimum wage laws.
Government safety-net programs put in place since the war on poverty have helped reduce the poverty rate from 26% in 1967 to 16% in 2012, according to a Supplemental Poverty Model (SPM) created by Columbia University, while the official U.S. Poverty Rate has not changed, as the economy by itself has done little to reduce poverty. According to the 2013 Columbia University study which created the (SPM) method of measuring poverty, without such programs the poverty rate would be 29% today. An analysis of the study by Kevin Drum suggests the American welfare state effectively reduces poverty among the elderly but provides relatively little assistance to the working-age poor. A 2014 study by Pew Charitable Trusts shows that without social programs like food stamps, social security and the federal EITC, the poverty rate in the U.S. would be much higher. Nevertheless, the U.S. has the weakest social safety net of all developed nations. Sociologist Monica Prasad of Northwestern University argues that this developed because of government intervention rather than lack of it, which pushed consumer credit for meeting citizens' needs rather than applying social welfare policies as in Europe.
Some argue that increasing diversity among members of legislative bodies would better enable government efforts to reduce poverty.
Following the 2025 U.S. government shutdown, the Trump administration decided on November 1 to end the nation's vital Supplemental Nutrition Assistance Program (SNAP) for the first time since its creation in 1964. The food assistance program provides food for nearly 42 million Americans - or one in eight people.
Notes
References
References
- "Poverty in the United States: 2023".
- Adams, R. H., (2004). Economic growth, inequality, and poverty: Estimating the growth elasticity of poverty, World Development 32(12), p. 1989-2014.
- Western, B. & Pettit, B., (2010). [https://www.jstor.org/stable/20749838#metadata_info_tab_contents Incarceration and social inequality.] Daedalus, 139(3), 8-19
- Zweig, Michael. (2004). "What's Class Got to do With It? : Society in the U.S.A. in the Twenty-first Century". ILR Press.
- (25 August 2023). "Poverty, not the poor". Science Advances.
- "About the Supplemental Poverty Measure".
- Matthews, Dylan. (2023-03-10). "Why even brilliant scholars misunderstand poverty in America".
- (2022-09-13). "Poverty in the United States: 2021". Census Bureau.
- Rank, Mark Robert. (2023). "The Poverty Paradox: Understanding Economic Hardship Amid American Prosperity". [[Oxford University Press]].
- "Fact Sheet: An Adjustment to Global Poverty Lines".
- "Country Profile: United States".
- . (September 12, 2023). ["Income, Poverty and Health Insurance Coverage in the United States: 2022"](https://www.census.gov/newsroom/press-releases/2023/income-poverty-health-insurance-coverage.html).
- Picchi, Aimee. (September 12, 2023). "America's poverty rate soared last year. Children were among the worst hit.". CBS News.
- "Hull House Maps and Papers".
- O'Connor, Alice. (2001). "Poverty Knowledge: Social Science, Social Policy, and the Poor in Twentieth-Century U.S. History". Princeton University Press.
- (2011-01-10). "Riis, Jacob".
- (2011-01-20). "Great Depression: American Social Policy".
- PATTERSON, James T.. (2009-06-30). "America's Struggle against Poverty in the Twentieth Century". Harvard University Press.
- "Economics & Poverty".
- "::: Federal Emergency Relief Administration (FERA) Photographs of King County, 1933-1935 :::".
- [https://www.washingtonpost.com/blogs/govbeat/wp/2013/11/08/poverty-in-13-states-is-worse-than-we-thought/?tid=article_nextstory Poverty in 13 states is worse than we thought] Washington Post November 8, 2013
- Gabe, Thomas. (January 29, 2015). "Poverty in the United States: 2013".
- (April 13, 2009). "US poverty on track to post record gain in 2009". Associated Press.
- [http://www.cbsnews.com/news/census-data-half-of-us-poor-or-low-income/ Census data: Half of U.S. poor or low income]. ''[[CBS News]],'' December 15, 2011. Retrieved February 10, 2014.
- Jana Kasperkevic (December 26, 2014). [https://www.theguardian.com/money/us-money-blog/2014/dec/26/us-census-bureau-report-one-in-five-millennials-poverty One in five millennials lives in poverty, report finds]. ''[[The Guardian]].'' Retrieved December 26, 2014.
- (2015). "The Routledge Handbook of Poverty in the United States". [[Routledge]].
- Fisher, Max (April 15, 2013). [https://www.washingtonpost.com/blogs/worldviews/wp/2013/04/15/map-how-35-countries-compare-on-child-poverty-the-u-s-is-ranked-34th/ Map: How 35 countries compare on child poverty (the U.S. is ranked 34th)]. ''[[The Washington Post]].'' Retrieved February 16, 2014. See also: [http://www.unicef-irc.org/publications/pdf/rc11_eng.pdf Child well-being in rich countries: A comparative overview]. ''[[UNICEF]] office of Research.'' p. 7.
- [https://www.bbc.com/news/business-36599316 IMF warns the US over high poverty]. BBC, June 22, 2016.
- Alston, Philp. (December 15, 2017). "Statement on Visit to the USA, by Professor Philip Alston, United Nations Special Rapporteur on extreme poverty and human rights". [[Office of the United Nations High Commissioner for Human Rights.
- (June 4, 2018). ""Contempt for the poor in US drives cruel policies," says UN expert". OHCHR.
- Horsley, Scott. (2020-09-16). "American Incomes Were Rising, Until The Pandemic Hit". [[NPR]].
- Jason DeParle. (October 15, 2020). "8 Million Have Slipped Into Poverty Since May as Federal Aid Has Dried Up". [[The New York Times]].
- (2023). "Why Poverty Persists in America". The New York Times.
- (2023). "The Poverty Paradox: why is there still so much economic hardship in the US?".
- Lee, Juhohn. (March 7, 2023). "37.9 million Americans are living in poverty, according to the U.S. Census. But the problem could be far worse.". [[CNBC]].
- Nova, Annie. (March 28, 2023). "5 alarming stats on U.S. economic inequality in Pulitzer Prize-winning author's new book". [[CNBC]].
- Rank, Mark Robert. (2023). "The Poverty Paradox: Understanding Economic Hardship Amid American Prosperity". [[Oxford University Press]].
- "Poverty in 2024".
- "How the Census Bureau Measures Poverty". [[United States Census Bureau]].
- "2015 POVERTY GUIDELINES". [[United States Department of Health and Human Services]].
- "Poverty thresholds and poverty guidelines". University of Wisconsin–Madison Institute for Research on Poverty.
- "The Supplemental Poverty Measure (SPM) and Children: How and Why the SPM and Official Poverty Estimates Differ".
- Orshansky, Mollie. "Children of the Poor". Social Security Bulletin.
- "Remembering Mollie Orshansky—The Developer of the Poverty Thresholds".
- (2015-11-23). "History of Poverty Thresholds".
- Sidel, Ruth. (1998-11-01). "Keeping Women and Children Last Revised". Penguin.
- (1993). "The Forgotten Americans". W. W. Norton & Company.
- Blank, Rebecca M.. (July 17, 2008). "Why the United States Needs an Improved Measure of Poverty". Brookings.
- "Poverty Guidelines".
- (1995). "Measuring Poverty: A New Approach C. Citro and R. Michaels (Eds.)". United States Census Bureau.
- "Poverty definition flawed, more accurate measure needed".
- Short, Kathleen. (2015-03-10). "The Supplemental Poverty Measure: 2013".
- Gabe, Thomas. (2015-01-29). "Poverty in the United States: 2013".
- Adams, J.Q.. (2001). "Dealing with Diversity". Kendall/Hunt Publishing Company.
- (July 23, 2012). "Many Families Struggle to Make Ends Meet, But Those With a Financial Plan Feel and Do Better · Consumer Federation of America".
- Hodgson, Godfrey. (2005). "America in Our Time: From World War II to Nixon--what Happened and why". Princeton University Press.
- (2010-10-20). "That Seventies Show". The Nation.
- Fisher, Gordon M.. "The Development of the Orshansky Poverty Thresholds and Their Subsequent History as the Official U.S. Poverty Measure". U.S. Census Bureau.
- Fisher, Gordon M.. (2008). "Remembering Mollie Orshansky – The Developer of the Poverty Thresholds". U.S. Social Security Administration Office of Retirement and Disability Policy.
- Clauson, Annette. (September 2000). "Despite Higher Food Prices, Percent of U.S. Income Spent on Food Remains Constant". Amber Waves (U.S. Department of Agriculture Economic Research Service).
- Schwarz, John E.. (2005-01-02). "Freedom Reclaimed: Rediscovering the American Vision". JHU Press.
- (June 2016). "California median home price".
- "Monterey County income distribution".
- (September 13, 2016). "The Supplemental Poverty Measure: 2015". [[United States Census Bureau]].
- (2011-11-17). "New poverty measure highlights positive effect of government assistance".
- (November 7, 2011). "News Tip: Census Bureau's New Measure of Poverty Misses the Mark, Say Duke Experts".
- Desmond, Matthew. (2023). "[[Poverty, by America]]". Crown Publishing Group.
- (2022-07-19). "The Supplemental Poverty Measure: Its Core Concepts, Development, and Use". [[Congressional Research Service]].
- (December 2019). "Evaluating the Success of President Johnson's war on poverty: Revisiting the Historical Record Using a Full-Income Poverty Measure". The National Bureau of Economic Research.
- http://www.gao.gov/new.items/d10240r.pdf ''Poverty Determination In U.S. Insular Areas.'' Retrieved August 30, 2019.
- [https://www.epa.gov/sites/default/files/2017-04/documents/american_samoa_visible_difference_final_report_2017.pdf epa.gov] EPA. Making a Visible Difference In American Samoa (Final Report). Retrieved August 30, 2019.
- American FactFinder - American Samoa. Profile of Selected Economic Characteristics: 2010.
- link. (February 14, 2020 American FactFinder. Profile of Selected Economic Characteristics: 2010. 2010 American Samoa Demographic Profile Data. [Geography set to "Manu'a District, American Samoa"]. Retrieved August 30, 2019.)
- https://www.census.gov/quickfacts/fact/table/PR/ U.S. Census Bureau. QuickFacts - Puerto Rico. Retrieved July 4, 2020.
- American FactFinder. U.S. Census Bureau. Selected economic characteristics - Commonwealth of the Northern Mariana Islands (2010). (URL unavailable).
- https://www.census.gov/quickfacts/fact/table/comeriomunicipiopuertorico/ U.S. Census Bureau. QuickFacts - Comerio municipio, Puerto Rico. Retrieved July 4, 2020.
- link. (February 14, 2020 Census.gov. American Factfinder. Guam. Poverty Status in 2009 by Age. Retrieved August 30, 2019.)
- link. (February 14, 2020 Census.gov. American Factfinder. Northern Mariana Islands. Poverty Status in 2009 by Age. Retrieved August 30, 2019.)
- link. (February 14, 2020 Census.gov. American Factfinder. U.S. Virgin Islands. Poverty Status in 2009 by Age. Retrieved August 30, 2019.)
- (March 2, 2017). "American Samoa Governor Says Small Economies 'Cannot Afford Any Reduction In Medicaid' {{!}} Pacific Islands Report". www.pireport.org.
- https://www.census.gov/quickfacts/NH Census.gov. Quick Facts. New Hampshire. Retrieved July 4, 2020.
- https://www.census.gov/quickfacts/HI Census.gov. Quick Facts. Hawaii. Retrieved July 4, 2020.
- https://www.census.gov/quickfacts/MD Census.gov. Quick Facts. Maryland. Retrieved July 4, 2020.
- https://www.census.gov/quickfacts/MN Census.gov. Quick Facts. Minnesota. Retrieved July 4, 2020.
- https://www.census.gov/quickfacts/MS Census.gov. Quick Facts. Mississippi. Retrieved July 4, 2020.
- U.S. Census Bureau. Current Population Survey. ''Persons in Families by Family Structure, Age, and Sex, Iterated by Income-to-Poverty Ratio and Race: 2007: [http://pubdb3.census.gov/macro/032008/pov/new02_100_01.htm Below 100% of Poverty – All Races] {{webarchive. link. (September 30, 2008.'')
- U.S. Census Bureau. Current Population Survey. ''People in Families by Family Structure, Age, and Sex, Iterated by Income-to-Poverty Ratio and Race: 2007: [http://pubdb3.census.gov/macro/032008/pov/new02_100_03.htm Below 100% of Poverty – White Alone] {{webarchive. link. (April 13, 2009 .'')
- (August 26, 2008). "Poverty 3-Part 100_06". Pubdb3.census.gov.
- (August 26, 2008). "Poverty 2-Part 100_09". Pubdb3.census.gov.
- (August 26, 2008). "Poverty 1-Part 100_03". Pubdb3.census.gov.
- (August 26, 2008). "Poverty 1-Part 100_06". Pubdb3.census.gov.
- (August 26, 2008). "Poverty 1-Part 100_09". Pubdb3.census.gov.
- "[https://www.census.gov/content/dam/Census/library/publications/2015/demo/p60-252.pdf Income and Poverty in the United States: 2014]". U.S. Census Bureau
- "[http://www.prb.org/Articles/2009/ruralchildpoverty.aspx Poverty Is a Persistent Reality for Many Rural Children in U.S.] {{Webarchive. link. (March 26, 2010 ", William O'Hare (September 2009), Population Reference Bureau.)
- "[http://www.acf.hhs.gov/programs/ofa/character/fy2009/indexfy09.htm Characteristics and Financial Circumstances of TANF Recipients – Fiscal Year 2009] {{Webarchive. link. (July 20, 2012 ". United States Department of Health and Human Services.)
- Bureau, US Census. "Poverty in the United States: 2023".
- "The Supplemental Poverty Measure: Its Core Concepts, Development, and Use".
- Bureau, US Census. "Poverty Measure That Includes Noncash Government Assistance Increased to 12.9% in 2023, Up From 12.4% in 2022".
- Bureau, US Census. "Poverty Measure That Includes Noncash Government Assistance Increased to 12.9% in 2023, Up From 12.4% in 2022".
- Statistics derived from U.S. Census Bureau data; U.S. Department of Commerce, Bureau of Economic Analysis, Survey of Current Business; and DataQuick Information Systems, a public records database company located in La Jolla, San Diego, CA.
- "Lakota People's Law Project".
- "Archived copy".
- "Pine Ridge Statistics".
- link. (February 14, 2020 U.S. Census Bureau. American FactFinder. Income in the past 12 months (in 2017 inflation-adjusted dollars). 2013-2017 American Community Survey 5-year estimates. ["Geography" set to "All Places within United States and Puerto Rico".] Retrieved August 30, 2019.)
- Creamer, John. (2020-09-15). "Poverty Rates for Blacks and Hispanics Reached Historic Lows in 2019". [[United States Census Bureau]].
- Editor. (2025-10-06). "The Racial Gap in Poverty Rates in the United States Is Expanding".
- Editor. (2025-10-06). "The Racial Gap in Poverty Rates in the United States Is Expanding".
- thisisloyal.com, Loyal {{!}}. "LGBT Poverty in the United States".
- thisisloyal.com, Loyal {{!}}. "LGBT Poverty in the United States".
- thisisloyal.com, Loyal {{!}}. "LGBT Poverty in the United States".
- Wilson, Bianca. (February 2023). "LGBT POVERTY IN THE UNITED STATES Trends at the Onset of COVID-19".
- "2015 U.S. Transgender Survey Report".
- James, Sandy. (December 2016). "2015 U.S. Transgender Survey".
- "OECD (2008), Growing Unequal? : Income Distribution and Poverty in OECD Countries : COUNTRY NOTE: UNITED STATES".
- Bassuk, E.L., ''et al.'' (2011) [http://www.homelesschildrenamerica.org/media/NCFH_AmericaOutcast2010_web.pdf ''America's Youngest Outcasts: 2010''] {{Webarchive. link. (March 22, 2016 (Needham, MA: The National Center on Family Homelessness) page 20)
- [https://www.csmonitor.com/USA/Society/2011/1213/Homeless-children-at-record-high-in-US.-Can-the-trend-be-reversed "Homeless children at record high in US. Can the trend be reversed?"] ''Christian Science Monitor'', December 13, 2011
- [http://www.coalitionforthehomeless.org/pages/state-of-the-homeless-2012 "State of the Homeless 2012"] ''Coalition for the Homeless'', June 8, 2012
- [https://www.washingtonpost.com/local/600-homeless-children-in-dc-and-no-one-seems-to-care/2013/02/08/a728a0ea-722b-11e2-8b8d-e0b59a1b8e2a_story.html "600 homeless children in D.C., and no one seems to care"] ''Washington Post'', February 8, 2013
- (May 7, 2009). "3.5M Kids Under 5 On Verge Of Going Hungry
Study: 11 Percent Of U.S. Households Lack Food For Healthy Lifestyle". CBS NEWS. - "Hunger and Poverty Facts and Statistics".
- (2013-09-11). "Poverty in 2013: When Even Diapers Are a Luxury". The Nation.
- Walker, Duncan. (March 6, 2013). "The children going hungry in America". BBC News.
- "Child Hunger Facts".
- David Crary and Lisa Leff (November 17, 2014). [http://hosted.ap.org/dynamic/stories/U/US_HOMELESS_CHILDREN?SITE=AP&SECTION=HOME&TEMPLATE=DEFAULT&CTIME=2014-11-17-00-37-34 New Report: Child Homelessness on the Rise in US]. ''[[The Associated Press]].'' Retrieved November 17, 2014.
- Howard, Jacqueline. (January 8, 2018). "Among 20 wealthy nations, US child mortality ranks worst, study finds". CNN.
- Dawson, Ben. "The State of America's Children 2021 - Child Poverty".
- Cronholm PF, Forke CM, Wade R, Bair-Merritt MH, Davis M, Harkins-Schwarz M, Pachter LM, Fein JA. [https://txicfw.socialwork.utexas.edu/wp-content/uploads/2017/02/Philly-ACES-revised_2015-1.pdf Adverse Childhood Experiences: Expanding the concept of adversity]. American Journal of Preventive Medicine. 2015 Sep;49(3):354-61
- [https://www.theguardian.com/us-news/2016/sep/12/teens-america-hunger-food-poverty US teens often forced to trade sex work for food, study finds]. ''[[The Guardian]]''. September 12, 2016.
- (February 23, 2021). "Child Hunger in America".
- (2016). "Child Poverty in the United States Today: Introduction and Executive Summary". Academic Pediatrics.
- (1993). "Malnourished Children in the United States: Caught in the Cycle of Poverty". Springer.
- Schneider, Mike. (September 12, 2023). "Child poverty in the US jumped and income declined in 2022 as coronavirus pandemic benefits ended". [[Associated Press]].
- "Disability and Socioeconomic Status". American Psychological Association.
- "U. S. Census: Income, Expenditures, Poverty and Wealth".
- "Perspectives on Inequality and Opportunity from the Survey of Consumer Finances".
- "Archived copy".
- (2022). "Evolution of wealth indicators, USA, 1913-2019". World Inequality Database.
- Center for the Future of Children, The Future of Children. Vol. 7, No 2, 1997.
- "Family Income TOC".
- Amy Joyce, "The Bias Breakdown," ''The Washington Post'', December 9, 2005, p. D01 citing Gallup Poll data.
- Jared Bernstein (January 13, 2014). [https://economix.blogs.nytimes.com/2014/01/13/poverty-and-inequality-in-charts/?_php=true&_type=blogs&_r=0 Poverty and Inequality, in Charts]. ''[[The New York Times]]'' Retrieved September 20, 2014.
- Elise Gould (January 15, 2014). [http://www.epi.org/blog/matter-measure-poverty-poverty-rate-economic/ No Matter How We Measure Poverty, the Poverty Rate Would Be Much Lower If Economic Growth Were More Broadly Shared]. [[Economic Policy Institute]]. Retrieved September 20, 2014.
- Summers, Lawrence. (January 18, 2015). "Focus on growth for the middle class".
- Rank, Mark Robert. (2023). "The Poverty Paradox: Understanding Economic Hardship Amid American Prosperity". [[Oxford University Press]].
- Desmond, Matthew. (2023). "[[Poverty, by America]]". Crown Publishing Group.
- "The Social Benefits and Economic Costs of Taxation".
- The Swiss education system swissworld.org, Retrieved on June 23, 2009
- "Tax Foundation".
- Bruce Western. (May 2011). "Poverty Politics and Crime Control in Europe and America". [[Contemporary Sociology]].
- Desmond, Matthew. (2023). "[[Poverty, by America]]". Crown Publishing Group.
- (September 12, 2012). "What is "deep poverty"?".
- Temin, Peter. (2017). "The Vanishing Middle Class: Prejudice and Power in a Dual Economy". [[MIT Press]].
- Pilkington, Ed. (September 5, 2017). "Hookworm, a disease of extreme poverty, is thriving in the US south. Why?". [[The Guardian]].
- Smith, Catharine. (January 30, 2018). "Why The U.S., One Of The World's Richest Countries, Struggles With Diseases Of Poverty". The Huffington Post.
- Levine, James A.. (November 2011). "Poverty and Obesity in the U.S.". Diabetes.
- (2018-05-15). "Socioeconomic Status and Cardiovascular Outcomes". Circulation.
- (2019). "Do the Poor Pay More for Housing? Exploitation, Profit, and Risk in Rental Markets". [[American Journal of Sociology]].
- Emily Ekins, "Poll: What Americans Think Cause Wealth and Poverty' (CATO Institute, 2019) [https://www.cato.org/blog/poll-what-americans-think-cause-wealth-poverty online]
- Kevin Drum (26 September 2013). [https://www.motherjones.com/kevin-drum/2013/09/we-can-reduce-poverty-if-we-want-we-just-have-want We Can Reduce Poverty If We Want To. We Just Have To Want To.] ''[[Mother Jones (magazine). Mother Jones]].'' Retrieved 28 September 2013.
- (June 22, 2023). "The fourth leading cause of death in the US? Cumulative poverty". [[The Guardian]].
- "2016 A&O Scorecard".
- "OCS Fact Sheet | Office of Community Services".
- Zachary A. Goldfarb (December 9, 2013). [https://www.washingtonpost.com/business/economy/study-us-poverty-rate-decreased-over-past-half-century-thanks-to-safety-net-programs/2013/12/09/9322c834-60f3-11e3-94ad-004fefa61ee6_story.html Study: U.S. poverty rate decreased over past half-century thanks to safety-net programs]. ''[[The Washington Post]].'' Retrieved January 20, 2015.
- Drum, Kevin (December 9, 2013). [https://www.motherjones.com/kevin-drum/2013/12/new-study-says-poverty-rate-hasnt-budged-40-years New Study Says Poverty Rate Hasn't Budged For 40 Years]. ''[[Mother Jones (magazine). Mother Jones]].'' Retrieved February 15, 2014.
- Jana Kasperkevic (November 12, 2014). [https://www.theguardian.com/money/us-money-blog/2014/nov/12/social-welfare-programs-food-stamps-reduce-poverty-america Welfare programs shown to reduce poverty in America]. ''[[The Guardian]].'' Retrieved December 27, 2014.
- (1999). "Do Social-Welfare Policies Reduce Poverty? A Cross-National Assessment". Social Forces.
- Bradley, D., E. Huber, S. Moller, F. Nielsen, and J. D. Stephens. (2003). "Determinants of Relative Poverty in Advanced Capitalist Democracies". American Sociological Review.
- Gould, Elise and Wething, Hilary (July 24, 2012). [http://www.epi.org/publication/ib339-us-poverty-higher-safety-net-weaker/ "U.S. poverty rates higher, safety net weaker than in peer countries."] ''[[Economic Policy Institute]].'' Retrieved February 11, 2014.
- 0674066529
- (August 2000). "Congressional Campaign Spending and the Quality of Democracy". The Journal of Politics.
- "The government shutdown has escalated the US war on the poor".
This article was imported from Wikipedia and is available under the Creative Commons Attribution-ShareAlike 4.0 License. Content has been adapted to SurfDoc format. Original contributors can be found on the article history page.
Ask Mako anything about Poverty in the United States — get instant answers, deeper analysis, and related topics.
Research with MakoFree with your Surf account
Create a free account to save articles, ask Mako questions, and organize your research.
Sign up freeThis content may have been generated or modified by AI. CloudSurf Software LLC is not responsible for the accuracy, completeness, or reliability of AI-generated content. Always verify important information from primary sources.
Report