From Surf Wiki (app.surf) — the open knowledge base
Motor vehicle
Self-propelled wheeled or tracked vehicle
Self-propelled wheeled or tracked vehicle

A motor vehicle, also known as a motorized vehicle, automotive vehicle, automobile, or road vehicle, is a self-propelled land vehicle, commonly wheeled, that does not operate on rails (such as trains or trams), does not fly (such as airplanes or helicopters), does not float on water (such as boats or ships), and is used for the transportation of people or cargo.
The vehicle propulsion is provided by an engine or motor, usually a gasoline/diesel internal combustion engine or an electric traction motor, or some combination of the two as in hybrid electric vehicles and plug-in hybrid vehicles. For legal purpose, motor vehicles are often identified within a number of vehicle classes including cars, buses, motorcycles, off-road vehicles, light trucks and regular trucks. These classifications vary according to the legal codes of each country. ISO 3833:1977 is the standard for road vehicle types, terms and definitions. Typically, to avoid requiring people with disabilities from having to possess an operator's license to use one, or requiring tags and insurance, powered wheelchairs will be specifically excluded by law from being considered motor vehicles.
, there were more than one billion motor vehicles in use in the world, excluding off-road vehicles and heavy construction equipment. And now according to the International Organization of Motor Vehicle Manufacturers (OICA), the global number of motor vehicles in use reached around 1.55 billion by 2023, reflecting steady growth driven by rising ownership in Asia and Africa.
Global vehicle ownership per capita in 2010 was 148 vehicles in operation (VIO) per 1000 people.
Definitions and terminology
In 1968 the Vienna Convention on Road Traffic gave one of the first international definitions of a motor vehicle:
- (o) “Power-driven vehicle” means any self-propelled road vehicle, other than a moped in the territories of Contracting Parties which do not treat mopeds as motorcycles, and other than a rail-borne vehicle;
- (p) “Motor vehicle” means any power-driven vehicle which is normally used for carrying persons or goods by road or for drawing, on the road, vehicles used for the carriage of persons or goods. This term embraces trolley-buses, that is to say, vehicles connected to an electric conductor and not rail-borne. It does not cover vehicles, such as agricultural tractors, which are only incidentally used for carrying persons or goods by road or for drawing, on the road, vehicles used for the carriage of persons or goods|Vienna convention on road traffic}}
Other sources might provide other definitions, for instance in the year 1977, ISO 3833:1977 provide other definitions.
Ownership trends
The U.S. publisher Ward's estimates that as of 2010, there were 1.015 billion motor vehicles in use in the world. This figure represents the number of cars, trucks (light, medium and heavy duty), and buses, but does not include off-road vehicles or heavy construction equipment. The world vehicle population passed the 500 million-unit mark in 1986, from 250 million motor vehicles in 1970. Between 1950 and 1970, the vehicle population doubled roughly every 10 years. Navigant Consulting forecasts that the global stock of light-duty motor vehicles will reach 2 billion units in 2035.
Global vehicle ownership in 2010 was 148 vehicles in operation per 1,000 people, a ratio of 1:6.75 vehicles to people, slightly down from 150 vehicles per 1,000 people in 2009, a rate of 1:6.63 vehicles to people. In developing countries vehicle ownership rates rarely exceed 200 cars per 1,000 population.
The following table summarizes the evolution of motor vehicle registrations in the world from 1960 to 2019:
| Historical trend of worldwide vehicle registrations | |||||||||||||
|---|---|---|---|---|---|---|---|---|---|---|---|---|---|
| 1960-2017 (thousands) | Type of vehicle | 1960 | 1970 | 1980 | 1990 | 2000 | 2005 | 2010 | 2015 | 2016 | 2017 | 2018 | 2019 |
| Car registrations(1) | 98,305 | 193,479 | 320,390 | 444,900 | 548,558 | 617,914 | 723,567 | 931,260 | 973,353 | 1,015,643 | 1,042,274 | 1,083,528 | |
| Truck and bus registrations | 28,583 | 52,899 | 90,592 | 138,082 | 203,272 | 245,798 | 309,395 | 332,434 | 348,919 | 356,044 | 389,174 | 406,770 | |
| World total | 126,888 | 246,378 | 410,982 | 582,982 | 751,830 | 863,712 | 1,032,962 | 1,263,694 | 1,322,272 | 1,371,687 | 1,431,448 | 1,490,298 | |
| Note (1) Car registrations do not include U.S. light trucks (SUVs, minivan and pickups) that are used for personal travel. The US accounts these vehicles among trucks. |
;Alternative fuels and vehicle technology adoption
Since the early 2000s, the number of alternative fuel vehicles has been increasing driven by the interest of several governments to promote their widespread adoption through public subsidies and other non-financial incentives. Governments have adopted these policies due to a combination of factors, such as environmental concerns, high oil prices, and less dependence on imported oil.
Among the fuels other than traditional petroleum fuels (gasoline or diesel fuel), and alternative technologies for powering the engine of a motor vehicle, the most popular options promoted by different governments are: natural gas vehicles, LPG powered vehicles, flex-fuel vehicles, use of biofuels, hybrid electric vehicles, plug-in hybrids, electric cars, and hydrogen fuel cell cars.
Since the late 2000s, China, European countries, the United States, Canada, Japan and other developed countries have been providing strong financial incentives to promote the adoption of plug-in electric vehicle.As of 2024, the global fleet of plug-in electric vehicles (battery-electric and plug-in hybrids) exceeded 40 million units, with China and Europe accounting for over two-thirds of total sales. In 2020 the global market share of plug-in passenger car sales was 4.2%, up from 2.5% in 2019.
China

The People's Republic of China had 322 million motor vehicles in use at the end of September 2018, of which, 235 million were passenger cars in 2018, making China the country with largest motor vehicle fleet in the world. In 2016, the motor vehicle fleet consisted of 165.6 million cars and 28.4 million trucks and buses. About 13.6 million vehicles were sold in 2009, and motor vehicle registrations in 2010 increased to more than 16.8 million units, representing nearly half the world's fleet increase in 2010. Ownership per capita rose from 26.6 vehicles per 1000 people in 2006 to 141.2 in 2016.
The stock of highway-legal plug-in electric or new energy vehicles in China totaled 2.21 million units by the end of September 2018, of which, 81% are all-electric vehicles. These figures include heavy-duty commercial vehicles such buses and sanitation trucks, which represent about 11% of the total stock.
The number of cars and motorcycles in China increased 20 times between 2000 and 2010. This explosive growth has allowed China to become the world's largest new car market, overtaking the US in 2009. Nevertheless, ownership per capita is 58 vehicles per 1000 people, or a ratio of 1:17.2 vehicles to people, still well below the rate of motorization of developed countries.
United States
| Historical evolution of | ||||||
|---|---|---|---|---|---|---|
| vehicle ownership rates in the U.S. | ||||||
| (Selected years 1900–2016) | Year | style="background-color: #ccffcc;" | Veh. per | |||
| 1000 people | style="background-color: #ccffcc;" | Year | style="background-color: #ccffcc;" | Veh. per | ||
| 1000 people | style="background-color: #ccffcc;" | Year | style="background-color: #ccffcc;" | Veh. per | ||
| 1000 people | ||||||
| 1900 | 0.11 | |||||
| 1905 | 0.94 | |||||
| 1910 | 5.07 | |||||
| 1920 | 86.78 | |||||
| 1930 | 217.34 | |||||
| 1935 | 208.6 |
The United States has the second-largest fleet of motor vehicles in the world after China. , had a motor vehicles stock of 259.14 million, of which, 246 million were light duty vehicles, consisting of 112.96 million passenger cars and 133 million light trucks (includes SUVs). A total of 11.5 million heavy trucks were registered at the end 2016 Vehicle ownership per capita in the U.S. is also the highest in the world, the U.S. Department of Energy (USDoE) reports a motorization rate of 831.9 vehicles in operation per 1000 people in 2016, or a ratio of 1:1.2 vehicles to people.
According to USDoE, the rate of motorization peaked in 2007 at 844.5 vehicles per 1,000 people. In terms of licensed drivers, as of 2009 the country had 1.0 vehicle for every licensed driver, and 1.87 vehicles per household. Passenger car registrations in the United States declined -11.5% in 2017 and -12.8% in 2018.
, the stock of alternative fuel vehicles in the United States included over 20 million flex-fuel cars and light trucks, the world's second-largest flexible-fuel fleet in the world after Brazil. However, actual use of ethanol fuel is significantly limited due to the lack of E85 refueling infrastructure.
Regarding the electrified segment, the fleet of hybrid electric vehicles in the United States is the second largest in the world after Japan, with more than four million units sold through April 2016. Since the introduction of the Tesla Roadster electric car in 2008, cumulative sales of highway legal plug-in electric vehicles in the United States passed one million units in September 2018. The U.S. stock of plug-in vehicles is the second largest after China (2.21 million by September 2018).
, the country's fleet also includes more than 160,000 natural gas vehicles, mainly transit buses and delivery fleets. Despite its relative small size, natural gas use accounted for about 52% of all alternative fuels consumed by alternative transportation fuel vehicles in the U.S. in 2009.
Europe
The 27 European Union (EU-27) member countries had a fleet of over 256 million in 2008, and passenger cars accounted for 87% of the union's fleet. The five largest markets, Germany (17.7%), Italy (15.4%), France (13.3%), the UK (12.5%), and Spain (9.5%), accounted for 68% of the region's total registered fleet in 2008. The EU-27 member countries had in 2009 an estimated ownership rate of 473 passenger cars per 1000 people.
According to Ward's, Italy had the second highest (after the U.S.) vehicle ownership per capita in 2010, with 690 vehicles per 1000 people. Portugal, between 1991 and 2002 grew up 220% on its motorization rate, having had in 2002, 560 cars per 1000 people.
Italy also leads in alternative fuel vehicles, with a fleet of 779,090 natural gas vehicles , the largest NGV fleet in Europe.
More than one million plug-in electric passenger cars and vans have been registered in Europe by June 2018, the world's second largest regional plug-in stock after China.
Norway is the leading plug-in market in Europe with almost 500,000 units registered . In October 2018, Norway became the world's first country where 10% of all passenger cars on the road are plug-in electrics. Also, the Norwegian plug-in car segment market share has been the highest in the world for several years, achieving 39.2% in 2017, 49.1% in 2018, and 74.7% in 2020.
Japan
Japan had 73.9 million vehicles by 2010, and had the world's second largest motor vehicle fleet until 2009.
Brazil
The Brazilian vehicle fleet reached 64.8 million vehicles in 2010, up from 29.5 million units in 2000, representing a 119% growth in ten years, and reaching a motorization rate of 340 vehicles per 1000 people. In 2010 Brazil experienced the second largest fleet increase in the world after China, with 2.5 million vehicle registrations.
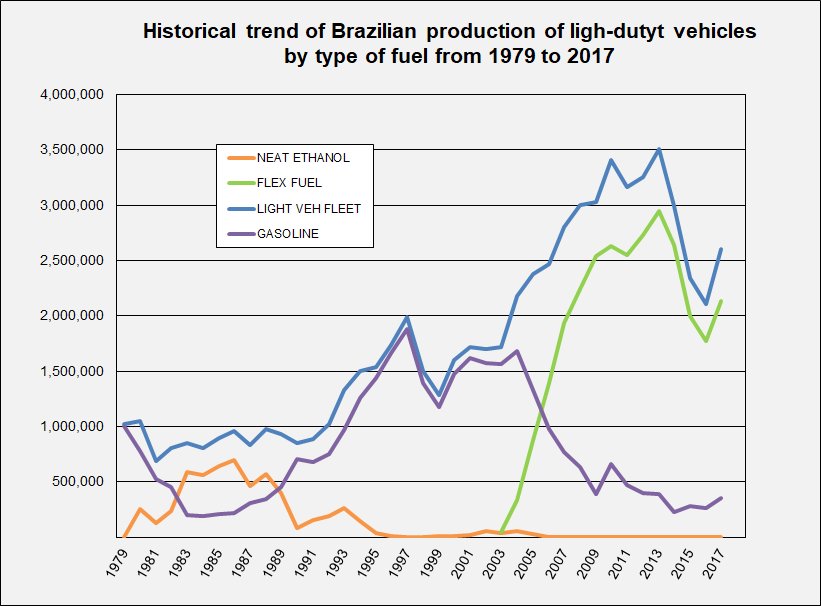
, Brazil has the largest alternative fuel vehicle fleet in the world with about 40 million alternative fuel motor vehicles in the road. The clean vehicle stock includes 30.5 million flexible-fuel cars and light utility vehicles and over 6 million flex-fuel motorcycles by March 2018; between 2.4 and 3.0 million neat ethanol vehicles still in use, out of 5.7 million ethanol only light-vehicles produced since 1979; and, , a total of 1.69 million natural gas vehicles.
In addition, all the Brazilian gasoline-powered fleet is designed to operate with high ethanol blends, up to 25% ethanol fuel (E25). The market share of flex fuel vehicles reached 88.6% of all light-duty vehicles registered in 2017.
India
India's vehicle fleet had the second-largest growth rate after China in 2010, with 8.9%. The fleet went from 19.1 million in 2009 to 20.8 million units in 2010. India has a fleet of 1.1 million natural gas vehicles .
Australia
As of January 2011, the Australian motor vehicle fleet had 16.4 million registered vehicles, with an ownership rate of 730 motor vehicles per 1000 people, up from 696 vehicles per 1000 residents in 2006. The motor vehicle fleet grew 14.5% since 2006, for an annual rate of 2.7% during this five-year period.
Motorization rates by region and selected country
The following table compares vehicle ownership rates by region with the United States, the country with one of the highest motorization rates in the world, and how it has evolved from 1999 to 2016.
| Comparison of motorization rates by region |
|---|
| and selected country (1999 and 2016) |
| (vehicles per 1,000 people) |
| Country or region |
| Africa |
| Asia – Far East |
| Asia – Middle East |
| Brazil |
| Canada |
| Central and South America |
| China |
| Europe – Eastern Europe |
| Europe – Western Europe |
| India |
| Indonesia |
| Pacific |
| United States |
Production by country
Main article: List of countries by motor vehicle production
In 2023, global motor vehicle production reached approximately 93.5 million units, according to data from the International Organization of Motor Vehicle Manufacturers (OICA). The following table shows the top 15 manufacturing countries for 2017 and their corresponding annual production between 2004 and 2017.
| World | |||||||||||||||||||||||||||||||
|---|---|---|---|---|---|---|---|---|---|---|---|---|---|---|---|---|---|---|---|---|---|---|---|---|---|---|---|---|---|---|---|
| rank | |||||||||||||||||||||||||||||||
| 2017 | Country | 2017 | 2016 | 2015 | 2014 | 2013 | 2012 | 2011 | 2010 | 2009 | 2008 | 2007 | 2006 | 2005 | 2004 | World total | 97,302,534 | 94,976,569 | 90,780,583 | 89,747,430 | 87,507,027 | 84,236,171 | 79,880,920 | 77,583,519 | 61,762,324 | 70,729,696 | 73,266,061 | 69,222,975 | 66,719,519 | 64,496,220 | |
| 1 | China | 29,015,434 | 28,118,794 | 24,503,326 | 23,722,890 | 22,116,825 | 19,271,808 | 18,418,876 | 18,264,761 | 13,790,994 | 9,299,180 | 8,882,456 | 7,188,708 | 5,717,619 | 5,234,496 | ||||||||||||||||
| 2 | United States | 11,189,985 | 12,198,137 | 12,100,095 | 11,660,699 | 11,066,432 | 10,335,765 | 8,661,535 | 7,743,093 | 5,709,431 | 8,672,141 | 10,780,729 | 11,263,986 | 11,946,653 | 11,989,387 | ||||||||||||||||
| 3 | Japan | 9,693,746 | 9,204,590 | 9,278,238 | 9,774,558 | 9,630,181 | 9,943,077 | 8,398,630 | 9,628,920 | 7,934,057 | 11,575,644 | 11,596,327 | 11,484,233 | 10,799,659 | 10,511,518 | ||||||||||||||||
| 4 | Germany | 5,645,581 | 6,062,562 | 6,033,164 | 5,907,548 | 5,718,222 | 5,649,260 | 6,146,948 | 5,905,985 | 5,209,857 | 6,045,730 | 6,213,460 | 5,819,614 | 5,757,710 | 5,569,954 | ||||||||||||||||
| 5 | India | 4,782,896 | 4,488,965 | 4,125,744 | 3,840,160 | 3,898,425 | 4,174,713 | 3,927,411 | 3,557,073 | 2,641,550 | 2,332,328 | 2,253,729 | 2,019,808 | 1,638,674 | 1,511,157 | ||||||||||||||||
| 6 | South Korea | 4,114,913 | 4,228,509 | 4,555,957 | 4,524,932 | 4,521,429 | 4,561,766 | 4,657,094 | 4,271,741 | 3,512,926 | 3,826,682 | 4,086,308 | 3,840,102 | 3,699,350 | 3,469,464 | ||||||||||||||||
| 7 | Mexico | 4,068,415 | 3,597,462 | 3,565,469 | 3,365,306 | 3,054,849 | 3,001,814 | 2,681,050 | 2,342,282 | 1,561,052 | 2,167,944 | 2,095,245 | 2,045,518 | 1,684,238 | 1,577,159 | ||||||||||||||||
| 8 | Spain | 2,848,335 | 2,885,922 | 2,733,201 | 2,402,978 | 2,163,338 | 1,979,179 | 2,373,329 | 2,387,900 | 2,170,078 | 2,541,644 | 2,889,703 | 2,777,435 | 2,752,500 | 3,012,174 | ||||||||||||||||
| 9 | Brazil | 2,699,672 | 2,156,356 | 2,429,463 | 3,146,118 | 3,712,380 | 3,402,508 | 3,407,861 | 3,381,728 | 3,182,923 | 3,215,976 | 2,977,150 | 2,611,034 | 2,530,840 | 2,317,227 | ||||||||||||||||
| 10 | France | 2,227,000 | 2,082,000 | 1,970,000 | 1,817,000 | 1,740,000 | 1,967,765 | 2,242,928 | 2,229,421 | 2,047,693 | 2,568,978 | 3,015,854 | 3,169,219 | 3,549,008 | 3,665,990 | ||||||||||||||||
| 11 | Canada | 2,199,789 | 2,370,271 | 2,283,474 | 2,393,890 | 2,379,834 | 2,463,364 | 2,135,121 | 2,068,189 | 1,490,482 | 2,082,241 | 2,578,790 | 2,572,292 | 2,687,892 | 2,711,536 | ||||||||||||||||
| 12 | Thailand | 1,988,823 | 1,944,417 | 1,915,420 | 1,880,007 | 2,457,057 | 2,429,142 | 1,457,798 | 1,644,513 | 999,378 | 1,393,742 | 1,287,346 | 1,194,426 | 1,122,712 | 927,981 | ||||||||||||||||
| 13 | United Kingdom | 1,749,385 | 1,816,622 | 1,682,156 | 1,598,879 | 1,597,872 | 1,576,945 | 1,463,999 | 1,393,463 | 1,090,139 | 1,649,515 | 1,750,253 | 1,648,388 | 1,803,109 | 1,856,539 | ||||||||||||||||
| 14 | Turkey | 1,695,731 | 1,485,927 | 1,358,796 | 1,170,445 | 1,125,534 | 1,072,978 | 1,189,131 | 1,094,557 | 869,605 | 1,147,110 | 1,099,413 | 987,780 | 879,452 | 823,408 | ||||||||||||||||
| 15 | Russia | 1,551,293 | 1,303,989 | 1,384,399 | 1,886,646 | 2,184,266 | 2,233,103 | 1,990,155 | 1,403,244 | 725,012 | 1,790,301 | 1,660,120 | 1,508,358 | 1,354,504 | 1,386,127 |
References
References
- "Table MV-1 - Highway Statistics 2022 - Policy". U.S. Department of Transportation.
- "ISO 3833:1977". [[International Organization for Standardization]].
- Saja, Fabio. (April 2020). "How Many Cars Are There In The World?". Drive Tribe.
- . ["2022 Production Statistics"](https://www.oica.net/category/production-statistics/2022-statistics/).
- (12 December 2022). "Highlights of the Automotive Trends Report". U.S. Environmental Protection Agency (EPA).
- (November 2023). "Trends in the Global Vehicle Fleet 2023 / Managing the SUV Shift and the EV Transition". Global Fuel Economy Initiative (GFEI).
- John Sousanis. (2011-08-15). "World Vehicle Population Tops 1 Billion Units". [[Ward's.
- [[Navigant Consulting]]. (2014). "Executive Summary: Transportation Forecast: Light Duty Vehicles (2014-2035)". Navigant Research.
- "Motorization, Demand & City Development". [[The World Bank]].
- (June 2011). "Transportation Energy Data Book: Edition 30". Office of Energy Efficiency and Renewable Energy, [[United States Department of Energy.
- (July 2012). "Transportation Energy Data Book: Edition 31". Office of Energy Efficiency and Renewable Energy, [[United States Department of Energy.
- (July 2014). "Transportation Energy Data Book: Edition 33". Office of Energy Efficiency and Renewable Energy, [[United States Department of Energy.
- (July 2016). "Transportation Energy Data Book: Edition 35". Vehicle Technologies Office, Office of Energy Efficiency and Renewable Energy, [[United States Department of Energy.
- (2020-08-31). "Transportation Energy Data Book: Edition 38.2". [[Oak Ridge National Laboratory]], Office of Energy Efficiency and Renewable Energy, [[United States Department of Energy.
- (2022-06-01). "Transportation Energy Data Book: Edition 40". [[Oak Ridge National Laboratory]], Office of Energy Efficiency and Renewable Energy, [[United States Department of Energy.
- (2009). "Two billion cars: driving toward sustainability". [[Oxford University Press]], New York.
- (2010). "Reinventing the Automobile: Personal Urban Mobility for the 21st Century". [[The MIT Press]].
- [[R. James Woolsey]]. (2009). "Plug-in Electric Vehicles: What Role for Washington?". [[The Brookings Institution]].
- Carrington, Damian. (2021-01-19). "Global sales of electric cars accelerate fast in 2020 despite pandemic". The Guardian.
- Irle, Roland. (2020-02-03). "Global BEV & PHEV Sales for 2019". EV-volumes.com.
- Coren, Michael J.. (2019-01-25). "E-nough? Automakers may have completely overestimated how many people want electric cars". [[Quartz (publication).
- (2018-10-18). "China car population reaches 235 million units, Ministry of Public Security". Gasgoo.
- Dale Hall, Hongyang Cui, Nic Lutsey. (2018-10-30). "Electric vehicle capitals: Accelerating the global transition to electric drive". The International Council on Clean Transportation.
- [[International Energy Agency]] (IEA), Clean Energy Ministerial, and Electric Vehicles Initiative (EVI). (May 2016). "Global EV Outlook 2016: Beyond one million electric cars". IEA Publications.
- Jonathan Watts. (2011-08-24). "China's love affair with the car shuns green vehicles". [[The Guardian]].
- (2010-01-11). "China car sales 'overtook the US' in 2009". [[BBC News]].
- (August 2018). "Transportation Energy Data Book: Edition 36.2". [[Oak Ridge National Laboratory]].
- Davis. (2011). "op. cit".
- (April 2024). "OECD Passenger car registrations". OECD.
- "Alternative Fuels Data Center: Flexible Fuel Vehicles". U.S. Department of Energy.
- National Renewable Energy Laboratory [[United States Department of Energy. (2007-09-17). "Alternative and Advanced Vehicles: Flexible Fuel Vehicles". Alternative Fuels and Advanced Vehicles Data Center.
- Cobb, Jeff. (2016-06-06). "Americans Buy Their Four-Millionth Hybrid Car". HybridCars.com.
- Kane, Mark. (2018-10-06). "Plug-In Electric Cars Sales In U.S. Surpass 1 Million". InsideEVs.com.
- [[Argonne National Laboratory]]. (2018-11-26). "FOTW #1057, November 26, 2018: One Million Plug-in Vehicles Have Been Sold in the United States". Vehicle Technologies Office, USDoE.
- Automotive News China. (2018-10-19). "China's electrified vehicle fleet tops 2.21 million". Automotive News China.
- "Alternative Fuels Data Center: Natural Gas Vehicles". U.S. Department of Energy.
- (2011-08-11). "EIA: consumption of alternative transportation fuels held steady in 2009". Green Car Congress.
- "Vehicles in Use". [[European Automobile Manufacturers Association]].
- (2011-08-15). "Car fleet by country 2008". [[European Automobile Manufacturers Association]].
- "Motorisation rate". Eurostat.
- "Motorization rate". [[Eurostat]].
- BAFF. "Bought ethanol cars". BioAlcohol Fuel Foundation.
- (2018-08-26). "Electric cars exceed 1m in Europe as sales soar by more than 40%". [[The Guardian]].
- Cobb, Jeff. (2017-01-16). "The World Just Bought Its Two-Millionth Plug-in Car". HybridCars.com.
- Cobb, Jeff. (2017-01-17). "Top 10 Plug-in Vehicle Adopting Countries of 2016". HybridCars.com.
- Jose, Pontes. (2018-01-28). "Europe December 2017". EVSales.com.
- Norsk Elbilforening (Norwegian Electric Vehicle Association). (January 2019). "Norwegian EV market". Norsk Elbilforening.
- Kane, Mark. (2018-10-07). "10% Of Norway's Passenger Vehicles Are Plug Ins". InsideEVs.com.
- Miley, Jessica. (2018-10-02). "45% of New Cars Sold in Norway in September were All-Electric Vehicles". Interesting Engineering.
- Opplysningsrådet for Veitrafikken AS (OFV). "Bilsalget i 2017". OFV.
- Norwegian Road Federation (OFV). (2019-01-02). "Bilsalget i 2018". OFV.
- "Bilsalget i desember og hele 2020".
- "Anuário da Indústria Automobilística Brasileira 2018, ANFAVEA".
- Ardilhes Moreira. (2011-02-13). "Frota de veículos cresce 119% em dez anos no Brasil, aponta Denatran". Globo.com.
- Curcio, Mário. (2018-03-23). "Carro flex chega aos 15 anos com 30,5 milhões de unidades". Automotive Business.
- Alfred Szwarc. "Abstract: Use of Bio-fuels in Brazil". United Nations Framework Convention on Climate Change.
- Luiz A. Horta Nogueira. (2004-03-22). "Perspectivas de un Programa de Biocombustibles en América Central: Proyecto Uso Sustentable de Hidrocarburos". Comisión Económica para América Latina y el Caribe (CEPAL).
- ANFAVEA. "Anúario da Industria Automobilistica Brasileira 2012: Tabela 2.3 Produção por combustível - 1957/2012". ANFAVEA - Associação Nacional dos Fabricantes de Veículos Automotores (Brasil).
- "Natural Gas Vehicle Statistics: Summary Data 2010". International Association for Natural Gas Vehicles.
- (2007). "Sustainable Ethanol: Biofuels, Biorefineries, Cellulosic Biomass, Flex-Fuel Vehicles, and Sustainable Farming for Energy Independence". Prairie Oak Publishing, Maryville, Missouri.
- "Portaria Nº 143, de 27 de Junho de 2007". Ministério da Agricultura, Pecuária e Abastecimento.
- "Lei Nº 8.723, de 28 de Outubro de 1993. Dispõe sobre a redução de emissão de poluentes por veículos automotores e dá outras providências". Casa Civil da Presidência da República.
- (2011-07-28). "Motor Vehicle Census, Australia, 31 Jan 2011". Australian Bureau of Statistics.
- Davis. (2011). "op. cit".
- [International Organization of Motor Vehicle Manufacturers]. "2017 Production Statistics". OICA.
This article was imported from Wikipedia and is available under the Creative Commons Attribution-ShareAlike 4.0 License. Content has been adapted to SurfDoc format. Original contributors can be found on the article history page.
Ask Mako anything about Motor vehicle — get instant answers, deeper analysis, and related topics.
Research with MakoFree with your Surf account
Create a free account to save articles, ask Mako questions, and organize your research.
Sign up freeThis content may have been generated or modified by AI. CloudSurf Software LLC is not responsible for the accuracy, completeness, or reliability of AI-generated content. Always verify important information from primary sources.
Report