From Surf Wiki (app.surf) — the open knowledge base
Load duration curve
Chart used in power engineering
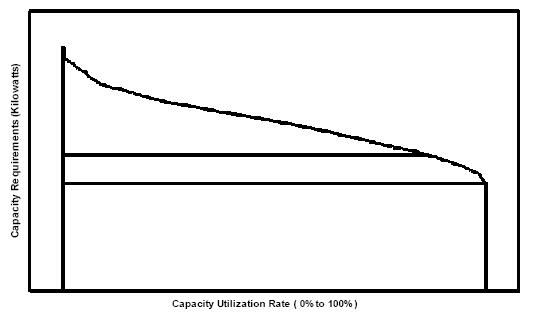
Chart used in power engineering
A load duration curve (LDC) is used in electric power generation to illustrate the relationship between generating capacity requirements and capacity utilization.
A LDC is similar to a load curve but the demand data is ordered in descending order of magnitude, rather than chronologically. The LDC curve shows the capacity utilization requirements for each increment of load. The height of each slice is a measure of capacity, and the width of each slice is a measure of the utilization rate or capacity factor. The product of the two is a measure of electrical energy (e.g. kilowatthours).
A price duration curve shows the proportion of time for which the price exceeded a certain value.
Together, the price duration curve and load duration curve enable the analyst to understand the behaviour of the electricity market, for example, the likelihood of peaking power plant being required for service, and the impact that this might have on price.
Mathematically, it is a complementary cumulative distribution function.
References
References
- Renewable and Efficient Electric Power Systems By Gilbert M. Masters
This article was imported from Wikipedia and is available under the Creative Commons Attribution-ShareAlike 4.0 License. Content has been adapted to SurfDoc format. Original contributors can be found on the article history page.
Ask Mako anything about Load duration curve — get instant answers, deeper analysis, and related topics.
Research with MakoFree with your Surf account
Create a free account to save articles, ask Mako questions, and organize your research.
Sign up freeThis content may have been generated or modified by AI. CloudSurf Software LLC is not responsible for the accuracy, completeness, or reliability of AI-generated content. Always verify important information from primary sources.
Report