From Surf Wiki (app.surf) — the open knowledge base
List of countries by rail usage
none

none
This is a list of countries by rail usage. Usage of rail transport may be measured in tonne-kilometres (tkm) or passenger-kilometres (pkm) travelled for freight and passenger transport respectively. This is the number of tonnes or passengers multiplied by the average distance of their journeys in kilometres.
Overview
Globally, rail freight is transported to the extent of almost 10,000 billion tonne-kilometres (9.842 billion long ton-miles or 11.023 billion short ton-miles) per year, of which about one-third occurs in India and a quarter each in the United States and China.
Of the 3,000 bn passenger-kilometres travelled across the world each year, 1,346 bn are travelled in China and 1,150 bn in India. Thus China and India together contribute almost half of world's passenger travel.
The average Swiss person travels 2,430 km by train each year (the highest in the world), almost 500 more than the average Japanese person (the second highest).
In 2014, there were about 1 million kilometres (621,400 miles) of railway in the world, a decrease of 3% compared to 2013.
- 350,000 km (218,000 mi) were in Europe and mainly used for passenger service.
- 370,000 km (230,000 mi) were in North America and mainly used for freight.
- 230,000 km (140,000 mi) were in Asia and used for both freight and passenger service.
In America and Europe, many low-fare airlines and motorways compete with rail for passenger traffic. Asia has experienced a large growth in high-speed rail: its 257bn passenger-kilometres represent 72% of total world high-speed rail passenger traffic.
Passenger rail
These figures do not include metro railway systems; see Lists of rapid transit systems for metro rail statistics.
Passenger-kilometres of rail transport per year
Countries with more than five billion passenger-kilometres (pkm) travelled per year. Unless otherwise specified, data come from the Railway Statistics 2015 Report by the International Union of Railways (UIC).
| Rank | Country/Region | Passenger-kilometres | |||||
|---|---|---|---|---|---|---|---|
| (billions) | Data year | ||||||
| 1 | China | 1,580 | 2024 | ||||
| 2 | India | title=Operations of Indian Railways (Statistics for 2024) | url=https://www.indiabudget.gov.in/economicsurvey/doc/stat/tab1.26.pdf | website=Government of India}} | 2024 | ||
| 3 | European Union | 429 | 2023 | ||||
| 4 | Japan | title=Transport - Passenger transport - OECD Data | url=https://data-explorer.oecd.org/vis?lc=en&df[ds]=dsDisseminateFinalDMZ&df[id]=DSD_ST%40DF_STPASS&df[ag]=OECD.ITF&dq=.A...RAIL...&pd=2019%2C&to[TIME_PERIOD]=false&vw=tb | website=OECD | language=en}} | 2024 | |
| 5 | Russia | 136.3 | 2023 | ||||
| 6 | Germany | 104.2 | 2023 | ||||
| 7 | France | 89.2 | 2023 | ||||
| 8 | South Korea | 82.9 | 2022 | ||||
| 9 | United Kingdom | 58.4 | 2023 | ||||
| 10 | Italy | 57.8 | 2024 | ||||
| 11 | United States | 45.6 | 2024 | ||||
| 12 | Spain | 29.8 | 2024 | ||||
| 13 | Ukraine | 28.4 | 2019 | ||||
| 14 | Poland | 28.2 | 2024 | ||||
| 15 | Turkey | 22.3 | 2024 | ||||
| 16 | Switzerland | 21.4 | 2019 | ||||
| 17 | Pakistan | 20.3 | 2015 | ||||
| 18 | Taiwan | 19.8 | 2015 | ||||
| 19 | Netherlands | 19.2 | 2023 | ||||
| 20 | Indonesia | 18.5 | 2015 | ||||
| 21 | Kazakhstan | 18.5 | 2018 | ||||
| 22 | Iran | 16.3 | 2014 | ||||
| 23 | Australia | 15 | 2023-24 | ||||
| 24 | Hungary | 15 | 2024 | ||||
| 25 | Austria | 14.6 | 2023 |
Passengers carried in rail transport per year
Countries with more than 20 million passengers per year. Unless otherwise specified, data come from the Railway Statistics 2019 Report by the International Union of Railways.
As mentioned in the notes, many of these figures are very incomplete, as they exclude metro/rapid transport rail services.
| Rank | Country | Million | ||||||||||
|---|---|---|---|---|---|---|---|---|---|---|---|---|
| passengers | Data year | Notes | ||||||||||
| 1 | Japan Japan | 25,201 | publisher=Ministry of Land, Infrastructure, Transport and Tourism | title=旅客輸送量の推移 | date=2021 | url=https://www.mlit.go.jp/statistics/details/tetsudo_list.html }} | Includes all public and private rail services. For only the JR group rail companies, the figure in 2019 was 9,503 million passengers. | |||||
| 2 | India India | 6,905 | 2024 | Includes Indian Railways suburban and intercity traffic only, excludes the passengers carried by rapid transit systems. | ||||||||
| 3 | China China | 4,312 | 2024 | Excludes rapid transit networks, which handled 23.71 billion passengers in 2019. | ||||||||
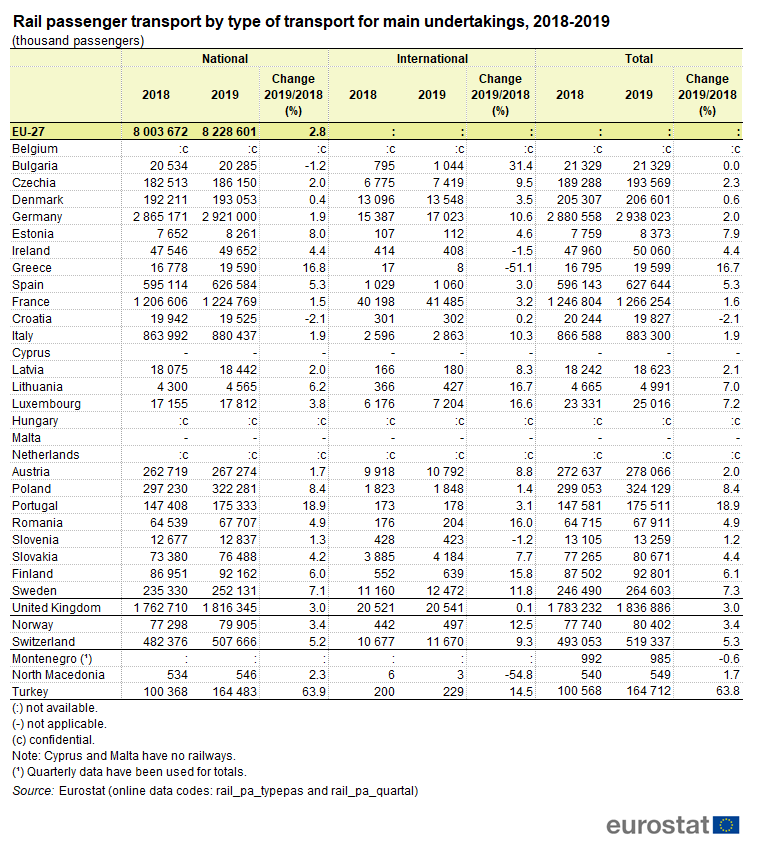
| 4 | Germany Germany | 2,938 | url= https://ec.europa.eu/eurostat/statistics-explained/images/9/97/Rail_passenger_transport_by_type_of_transport_for_main_undertakings%2C_2018-2019_%28thousand_passengers%29.png | title= Rail passenger transport by type of transport for main undertakings, 2018-2019 (thousand passengers) | website=ec.europa.eu | access-date=24 September 2021}} | ||||||
| 5 | Brazil Brazil | 2,571 | url=https://anptrilhos.org.br/wp-content/uploads/2025/03/ANPTrilhos-Balanco-do-Setor-Metroferroviario-2024.pdf | title= Balanço do setor Metroferroviário no Brasil 2024 | website=anptrilhos.org.br | access-date=30 December 2025}} | Includes all public and private, urban and long distance rail services. 3.63% increase from the 2.481 billion passengers carried in 2023. In 2024 long distance services alone carried 1.259 million passengers, 0.05% of the total. | |||||
| 6 | France France | 1,880 | 2019 | |||||||||
| 7 | United Kingdom United Kingdom | 1,836.8 | 2019 | url=https://tfl.gov.uk/corporate/about-tfl/what-we-do/london-underground/facts-and-figures | title=Facts & Figures | date=29 July 2019 | publisher=Transport for London | location=London }} | ||||
| 8 | Russia | 1,157.2 | 2018 | Moscow Metro alone had 2.45 billion passengers in 2014 | ||||||||
| 9 | Australia | 1,064.2 | 2018–19 | Combined Urban and Non-Urban Rail Passenger Traffic | ||||||||
| 10 | Italy Italy | 883.3 | 2019 | |||||||||
| 11 | Spain | 636 | 2019 | url=https://www.metromadrid.es/sites/default/files/documentos/Portal%20de%20transparencia/Informaci%C3%B3n%20Econ%C3%B3mica/Datos%20estad%C3%ADsticos/Cierre%20demanda%202018.pdf | title=Evolución de la demanda – Cierre año 2018 | date=11 February 2019 | publisher=Metro de Madrid | page=2 | language=es | trans-title=Evolution of demand – End of 2018 | access-date=2019-03-10}} | |
| 12 | United States | 535 | 2019 | url= https://www.washingtonpost.com/gdpr-consent/?next_url=https%3a%2f%2fwww.washingtonpost.com%2ftransportation%2f2019%2f11%2f08%2famtrak-touts-record-ridership-revenue-fiscal%2f | title=Amtrak tours record ridership, revenue for fiscal 2019 | newspaper=Washington Post | date=2019-11-08 | access-date=2020-09-12}} Among regional systems that report to the American Public Transportation Association, there were 502.5 million commuter rail riders in calendar year 2019. | ||||
| 13 | Austria | 511 | 2024 | |||||||||
| 14 | Switzerland | 507.3 | 2024 | |||||||||
| 15 | Netherlands | 474.5 | 2019 | |||||||||
| 16 | Ukraine | 440.9 | 2016 | |||||||||
| 17 | Indonesia | 429.2 | 2019 | |||||||||
| 18 | Argentina | 426.2 | 2018 | 423,202,522 Buenos Aires commuter | ||||||||
| 2,036,792 regional | ||||||||||||
| 1,009,357 long distance | ||||||||||||
| 19 | Poland | 324.1 | 2019 | url=http://www.utk.gov.pl/en/markettatistics-and-ann/monthly-statistics/monthly-statistics-2015/4895,Passenger-rail-transport-results-2015.html | title=Passenger rail transport results 2015 | first=JSK | last=Internet}} | |||||
| 20 | Taiwan | 291.84 | 2018 | |||||||||
| 21 | Egypt | 270 | 2019 | |||||||||
| 22 | South Africa | 269 | 2017–18 | |||||||||
| 23 | Sweden | 264.6 | 2019 | url=http://www.mtrnordic.se/om-oss/hallbarhet/hallbarhetsredovisning2017/2017-aret-i-korthet/ | title=Hållbarhetsredovisning 2017, året i korthet | publisher=MTR Nordic | language=sv | year=2018 | access-date=2018-12-02}} | |||
| 24 | Belgium | 246.94 | 2018 | |||||||||
| 25 | Denmark | 206.6 | 2019 | |||||||||
| 26 | Czech Republic | 193.5 | 2019 | Prague Metro alone had 435.6 million passengers in 2017. | ||||||||
| 27 | Portugal | 175.5 | 2019 | Lisbon Metro alone had 169 million passengers in 2018. | ||||||||
| 28 | Turkey | 164.7 | 2019 | Istanbul Metro alone had 469.7 million passengers in 2018. | ||||||||
| 29 | Sri Lanka | 138.66 | 2017 | |||||||||
| 30 | South Korea | 127.84 | 2018 | |||||||||
| 31 | Hungary | 119 | 2018 | Budapest Metro alone had 409.3 million passengers in 2017. | ||||||||
| 32 | Canada | 106.9 | 2019 | Via Rail, Canada's main intercity rail provider, transported 5 million passengers in 2019. Commuter railway systems in and around Toronto, Montreal, and Vancouver transported an additional 101.9 million passengers in 2019. | ||||||||
| 33 | Finland | 92.8 | 2019 | 14.9 million / year long-distance | ||||||||
| 77.9 million / year in Helsinki commuter traffic | ||||||||||||
| 34 | Norway | 80.402 | 2019 | Oslo Metro alone had 122 million passengers in 2018. | ||||||||
| 35 | Slovakia | 80 | 2019 | |||||||||
| 36 | Belarus | 79.86 | 2018 | url=http://www.asmetro.ru/upload/docs/2019.pdf | script-title=ru:Основные технико-эксплуатационные характеристики метрополитенов за 2019 год | publisher=Международная Ассоциация "Метро" [International Association of Metros] | language=ru | trans-title=Main technical and operational specifications for Subways in Year 2019 | access-date=2020-08-25}} | |||
| 37 | Romania | 67.9 | 2019 | Bucharest Metro alone had 178.9 million passengers in 2017. | ||||||||
| 38 | Israel | 64.6 | 2017 | url=https://www.gov.il/BlobFolder/reports/takziv_2019/he/takziv2019.pdf | title=ביצוע תקציב 2017 | trans-title=Budget Report 2017 | date=2018 | publisher=Israel Ministry of Transport | access-date=May 24, 2018 | language=he}} | ||
| 39 | Mexico | 57 | 2018 | url=https://www.milenio.com/negocios/tren-suburbano-alcanza-viabilidad-financiera | title=Tren Suburbano alcanza viabilidad financiera | work=Milenio | language=es | date=December 7, 2018 | access-date=May 28, 2020 | location=Mexico City | first=Pilar | last=Juárez}} |
| 40 | Pakistan | 52.39 | 2018 | |||||||||
| 41 | Ireland | 50.06 | 2019 | |||||||||
| 42 | Thailand | 50 | 2017 | Bangkok MRT alone had 113.7 million passengers in 2018. | ||||||||
| 43 | Myanmar | 48 | 2017 | |||||||||
| 44 | Chile | 47 | 2018 | Santiago Metro alone had 721 million passengers in 2018. | ||||||||
| 45 | Malaysia | 44.51 | 2018 | |||||||||
| 46 | Tunisia | 41 | 2017 | |||||||||
| 47 | Algeria | 39 | 2018 | Algiers Metro alone had 40 million passengers in 2018. | ||||||||
| 48 | Morocco | 35 | 2018 | |||||||||
| 49 | New Zealand | 35 | url= https://www.kiwirail.co.nz/assets/Uploads/documents/Annual-reports/2019/b563b44217/KiwiRail-Integrated-Report-2019-FINAL.pdf | title=KiwiRail Annual Integrated Report 2019 | date=2019 | access-date=2 December 2019 | publisher=KiwiRail}} | |||||
| 50 | Luxembourg | 31.3 | 2024 | |||||||||
| 51 | Iran | 28.09 | 2018 | Tehran Metro alone had 721 million passengers in 2016. | ||||||||
| 52 | Kazakhstan | 22.9 | 2018 | |||||||||
| 53 | Philippines | 21.84 | 2018 | |||||||||
| 54 | Uzbekistan | 21.59 | 2018 | Tashkent Metro alone had 71.2 million passengers in 2019. | ||||||||
| 55 | Bulgaria | 21.3 | 2019 | Sofia Metro alone had 93.1 million passengers in 2018. |
Passenger modal share for rail
The modal share of railway transport (excluding tram & metro) as compared to other modes of transport, based on Passenger-km.
| Rank | Country | Modal share (%) | *year* | |||||||
|---|---|---|---|---|---|---|---|---|---|---|
| 1 | Japan | 32.9 | date=2018 | title=Statistical handbook of Japan | url=https://www.stat.go.jp/english/data/handbook/pdf/2018all.pdf# | access-date=2019-09-26 | publisher=stat.go.jp | type=online statistics}} | ||
| 2 | China | 32 | 2021 | |||||||
| 3 | Russia | 24.4 | url=http://www.ipem.ru/files/files/research/20190405_rail_2025_report.pdf | title=Железнодорожный транспорт России: вызовы до 2025 года | date=2014 | url-status=dead | archive-url=https://web.archive.org/web/20160826111015/http://utmagazine.ru/posts/10280-ekonomika-rossii-cifry-i-fakty-chast-3-transport | archive-date=2016-08-26}} | ||
| 4 | Switzerland | 22.9 | 2024 | |||||||
| 5 | India | 20.0 | 2018 | |||||||
| 6 | Austria | 14 | 2024 | |||||||
| 7 | Netherlands | 11.3 | 2019 | |||||||
| 8 | Sweden | 10.5 | 2019 | |||||||
| 9 | France | 10.4 | 2019 | |||||||
| 10 | Slovakia | 10.2 | 2019 | |||||||
| 11 | Czech Republic | 9.9 | 2019 | |||||||
| 12 | Germany | 9.4 | 2019 | |||||||
| 13 | United Kingdom | 8.5 | 2019 | |||||||
| 14 | Belgium | 8.4 | 2019 | |||||||
| 15 | Hungary | 8.3 | 2019 | |||||||
| 16 | Denmark | 8.2 | 2019 | |||||||
| 17 | Poland | 7.3 | 2019 | |||||||
| 18 | Spain | 7.1 | 2019 | |||||||
| 19 | Indonesia | 6.3 | 2005{{cite web | |||||||
| 20 | Italy | 6.3 | 2019 | |||||||
| 21 | Finland | 6.2 | 2019 | |||||||
| 22 | Norway | 4.9 | 2019 | |||||||
| 23 | Luxembourg | 4.8 | 2019 | |||||||
| 24 | Portugal | 4.6 | 2019 | |||||||
| 25 | Romania | 4.2 | 2019 | |||||||
| 26 | Latvia | 3.4 | 2019 | |||||||
| 27 | Ireland | 3.3 | 2019 | |||||||
| 28 | Turkey | 3.3 | 2019 | |||||||
| 29 | Croatia | 2.4 | 2019 | |||||||
| 30 | Bulgaria | 2.2 | 2019 | |||||||
| 31 | Estonia | 2.2 | 2019 | |||||||
| 32 | Slovenia | 1.8 | 2019 | |||||||
| 33 | Montenegro | 1.2 | 2019 | |||||||
| 34 | Greece | 1.0 | 2019 | |||||||
| 35 | Lithuania | 1.0 | 2019 | |||||||
| 36 | Serbia | 0.7 | 2019 | |||||||
| 37 | North Macedonia | 0.6 | 2019 | |||||||
| 38 | United States | 0.3 | url=http://ec.europa.eu/dgs/energy_transport/figures/pocketbook/ | title=EU Transport in Figures; Statistical Pocketbook | date=2007 | publisher=European Commission Directorate-General for Energy and Transport; Eurostat | url-status=dead | archive-url=https://web.archive.org/web/20080601062236/http://ec.europa.eu/dgs/energy_transport/figures/pocketbook/ | archive-date=2008-06-01 }} |
Passenger rail by passenger-kilometres per capita
Countries with more than five billion passenger-kilometres travelled per year.
| Country | Kilometers/year | Year | |
|---|---|---|---|
| Switzerland | 2,519 | 2024 | |
| Japan | 2,320 | 2021 | |
| Austria | 1,614 | 2024 | |
| Hungary | 1,571 | 2024 | |
| France | 1,565 | 2024 | |
| South Korea | 1,352 | 2021 | |
| Germany | 1,287 | 2024 | |
| Sweden | 1,287 | 2024 | |
| Denmark | 1,081 | 2024 | |
| Belgium | 982 | url=https://irg-rail.eu/irg/documents/market-monitoring/536,2025.html | title = IRG rail Market Monitoring}} |
| Finland | 965 | 2024 | |
| Italy | 948 | 2024 | |
| United Kingdom | 947 | 2024 | |
| Czech Republic | 944 | 2024 | |
| Netherlands | 943 | 2024 |
Freight rail
Tonne-kilometres of rail transport per year
Countries with more than one billion tonne-kilometres (tkm) travelled per year. Unless otherwise specified, data come from the Railway Statistics 2014 Report by the International Union of Railways.
| Rank | Country | Billion tkm | Data year | ||||||||
|---|---|---|---|---|---|---|---|---|---|---|---|
| 1 | China | 3,586 | 2024 | ||||||||
| 2 | Russia | 2,639 | 2021 | ||||||||
| 3 | United States | 2,105 | 2020 | ||||||||
| 4 | India | 975 | 2024 | ||||||||
| 5 | Canada | title=Table 23-10-0057-01 Railway industry summary statistics on freight and passenger transportation | url=https://www150.statcan.gc.ca/t1/tbl1/en/tv.action?pid=2310005701 | website=Statistics Canada | date=27 June 2018 | publisher=Statistics Canada | access-date=15 Jan 2025}} | 2022 | |||
| 6 | Australia | 413 | 2016 | ||||||||
| 7 | Brazil | title=Anuário Estatístico Ferroviário | url=https://www.gov.br/antt/pt-br/assuntos/ferrovias/anuario-do-setor-ferroviario/arquivos-tabelas-excel/tabela-resumo-2024.xlsx/@@download/file | website=Agência Nacional de Transportes Terrestres, Brazil | access-date=30 December 2025}} | 2025 | |||||
| — | European Union | 261 | 2014 | ||||||||
| 8 | Ukraine | 237 | 2011 | ||||||||
| 9 | Kazakhstan | 236 | 2012 | ||||||||
| 10 | South Africa | 135 | 2014 | ||||||||
| 11 | Mexico | 126.9 | 2017 | ||||||||
| 12 | Germany | url=https://ec.europa.eu/eurostat/statistics-explained/pdfscache/7275.pdf | title=Railway freight transport statistics | author1=Eurostat | website=ec.europa.eu | date=November 2020 | page=5 | access-date=January 5, 2020}} | 2019 | ||
| 13 | Poland | 53.8 | 2019 | ||||||||
| 14 | Belarus | 45 | 2014 | ||||||||
| 15 | France | 31.8 | 2019 | ||||||||
| 16 | United Kingdom | 24.4 | 2014 | ||||||||
| 17 | Uzbekistan | 22 | 2012 | ||||||||
| 18 | Iran | 22 | 2013 | ||||||||
| 19 | Austria | 21.7 | 2019 | ||||||||
| 20 | Sweden | 21.1 | 2014 | ||||||||
| 21 | Japan | title=Key Transport Statistics 2014 Data | url=http://internationaltransportforum.org/Pub/pdf/15KeyStat2014.pdf | url-status=dead | archive-url=https://web.archive.org/web/20150922115943/http://internationaltransportforum.org/Pub/pdf/15KeyStat2014.pdf | archive-date=2015-09-22}} | 2014 | ||||
| 22 | Italy | 21 | 2019 | ||||||||
| 23 | Lithuania | 16.2 | 2019 | ||||||||
| 24 | Czech Republic | 16.2 | 2019 | ||||||||
| 25 | Latvia | 15 | 2019 | ||||||||
| 26 | Turkey | 14.7 | 2019 | ||||||||
| 27 | Argentina | 12 | 2010 | ||||||||
| 28 | Turkmenistan | 12 | 2012 | ||||||||
| 29 | Switzerland | 11 | 2019 | ||||||||
| 30 | Spain | 10.3 | 2019 | ||||||||
| 31 | South Korea | 10 | 2013 | ||||||||
| 32 | Romania | 10 | 2014 | ||||||||
| 33 | Finland | 9.6 | 2014 | ||||||||
| 34 | Azerbaijan | 8 | 2014 | ||||||||
| 35 | Mauritania | 8 | 2010 | ||||||||
| 36 | Indonesia | 7 | 2010 | ||||||||
| 37 | Netherlands | url=http://www.irg-rail.eu/app/download/5808813498/IRG-Rail+%2815%29+2+-+3rd+IRG-Rail+Market+Monitoring+Report.pdf | title=IRG–Rail 3rd Annual Market Monitoring Report 2014 | website=IRG-Rail | date=April 3, 2015 | page=31 | access-date=September 6, 2016 | url-status=dead | archive-url=https://web.archive.org/web/20160403142219/http://www.irg-rail.eu/app/download/5808813498/IRG-Rail+%2815%29+2+-+3rd+IRG-Rail+Market+Monitoring+Report.pdf | archive-date=April 3, 2016}} | 2013 |
| 38 | Morocco | 6 | 2011 | ||||||||
| 39 | Belgium | 5 | 2014 | ||||||||
| 40 | Norway | 4 | 2013 | ||||||||
| 41 | Chile | 4 | 2009 | ||||||||
| 42 | Vietnam | 4 | 2012 | ||||||||
| 43 | Malaysia | 3 | 2011 | ||||||||
| 44 | Serbia | 3 | 2014 | ||||||||
| 45 | Thailand | 3 | 2011 | ||||||||
| 46 | Estonia | 2.2 | 2019 | ||||||||
| 47 | Gabon | 2 | 2014 | ||||||||
| 48 | Croatia | 3.279 | 2020 | ||||||||
| 49 | Denmark | 2 | 2013 | ||||||||
| 50 | Tunisia | 2 | 2010 | ||||||||
| 51 | Egypt | 2 | 2010 | ||||||||
| 52 | Kenya | 1.7 | url=http://www.theceomagazine-ug.com/blog/2015/03/06/rvr-achieves-net-ton-per-kilometer-ntk-target/ | title=The CEO Magazine – RVR achieves Net Ton per Kilometer (NTK) target | website=The CEO Magazine | access-date=March 17, 2015 | date=March 6, 2015 | archive-url=https://web.archive.org/web/20171116133240/http://www.theceomagazine-ug.com/blog/2015/03/06/rvr-achieves-net-ton-per-kilometer-ntk-target/ | archive-date=November 16, 2017 | url-status=dead }} | |
| 53 | Israel | 1.4 | url=http://www.cbs.gov.il/shnaton68/st24_03.pdf | title=Railway Services (2011 Classification) | publisher=Israel Central Bureau of Statistics | date=August 30, 2017 | access-date=July 7, 2018}} | ||||
| 54 | Algeria | 1 | 2012 | ||||||||
| 55 | Cameroon | 1 | 2011 |
Tonnes carried in rail transport per year
Countries with more than ten million tonnes carried per year. Unless otherwise specified, data come from the Railway Statistics 2014 Report by the International Union of Railways.
| Rank | Country | Million tonnes | Data year | |||
|---|---|---|---|---|---|---|
| 1 | China | 5,175 | 2024 | |||
| 2 | United States | 1,600 | 2022 | |||
| 3 | India | 1,590 | 2024 | |||
| 4 | Australia | title=Rail Bitre - Statistical Report | url=https://www.bitre.gov.au/sites/default/files/documents/train_008.pdf | archive-url=https://web.archive.org/web/20210129101659/https://www.bitre.gov.au/sites/default/files/documents/train_008.pdf | archive-date=2021-01-29}} | 2016 |
| 5 | Russia | 1,218 | 2015 | |||
| 6 | Brazil | 554.5 | 2025 | |||
| 7 | Ukraine | 457 | 2011 | |||
| 8 | Canada | 342 | 2022 | |||
| 9 | Kazakhstan | 295 | 2012 | |||
| 10 | Poland | 225 | 2015 | |||
| 11 | Germany | 221 | 2014 | |||
| 12 | South Africa | 197 | 2011 | |||
| 13 | Belarus | 141 | 2014 | |||
| 14 | Mexico | 128 | 2018 | |||
| 15 | United Kingdom | 110.1 | 2014 | |||
| 16 | Uzbekistan | 82 | 2014 | |||
| 17 | Austria | 74 | 2014 | |||
| 18 | Sweden | 65 | 2015 | |||
| 19 | France | 63 | 2011 | |||
| 20 | Czech Republic | 57 | 2014 | |||
| 21 | Latvia | 57 | 2014 | |||
| 22 | Switzerland | 50 | 2014 | |||
| 23 | Lithuania | 49 | 2014 | |||
| 24 | Romania | 44 | 2014 | |||
| 25 | Netherlands | 42.6 | 2021 | |||
| 26 | South Korea | 40 | 2013 | |||
| 27 | Italy | 38 | 2014 | |||
| 28 | Finland | 37 | 2014 | |||
| 29 | Belgium | 37 | 2009 | |||
| 30 | Slovakia | 36 | 2014 | |||
| 31 | Morocco | 37 | 2011 | |||
| 32 | Iran | 33 | 2013 | |||
| 33 | Japan | 31 | 2010 | |||
| 34 | Turkmenistan | 27 | 2012 | |||
| 35 | Turkey | 26 | 2014 | |||
| 36 | Estonia | 26 | 2012 | |||
| 37 | Spain | 25 | 2014 | |||
| 38 | Chile | 25 | 2013 | |||
| 39 | Argentina | 24 | 2010 | |||
| 40 | Azerbaijan | 23 | 2012 | |||
| 41 | Georgia | 20 | 1917 | |||
| 42 | Indonesia | 20 | 2010 | |||
| 43 | Mongolia | 18 | 2011 | |||
| 44 | Slovenia | 17 | 2014 | |||
| 45 | Bosnia and Herzegovina | 13 | 2014 | |||
| 46 | Malaysia | 12 | 2011 | |||
| 47 | Bulgaria | 12 | 2014 | |||
| 48 | Taiwan | 11 | 2012 | |||
| 49 | Thailand | 11 | 2011 | |||
| 50 | Croatia | 10 | 2014 | |||
| 51 | Tunisia | 10 | 2012 |
Freight modal share for rail
The modal share carried by rail of all freight in a given country.
| Rank | Country | Modal share (%) | Data year | ||||||||
|---|---|---|---|---|---|---|---|---|---|---|---|
| 1 | Canada | url=http://www.oecd.org/daf/competition/Rail-transportation-Services-2013.pdf | title=Recent Developments in Rail Transportation Services | page=40 | year=2014 | access-date=September 6, 2016 | author=OECD Competition Committee | website=The Organisation for Economic Co-operation and Development}} | 2009 | ||
| 2 | Latvia | url=http://ec.europa.eu/eurostat/statistics-explained/index.php/Freight_transport_statistics | title=Freight transport statistics | author=Statistics Explained | website=European Commission | year=2012 | access-date=May 29, 2015}} | 2012 | |||
| 3 | Australia | 60 | 2016 | ||||||||
| 4 | Russia | 59 | 2010 | ||||||||
| 5 | Estonia | 47 | 2012 | ||||||||
| 6 | Switzerland | url=http://www.bfs.admin.ch/bfs/portal/en/index/news/publikationen.html?publicationID=5643 | title=Mobility and Transport: Pocket Statistics 2014 | format=PDF | type=Official publication | publisher=Federal Office for Statistics | location=Switzerland | date=July 30, 2013 | language=en, de, fr, it | access-date=14 October 2014}} | 2012 |
| 7 | United States | 44 | 2008 | ||||||||
| 8 | Austria | 41 | 2012 | ||||||||
| 9 | Sweden | 40 | 2012 | ||||||||
| 10 | Lithuania | 38 | 2012 | ||||||||
| 11 | India | url=http://economictimes.indiatimes.com/industry/transportation/railways/railway-budget-2016-suresh-prabhu-announces-measures-for-freight-to-increase-modal-share/articleshow/51142667.cms | title=Railway Budget 2016: Suresh Prabhu announces measures for freight to increase modal share | author=Anirban Chowdhury | website=Economic Times (India) | year=2016 | access-date=Dec 18, 2016}} | 2016 | |||
| 12 | Finland | 27 | 2012 | ||||||||
| 13 | Brazil | url=https://www.wirklich.com.br/participacao-de-ferrovias-alcanca-patamar-inedito-no-transporte-de-cargas-no-brasil/ | title=Railway share reaches all time hight in freigth transport in Brazil) | date=30 December 2025 }} | 2024 | ||||||
| 14 | Romania | 24 | 2012 | ||||||||
| 15 | Germany | 23 | 2012 | ||||||||
| 16 | Czech Republic | 22 | 2012 | ||||||||
| 17 | Hungary | 21 | 2012 | ||||||||
| 18 | Slovakia | 20 | 2012 | ||||||||
| 19 | Poland | 18 | 2012 | ||||||||
| 20 | Belgium | 18 | 2012 | ||||||||
| 21 | China | 15 | 2019 | ||||||||
| 22 | France | 15 | 2012 | ||||||||
| 23 | Italy | 14 | 2012 | ||||||||
| 24 | United Kingdom | 12 | 2012 | ||||||||
| 25 | Bulgaria | 9 | 2012 | ||||||||
| 26 | Japan | 6.2 | 2010 | ||||||||
| 27 | Netherlands | 5 | 2012 | - | |||||||
| 28 | Ireland | url=http://www.engineersireland.ie/EngineersIreland/media/SiteMedia/groups/societies/roads-tranport/Rail-Freight-in-Ireland-160909.pdf | title=Rail Freight in Ireland | page=22 | year=2009 | access-date=December 18, 2016 | author=Derval Cummins, Booz and Company | website=Engineers Ireland}} | 2007 |
Freight rail by tonne-kilometres per capita
| Rank | Country | Tonne-kilometre per capita | Data year | |||||||
|---|---|---|---|---|---|---|---|---|---|---|
| 1 | Russia | 12,599 | ||||||||
| 2 | Canada | title=Table 17-10-0005-01 Population estimates on July 1, by age and gender | url=https://www150.statcan.gc.ca/t1/tbl1/en/tv.action?pid=1710000501 | website=Statistics Canada | publisher=Statistics Canada | access-date=15 Jan 2025}} | 2022 | |||
| 3 | United States | 9,165 | ||||||||
| 4 | Australia | 2,308 | ||||||||
| 5 | China | 2,150 | 2019 | |||||||
| 6 | Brazil | 1,873.4 | 2024 | |||||||
| 7 | Switzerland | url=http://www.bfs.admin.ch/bfs/portal/en/index/themen/11/01/key.html | title=Mobility and Transport: Key figures | type=web page | publisher=Federal Office for Statistics | location=Switzerland | date=October 2014 | language=en, de, fr, it | access-date=2014-10-14}} | 2013 |
| 8 | Germany | 1,060 | ||||||||
| European Union | 782 |
Brief railway statistics by country
| Country | Area | ||||||||||||||||||||||||||||
|---|---|---|---|---|---|---|---|---|---|---|---|---|---|---|---|---|---|---|---|---|---|---|---|---|---|---|---|---|---|
| (million km2) | Pop. | ||||||||||||||||||||||||||||
| (million) | Rail | ||||||||||||||||||||||||||||
| company | Net | Double track | Electrified | HSR | Passenger-km | ||||||||||||||||||||||||
| (billion) | Freight | ||||||||||||||||||||||||||||
| tonne-km | |||||||||||||||||||||||||||||
| (billion) | HS{{nbh}}Vol | ||||||||||||||||||||||||||||
| (pass. km) | Pass. | Freight | Pass/ pop % | Elec % | (thousands of km) | (modal %) | |||||||||||||||||||||||
| Austria | area | 0.08 | population | 8.57 | ÖBB | Net.km | 9.8 | Dob.km | 4.9 | El.km | 3.5 | HSR km | 0.28 | pass. Transport | 11.2 | frt. Transport | 32.9 | HSR Transport | pass. share | 12.1 | freight share | 41 | pass. per population | elec transport % | 71.9 | ||||
| Brazil | area | 8.51 | population | 212.58 | Multiple | Net.km | 31.7 | Dob.km | 1.86 | El.km | 1.14 | HSR km | 0.00 | pass. Transport | 0.66 | frt. Transport | 398.3 | HSR Transport | 0.00 | pass. share | 0.85 | freight share | 26.9 | pass. per population | 1.21 | elec transport % | 3.59 | ||
| China | area | 9.6 | population | 1,397 | CR | Net.km | 141 | Dob.km | 83 | El.km | 100 | HSR km | 36 | pass. Transport | 1580 | frt. Transport | 3586 | HSR Transport | 200 | pass. share | 41.6 | freight share | 31 | pass. per population | elec transport % | 71.9 | |||
| Egypt | area | 1 | population | 93 | ENR | Net.km | 5 | Dob.km | 1.5 | El.km | 0.07 | HSR km | pass. Transport | 41 | frt. Transport | 4 | HSR Transport | pass. share | freight share | pass. per population | 6.1 | elec transport % | |||||||
| France | area | 0.55 | population | 68 | SNCF | Net.km | 29 | Dob.km | 16 | El.km | 14 | HSR km | 1.8 | pass. Transport | 81 | frt. Transport | 40 | HSR Transport | 48 | pass. share | freight share | pass. per population | 16.8 | elec transport % | 58.2 | ||||
| Germany | area | 0.36 | population | 80.68 | DB | Net.km | 34 | Dob.km | 18 | El.km | 20 | HSR km | 1.2 | pass. Transport | 74 | frt. Transport | 91 | HSR Transport | 22 | pass. share | 10 | freight share | 17 | pass. per population | 22.4 | elec transport % | 60 | ||
| India | area | 3.28 | population | 1,326 | IR | Net.km | 67.3 | Dob.km | 17.4 | El.km | 64.5 | HSR km | pass. Transport | 1065 | frt. Transport | 975 | HSR Transport | pass. share | freight share | pass. per population | 5.5 | elec transport % | 98 | ||||||
| Iran | area | 1.6 | population | 80.04 | RAJA | Net.km | 7 | Dob.km | 1 | El.km | 0.15 | HSR km | 0.25 | pass. Transport | 13 | frt. Transport | 21 | HSR Transport | 0 | pass. share | 4 | freight share | 7 | pass. per population | 0.3 | elec transport % | 1 | ||
| Italy | area | 0.3 | population | 59 | FS | Net.km | 16 | Dob.km | 7 | El.km | 12 | HSR km | 0.82 | pass. Transport | 45 | frt. Transport | 21 | HSR Transport | 9 | pass. share | freight share | pass. per population | elec transport % | 71.6 | |||||
| Japan | area | 0.38 | population | 126 | JR | Net.km | 20 | Dob.km | 8 | El.km | 12 | HSR km | 2.5 | pass. Transport | 253 | frt. Transport | 23 | HSR Transport | 79 | pass. share | 29 | freight share | pass. per population | 69.6 | elec transport % | 100 | |||
| Kazakhstan | area | 2.72 | population | 17 | KTZ | Net.km | 14 | Dob.km | 5 | El.km | 4 | HSR km | pass. Transport | 14 | frt. Transport | 191 | HSR Transport | pass. share | freight share | pass. per population | elec transport % | ||||||||
| Morocco | area | 0.44 | population | 34 | ONCFM | Net.km | 2 | Dob.km | 0.6 | El.km | 1 | HSR km | pass. Transport | 4 | frt. Transport | 6 | HSR Transport | pass. share | freight share | pass. per population | 0.8 | elec transport % | 89 | ||||||
| Netherlands | area | 0.04 | population | 17 | NS | Net.km | 3.2 | Dob.km | 2.0 | El.km | 2.3 | HSR km | 0.1 | pass. Transport | 17.8 | frt. Transport | 6 | HSR Transport | pass. share | 8.8 | freight share | 5 | pass. per population | elec transport % | 70.7 | ||||
| Pakistan | area | 0.796 | population | 192 | PR | Net.km | 7 | Dob.km | El.km | 0.3 | HSR km | pass. Transport | 26 | frt. Transport | 6 | HSR Transport | pass. share | freight share | pass. per population | elec transport % | |||||||||
| Poland | area | 0.31 | population | 38 | PKP | Net.km | 19 | Dob.km | 9 | El.km | 12 | HSR km | pass. Transport | frt. Transport | HSR Transport | pass. share | freight share | pass. per population | elec transport % | 63.7 | |||||||||
| Russia | area | 17.09 | population | 143 | RZD | Net.km | 128 | Dob.km | 36 | El.km | 48 | HSR km | 1.3 | pass. Transport | 173 | frt. Transport | 2090 | HSR Transport | 14 | pass. share | 42 | freight share | 67 | pass. per population | 9.1 | elec transport % | 80 | ||
| Slovakia | 0.049 | 5.45 | ŽSR | url=https://www.zsr.sk/files/o-nas/vyrocne-spravy/vyrocnasprava2018.pdf | title=Výročná Správa ŽSR 2018 | date=2018}} | 1.587 | 0 | url=https://uic-stats.uic.org/ | title=Railisa Stat UIC | website=uic-stats.uic.org | access-date=2020-03-06}} | 6.729 | 0 | |||||||||||||||
| South Africa | area | 1.22 | population | 54 | SAR | Net.km | 24 | Dob.km | 2 | El.km | 8 | HSR km | pass. Transport | 14 | frt. Transport | 109 | HSR Transport | pass. share | freight share | pass. per population | 11 | elec transport % | |||||||
| South Korea | area | 0.1 | population | 50 | KNR | Net.km | 3 | Dob.km | 1 | El.km | 2 | HSR km | 0.32 | pass. Transport | 32 | frt. Transport | 11 | HSR Transport | 10 | pass. share | freight share | pass. per population | 20.4 | elec transport % | 20 | ||||
| Spain | area | 0.51 | population | 46 | Renfe | Net.km | 15 | Dob.km | 5 | El.km | 9 | HSR km | 3.7 | pass. Transport | 21 | frt. Transport | 11 | HSR Transport | 4 | pass. share | freight share | pass. per population | elec transport % | 63.8 | |||||
| Switzerland | area | 0.041 | population | 8.38 | SBB | Net.km | 5.443 | Dob.km | El.km | 5.443 | HSR km | pass. Transport | 22.290 | frt. Transport | 13 | HSR Transport | pass. share | 22.5 | freight share | 37.8 | pass. per population | 40.9 | elec transport % | 100 | |||||
| Taiwan | area | 0.036 | population | 23 | TR | Net.km | 1 | Dob.km | 0.67 | El.km | 0.69 | HSR km | 0.33 | pass. Transport | 9 | frt. Transport | 1 | HSR Transport | pass. share | freight share | pass. per population | elec transport % | |||||||
| Turkey | area | 0.78 | population | 79 | TCDD | Net.km | 9 | Dob.km | 04 | El.km | 1.9 | HSR km | 0.25 | pass. Transport | 6 | frt. Transport | 10 | HSR Transport | pass. share | freight share | pass. per population | elec transport % | 47 | ||||||
| United Kingdom | area | 0.24 | population | 65 | Multiple | Net.km | 16 | Dob.km | El.km | 5 | HSR km | 0.3 | pass. Transport | 48 | frt. Transport | 21 | HSR Transport | pass. share | freight share | pass. per population | elec transport % | 65 | |||||||
| United States | area | 9.6 | population | 324 | AMTK | Net.km | 227 | Dob.km | El.km | HSR km | pass. Transport | frt. Transport | 2820 | HSR Transport | pass. share | freight share | 42 | pass. per population | elec transport % | 1 | |||||||||
| *World* | area | 149 | population | 7,432 | Net.km | 900 | Dob.km | 250 | El.km | 240 | HSR km | 35.44 | pass. Transport | 2468 | frt. Transport | 9486 | HSR Transport | 178 | pass. share | 10 | freight share | 20 | pass. per population | elec transport % | 50 |
References
References
- (Chinese) [https://www.nra.gov.cn/xwzx/zlzx/hytj/202506/P020250606511097164786.pdf 2024 年铁道统计公报 - 2024 Railway Statistical Bulletin]
- "Operations of Indian Railways (Statistics for 2024)".
- "Railway passenger transport statistics - quarterly and annual data".
- "Transport - Passenger transport - OECD Data".
- "Results and Reporting".
- "Leistungen im Personenverkehr".
- "Passengers".
- "Rail passenger transport".
- (2021). "旅客輸送量の推移". [[Ministry of Land, Infrastructure, Transport and Tourism]].
- "详情".
- "Rail passenger transport by type of transport for main undertakings, 2018-2019 (thousand passengers)".
- "Balanço do setor Metroferroviário no Brasil 2024".
- "bilan-ferroviaire-2019.pdf - Autorité de Régulation des Transports".
- (29 July 2019). "Facts & Figures". Transport for London.
- "Метрополитен в цифрах".
- (11 February 2020). "Los usuarios de avión suben un 6,4% en 2019 y los del AVE aumentan un 4,9%".
- (11 February 2019). "Evolución de la demanda – Cierre año 2018". Metro de Madrid.
- (2019-11-08). "Amtrak tours record ridership, revenue for fiscal 2019". [[Washington Post]].
- "2019 Public Transport Fact Book". American Public Transportation Association.
- "Wayback Machine".
- [https://reporting.sbb.ch/verkehr?highlighted=94846b734270bbda2af9409d262ddf1e&years=1,4,5,6,7&scroll=1606]
- "Ukraine railways statistics - Ministry of Infrastructure of Ukraine".
- (19 January 2022). "Indonesia's Railway Renaissance - The Diplomat".
- "2018 Informe Estadistico Annual - Red ferroviaria de pasajeros del área metropolitano de Buenos Aires".
- "Informe Estadístico - Gerencia de Control de Gestión Ferroviaria".
- Internet, JSK. "Passenger rail transport results 2015".
- (21 April 2021). "Egypt moves to stop the bleeding on dilapidated rail network".
- (9 October 2019). "Deliberate train fires cost South African rail service $42.5 mln".
- (2018). "Hållbarhetsredovisning 2017, året i korthet". [[MTR Nordic]].
- (April 2018). "Annual Report 2017". Dopravní podnik hlavnívo města Prahy (DPP).
- [https://www.metrolisboa.pt/institucional/wp-content/uploads/sites/2/2019/01/07_PRRecordeMetroPassageiros2018.pdf Metro de Lisboa Tem Aumento Recorde de Passsageiros Em 2018 Transportando Mais de 169 Milhões de Passageiros] [Lisbon Metro has record increase in passengers in 2018 transporting more than 169 million passengers] 2019.
- "Hat Bazlı Yıllık Yolculuk Sayıları (2018)". Metro İstanbul A.Ş..
- "Performance Report - 2017 Department of Sri Lanka Railways".
- (2018-04-15). "Magyarország, 2017". Központi Statisztikai Hivatal [Central Statistics Bureau].
- (6 October 2016). "Canada's Passenger Railways: Moving People".
- (27 August 2020). "Growth continued in passenger traffic by rail in Finland in 2019".
- (2018-12-10). "Passenger transport by rail". Ssb.no.
- "Nøkkeltall". Ruter As..
- link. Международная Ассоциация "Метро" [International Association of Metros]
- ["Activity Report – 2017"](http://www.metrorex.ro/Resurse/RaportActivitate/Rap%20MTX%20(eng).pdf ). Metrorex S.A..
- (2018). "ביצוע תקציב 2017". [[Ministry of Transport (Israel).
- Juárez, Pilar. (December 7, 2018). "Tren Suburbano alcanza viabilidad financiera". [[Milenio]].
- "50 Years of Reliable Rail in Thailand". GE Report.
- "Ridership Report". Bangkok Expressway and Metro Public Company Ltd..
- (20 February 2018). "Railway rider numbers grow after management revamp".
- (10 January 2019). "The renaissance of the train in Chile".
- (29 March 2019). "Memoria Anual 2018". Metro de Santiago.
- "Statistiques voyageur". EMA - Entreprise Metro d’Alger.
- (2019). "KiwiRail Annual Integrated Report 2019". [[KiwiRail]].
- (16 January 2025). "Nouveau record de fréquentation des trains CFL". CFL.
- link. روزنامه صمت
- (29 May 2020). "Statistical Yearbook 2019". National Statistical Institute.
- (2018). "Statistical handbook of Japan". stat.go.jp.
- "Road Bureau - MLIT Ministry of Land, Infrastructure, Transport and Tourism".
- "China: share of passenger traffic by transport mode 2023".
- (2014). "Железнодорожный транспорт России: вызовы до 2025 года".
- [https://reporting.sbb.ch/verkehr?highlighted=6cda812d1c8447b085f0d33bec23d778&years=1,4,5,6,7&scroll=1906]
- Nandi, Shreya. (2020-09-08). "Vision 2020:- Planning commission".
- "Für ein stabiles Morgen".
- Eurostat (2021) [https://ec.europa.eu/eurostat/databrowser/view/t2020_rk310/default/table?lang=en Statistics Modal split of passenger transport. Data from 2019.] ''ec.europa.eu''
- (2007). "EU Transport in Figures; Statistical Pocketbook". [[European Commission]] Directorate-General for Energy and Transport; [[Eurostat]].
- [https://litra.ch/de/aktuelles/bahnfahrtenstatistik-europa-2024/]
- "Statistical Handbook of Japan 2024".
- "IRG rail Market Monitoring".
- "РЖД".
- "Rail freight transportation - U.S. 2002-2020 Statistic".
- (27 June 2018). "Table 23-10-0057-01 Railway industry summary statistics on freight and passenger transportation". Statistics Canada.
- "Anuário Estatístico Ferroviário".
- Ferroviario, Agencia Reguladora del Transporte. "Sistema Ferroviario Mexicano".
- (November 2020). "Railway freight transport statistics".
- (2015). "Freight Britain: Continuity and certainty for rail freight".
- (March 10, 2015). "Railway transport 2014, quarter 4".
- "Key Transport Statistics 2014 Data".
- (April 3, 2015). "IRG–Rail 3rd Annual Market Monitoring Report 2014".
- (March 6, 2015). "The CEO Magazine – RVR achieves Net Ton per Kilometer (NTK) target".
- (August 30, 2017). "Railway Services (2011 Classification)". [[Israel Central Bureau of Statistics]].
- "Rail Bitre - Statistical Report".
- "ЕМИСС".
- Internet, JSK. "Freight rail transport results 2015".
- Amusan, Folusho. (May 21, 2015). "Freight Rail Usage 2014-15 Quarter 4 Statistical Release".
- [http://www.trafa.se/globalassets/statistik/bantrafik/bantrafik-2015.pdf? Rail Traffic 2015]. Trafikanalys, page 25. Retrieved 2016-12-28.
- (7 June 2022). "Nearly 7 percent more rail freight transport in 2021".
- OECD Competition Committee. (2014). "Recent Developments in Rail Transportation Services".
- Statistics Explained. (2012). "Freight transport statistics".
- (July 30, 2013). "Mobility and Transport: Pocket Statistics 2014". Federal Office for Statistics.
- Anirban Chowdhury. (2016). "Railway Budget 2016: Suresh Prabhu announces measures for freight to increase modal share".
- (30 December 2025). "Railway share reaches all time hight in freigth transport in Brazil)".
- "China Statistical Yearbook 2020".
- Derval Cummins, Booz and Company. (2009). "Rail Freight in Ireland".
- "Table 17-10-0005-01 Population estimates on July 1, by age and gender". Statistics Canada.
- (October 2014). "Mobility and Transport: Key figures". Federal Office for Statistics.
- ÖBB-Holding AG. (2018). "Zahlen Daten Fakten 2017".
- Eurostat. (2016). "Passenger Transport Statistics".
- "Electrified rail network in Europe 2018, by country".
- "Observatório Nacional de Transporte e Logística – ONTL, Infra S.A.".
- "Observatório Nacional de Transporte e Logística, Infra S.A.". ""Anuário Estatístico de Transportes 2014-2023"".
- "Population, total - China". World Bank.
- (Chinese) [http://www.mot.gov.cn/tongjishuju/tielu/202005/P020200702602040585281.pdf 2019 年铁道统计公报 - 2019 Railway Statistical Bulletin]
- (2018). "Výročná Správa ŽSR 2018".
- "Railisa Stat UIC".
- (2024-12-16). "Öffentlicher Verkehr (inkl. Schienengüterverkehr) - Übersicht". Swiss Federal Statistical Office.
- (2014). "Railway Statistics – 2014 Synopsis". UIC (International Union of Railways).
This article was imported from Wikipedia and is available under the Creative Commons Attribution-ShareAlike 4.0 License. Content has been adapted to SurfDoc format. Original contributors can be found on the article history page.
Ask Mako anything about List of countries by rail usage — get instant answers, deeper analysis, and related topics.
Research with MakoFree with your Surf account
Create a free account to save articles, ask Mako questions, and organize your research.
Sign up freeThis content may have been generated or modified by AI. CloudSurf Software LLC is not responsible for the accuracy, completeness, or reliability of AI-generated content. Always verify important information from primary sources.
Report