From Surf Wiki (app.surf) — the open knowledge base
List of countries by intentional homicide rate
None

None
● 2021 Population data from ]] The list of countries by homicide rate is derived from United Nations Office on Drugs and Crime (UNODC) data, and is expressed in number of deaths per 100,000 population per year. For example, a homicide rate of 30 out of 100,000 is presented in the table as "30", and corresponds to 0.03% of the population dying by homicide. The reliability of underlying national murder rate data may vary. Only UNODC-vetted data is used in the main table to maintain consistency. In some cases, it may not be as up to date as other sources.
Homicide rates may be under-reported for political reasons.
A study undertaken by the Geneva Declaration on Armed Violence and Development estimated that there were approximately 490,000 intentional homicides globally in 2004, for a rate of 7.6 per 100,000. UNODC calculated a global estimated rate of 6.9 per 100,000 in 2010; 6.2 per 100,000 in 2012; 6.1 per 100,000 in 2017; and a rate of 5.61 per 100,000 for 2022.
Definition
Intentional homicide is defined by the United Nations Office on Drugs and Crime (UNODC) in its Global Study on Homicide report thus:
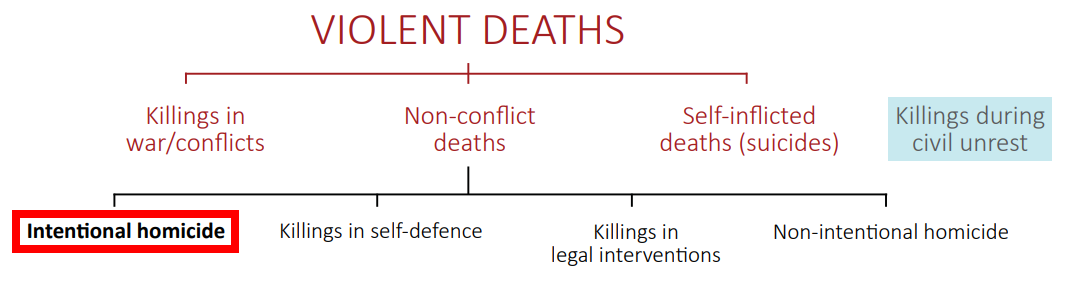
Within the broad range of violent deaths, the core element of intentional homicide is the complete liability of the direct perpetrator, which thus excludes killings directly related to war or conflicts, self-inflicted death (suicide), killings due to legal interventions or justifiable killings (such as self-defence), and those deaths caused when the perpetrator was reckless or negligent but did not intend to take a human life (non-intentional homicide).
Though some discrepancies exist in how specific categories of intentional killings are classified, the definitions used by countries to record data are generally close to the UNODC definition, making the homicide rates highly comparable at the international level. UNODC uses the homicide rate as a proxy for overall violence, as this type of crime is one of the most accurately reported and internationally comparable indicators.
Figures from the Global Study on Homicide are based on the UNODC Homicide Statistics dataset, which is derived from the criminal justice or public health systems of a variety of countries and territories. The homicide rates derived from criminal justice data (typically recorded by police authorities) and the public health system data (recorded when the cause of death is established) may diverge substantially for some countries. The two sources usually match in the Americas, Europe and Oceania, but there are large discrepancies for the three African countries reporting both sources. For the 70 countries in which neither source was made available, figures were derived from WHO statistical models.
Deaths resulting from an armed conflict between states are never included in the count. Killings caused by a non-international armed conflict may or may not be included, depending on the intensity of hostilities and whether it is classified as 'civil unrest' or a clash between organized armed groups.
UNODC's global study
All data in this section comes from the United Nations Office on Drugs and Crime (UNODC) website.
By region
| Region | Overall | |||
|---|---|---|---|---|
| Rate | Rate. | |||
| Female | Rate. | |||
| Male | Counts | |||
| Africa | 3.97 | 17.19 | 156,503 | |
| Americas | 3.40 | 25.52 | 149,654 | |
| Asia | 1.40 | 2.66 | 97,495 | |
| Europe | 1.13 | 3.14 | 15,643 | |
| Oceania | 1.92 | 3.97 | 1,342 | |
| World | 2.11 | 8.25 | 420,638 |
Rates vary widely within regions. See info on secondary sorting within regions and subregions below.
By country, region, or dependent territory
The regions and subregions in the table are based on the United Nations geoscheme since the table sources are United Nations Office on Drugs and Crime (UNODC) reports. See List of countries and territories by the United Nations geoscheme.
The U.N. recognizes that variability in the quality and integrity of data provided by certain countries may minimize country murder rates. Go to the more detailed country info in the references, and the country links in the table for more info.
Table has a total yearly count of homicides for each country. Rates are calculated per 100,000 inhabitants. Rates are to the 3rd decimal place in order to separate countries with low homicide rates.
- Note: When the regions or subregions are sorted the countries are also alphabetically sorted within those regions or subregions. Then shift-click rate or count column heads to secondarily sort countries by rates or counts within the regions or subregions previously sorted.
- Note: Table last fully updated from data retrieved 24 November 2024 from UNODC. Individual countries updated since then.
- Note: Only UNODC-vetted data is used in the table.
- Asterisk () in Location column indicates a Crime in LOCATION article.*
| Location | Rate | Count | Year | Region | Subregion |
|---|---|---|---|---|---|
| us*eft | 4.022 | 1,613 | 2021 | Asia | Southern Asia |
| us*eft | 2.040 | 49 | 2024 | Europe | Southern Europe |
| us*eft | 1.161 | 536 | 2023 | Africa | Northern Africa |
| us*eft | 0 | 0 | 2019 | Oceania | Polynesia |
| us*eft | 2.574 | 2 | 2020 | Europe | Southern Europe |
| us*eft | 4.102 | 1,196 | 2016 | Africa | Sub-Saharan Africa |
| us*eft | 28.328 | 4 | 2014 | Americas | Latin America and the Caribbean |
| us*eft | 10.665 | 10 | 2022 | Americas | Latin America and the Caribbean |
| us*eft | 4.309 | 1,961 | 2022 | Americas | Latin America and the Caribbean |
| us*eft | 2.186 | 61 | 2021 | Asia | Western Asia |
| us*eft | 1.931 | 2 | 2014 | Americas | Latin America and the Caribbean |
| us*eft | 0.854 | 226 | 2023 | Oceania | Australia and New Zealand |
| us*eft | 0.876 | 80 | 2023 | Europe | Western Europe |
| us*eft | 1.990 | 206 | 2024 | Asia | Western Asia |
| us*eft | 31.221 | 128 | 2022 | Americas | Latin America and the Caribbean |
| us*eft | 0.204 | 3 | 2022 | Asia | Western Asia |
| us*eft | 2.340 | 3,830 | 2018 | Asia | Southern Asia |
| us*eft | 15.268 | 43 | 2022 | Americas | Latin America and the Caribbean |
| us*eft | 2.326 | 225 | 2019 | Europe | Eastern Europe |
| us*eft | 1.077 | 125 | 2021 | Europe | Western Europe |
| us*eft | 27.882 | 113 | 2022 | Americas | Latin America and the Caribbean |
| us*eft | 6.183 | 4 | 2023 | Americas | Northern America |
| us*eft | 2.460 | 19 | 2020 | Asia | Southern Asia |
| us*eft | 4.369 | 535 | 2023 | Americas | Latin America and the Caribbean |
| us*eft | 1.224 | 39 | 2023 | Europe | Southern Europe |
| us*eft | 10.547 | 273 | 2021 | Africa | Sub-Saharan Africa |
| us*eft | 19.275 | 40,698 | 2023 | Americas | Latin America and the Caribbean |
| us*eft | 8.223 | 2 | 2006 | Americas | Latin America and the Caribbean |
| us*eft | 0.486 | 2 | 2013 | Asia | South-eastern Asia |
| us*eft | 1.088 | 74 | 2023 | Europe | Eastern Europe |
| us*eft | 5.824 | 635 | 2016 | Africa | Sub-Saharan Africa |
| us*eft | 6.179 | 36 | 2020 | Africa | Sub-Saharan Africa |
| us*eft | 1.839 | 268 | 2011 | Asia | South-eastern Asia |
| us*eft | 4.537 | 1,202 | 2020 | Africa | Sub-Saharan Africa |
| us*eft | 2.273 | 874 | 2022 | Americas | Northern America |
| us*eft | 4.457 | 3 | 2020 | Americas | Latin America and the Caribbean |
| us*eft | 6.348 | 1,248 | 2023 | Americas | Latin America and the Caribbean |
| us*eft | 0.502 | 7,157 | 2020 | Asia | Eastern Asia |
| us*eft | 25.269 | 13,108 | 2022 | Americas | Latin America and the Caribbean |
| us*eft | 3.490 | 1 | 2012 | Oceania | Polynesia |
| us*eft | 17.745 | 906 | 2023 | Americas | Latin America and the Caribbean |
| us*eft | 0.769 | 31 | 2022 | Europe | Southern Europe |
| us*eft | 4.418 | 500 | 2019 | Americas | Latin America and the Caribbean |
| us*eft | 17.092 | 26 | 2007 | Americas | Latin America and the Caribbean |
| us*eft | 1.408 | 13 | 2024 | Asia | Western Asia |
| us*eft | 0.768 | 83 | 2023 | Europe | Eastern Europe |
| us*eft | 0.84 | 50 | 2023 | Europe | Northern Europe |
| us*eft | 26.121 | 19 | 2022 | Americas | Latin America and the Caribbean |
| us*eft | 12.370 | 1,389 | 2022 | Americas | Latin America and the Caribbean |
| us*eft | 4.064 | 49 | 2015 | Asia | South-eastern Asia |
| us*eft | 45.723 | 8,221 | 2023 | Americas | Latin America and the Caribbean |
| us*eft | 1.336 | 1,360 | 2017 | Africa | Northern Africa |
| us*eft | 7.828 | 496 | 2022 | Americas | Latin America and the Caribbean |
| us*eft | 14.573 | 474 | 2012 | Africa | Sub-Saharan Africa |
| us*eft | 1.536 | 21 | 2023 | Europe | Northern Europe |
| us*eft | 12.665 | 151 | 2021 | Africa | Sub-Saharan Africa |
| us*eft | 8.632 | 8,153 | 2012 | Africa | Sub-Saharan Africa |
| us*eft | 2.173 | 20 | 2020 | Oceania | Melanesia |
| us*eft | 0.982 | 55 | 2023 | Europe | Northern Europe |
| us*eft | 1.307 | 897 | 2024 | Europe | Western Europe |
| us*eft | 13.300 | 39 | 2020 | Americas | Latin America and the Caribbean |
| us*eft | 0.354 | 1 | 2009 | Oceania | Polynesia |
| us*eft | 2.042 | 77 | 2019 | Asia | Western Asia |
| us*eft | 0.91 | 770 | 2023 | Europe | Western Europe |
| us*eft | 1.813 | 607 | 2022 | Africa | Sub-Saharan Africa |
| us*eft | 0 | 0 | 2024 | Europe | Southern Europe |
| us*eft | 0.840 | 86 | 2023 | Europe | Southern Europe |
| us*eft | 5.365 | 3 | 2016 | Americas | Northern America |
| us*eft | 6.378 | 8 | 2022 | Americas | Latin America and the Caribbean |
| us*eft | 5.781 | 23 | 2016 | Americas | Latin America and the Caribbean |
| us*eft | 4.151 | 7 | 2019 | Oceania | Micronesia |
| us*eft | 19.990 | 3,520 | 2021 | Americas | Latin America and the Caribbean |
| us*eft | 1.117 | 21 | 2017 | Africa | Sub-Saharan Africa |
| us*eft | 16.198 | 131 | 2022 | Americas | Latin America and the Caribbean |
| us*eft | 41.152 | 4,789 | 2023 | Americas | Latin America and the Caribbean |
| us*eft | 0 | 0 | 2023 | Europe | Southern Europe |
| us*eft | 31.442 | 3,347 | 2023 | Americas | Latin America and the Caribbean |
| us*eft | 0.401 | 30 | 2022 | Asia | Eastern Asia |
| us*eft | 0.774 | 75 | 2023 | Europe | Eastern Europe |
| us*eft | 1.073 | 4 | 2022 | Europe | Northern Europe |
| us*eft | 2.832 | 40,130 | 2022 | Asia | Southern Asia |
| us*eft | 0.307 | 847 | 2022 | Asia | South-eastern Asia |
| us*eft | 2.421 | 1,936 | 2014 | Asia | Southern Asia |
| us*eft | 9.410 | 3,339 | 2013 | Asia | Western Asia |
| us*eft (Central Iraq) | 15.397 | 5,459 | 2021 | Asia | Western Asia |
| us*eft (Kurdistan Region) | 2.246 | 111 | 2013 | Asia | Western Asia |
| us*eft | 0.654 | 34 | 2023 | Europe | Northern Europe |
| us*eft | 0 | 0 | 2016 | Europe | Northern Europe |
| us*eft | 1.626 | 147 | 2022 | Asia | Western Asia |
| us*eft | 0.545 | 322 | 2022 | Europe | Southern Europe |
| us*eft | 49.299 | 1,400 | 2023 | Americas | Latin America and the Caribbean |
| us*eft | 0.23 | 285 | 2023 | Asia | Eastern Asia |
| us*eft | 0.988 | 113 | 2023 | Asia | Western Asia |
| us*eft | 2.634 | 511 | 2022 | Asia | Central Asia |
| us*eft | 4.892 | 2,643 | 2022 | Africa | Sub-Saharan Africa |
| us*eft | 7.167 | 8 | 2012 | Oceania | Micronesia |
| us*eft | 1.986 | 33 | 2021 | Europe | Southern Europe |
| us*eft | 0.252 | 11 | 2020 | Asia | Western Asia |
| us*eft | 2.497 | 47 | 2023 | Europe | Northern Europe |
| us*eft | 2.260 | 128 | 2020 | Asia | Western Asia |
| us*eft | 37.694 | 752 | 2008 | Africa | Sub-Saharan Africa |
| us*eft | 3.117 | 135 | 2012 | Africa | Sub-Saharan Africa |
| us*eft | 5.123 | 2 | 2021 | Europe | Western Europe |
| us*eft | 2.628 | 75 | 2023 | Europe | Northern Europe |
| us*eft | 1.544 | 10 | 2022 | Europe | Western Europe |
| us*eft | 0.568 | 4 | 2023 | Asia | Eastern Asia |
| us*eft | 1.791 | 279 | 2012 | Africa | Sub-Saharan Africa |
| us*eft | 0.724 | 243 | 2021 | Asia | South-eastern Asia |
| us*eft | 0.595 | 3 | 2019 | Asia | Southern Asia |
| us*eft | 0.563 | 3 | 2023 | Europe | Southern Europe |
| us*eft | 4.013 | 2 | 1994 | Oceania | Micronesia |
| us*eft | 2.790 | 11 | 2009 | Americas | Latin America and the Caribbean |
| us*eft | 1.023 | 46 | 2020 | Africa | Sub-Saharan Africa |
| us*eft | 2.232 | 29 | 2022 | Africa | Sub-Saharan Africa |
| us*eft | 5.816 | 12 | 2009 | Africa | Sub-Saharan Africa |
| us*eft | 24.859 | 32,252 | 2023 | Americas | Latin America and the Caribbean |
| us*eft | 0.898 | 1 | 2019 | Oceania | Micronesia |
| us*eft | 0 | 0 | 2008 | Europe | Western Europe |
| us*eft | 5.592 | 196 | 2024 | Asia | Eastern Asia |
| us*eft | 0.789 | 5 | 2023 | Europe | Southern Europe |
| us*eft | 0 | 0 | 2018 | Americas | Latin America and the Caribbean |
| us*eft | 1.694 | 635 | 2024 | Africa | Northern Africa |
| us*eft | 3.573 | 849 | 2011 | Africa | Sub-Saharan Africa |
| us*eft | 3.872 | 2,098 | 2022 | Asia | South-eastern Asia |
| us*eft | 12.450 | 315 | 2021 | Africa | Sub-Saharan Africa |
| us*eft | 2.102 | 617 | 2020 | Asia | Southern Asia |
| us*eft | 0.691 | 125 | 2023 | Europe | Western Europe |
| us*eft | 3.113 | 8 | 2009 | Oceania | Melanesia |
| us*eft | 1.111 | 57 | 2021 | Oceania | Australia and New Zealand |
| us*eft | 11.006 | 754 | 2021 | Americas | Latin America and the Caribbean |
| us*eft | 4.389 | 788 | 2012 | Africa | Sub-Saharan Africa |
| us*eft | 21.741 | 44,200 | 2019 | Africa | Sub-Saharan Africa |
| us*eft | 1.529 | 28 | 2023 | Europe | Southern Europe |
| us*eft | 1.413 | 27 | 2022 | Europe | Northern Europe |
| us*eft | 0.725 | 40 | 2023 | Europe | Northern Europe |
| us*eft | 0.139 | 7 | 2023 | Asia | Western Asia |
| us*eft | 4.335 | 10,729 | 2023 | Asia | Southern Asia |
| us*eft | 11.195 | 2 | 2018 | Oceania | Micronesia |
| us*eft | 1.410 | 74 | 2022 | Asia | Western Asia |
| us*eft | 11.319 | 499 | 2022 | Americas | Latin America and the Caribbean |
| us*eft | 9.402 | 713 | 2010 | Oceania | Melanesia |
| us*eft | 6.961 | 472 | 2022 | Americas | Latin America and the Caribbean |
| us*eft | 8.462 | 2,853 | 2021 | Americas | Latin America and the Caribbean |
| us*eft | 4.316 | 4,764 | 2019 | Asia | South-eastern Asia |
| us*eft | 0.802 | 311 | 2023 | Europe | Eastern Europe |
| us*eft | 0.797 | 82 | 2021 | Europe | Southern Europe |
| us*eft | 15.266 | 489 | 2024 | Americas | Latin America and the Caribbean |
| us*eft | 0.074 | 2 | 2022 | Asia | Western Asia |
| us*eft | 0.48 | 247 | 2023 | Asia | Eastern Asia |
| us*eft | 2.543 | 78 | 2023 | Europe | Eastern Europe |
| us*eft | 1.699 | 15 | 2009 | Africa | Sub-Saharan Africa |
| us*eft | 1.119 | 213 | 2024 | Europe | Eastern Europe |
| us*eft | 7.757 | 11,327 | 2024 | Europe | Eastern Europe |
| us*eft | 3.590 | 472 | 2020 | Africa | Sub-Saharan Africa |
| us*eft | 0 | 0 | 2009 | Africa | Sub-Saharan Africa |
| us*eft | 23.081 | 11 | 2022 | Americas | Latin America and the Caribbean |
| us*eft | 36.696 | 66 | 2022 | Americas | Latin America and the Caribbean |
| us*eft | 28.727 | 10 | 2016 | Americas | Latin America and the Caribbean |
| us*eft | 16.518 | 1 | 2009 | Americas | Northern America |
| us*eft | 40.405 | 42 | 2022 | Americas | Latin America and the Caribbean |
| us*eft | 6.199 | 13 | 2018 | Oceania | Polynesia |
| us*eft | 0 | 0 | 2011 | Europe | Southern Europe |
| us*eft | 3.225 | 6 | 2011 | Africa | Sub-Saharan Africa |
| us*eft | 0.795 | 285 | 2019 | Asia | Western Asia |
| us*eft | 0.967 | 53 | 2021 | Europe | Northern Europe |
| us*eft | 1.314 | 89 | 2023 | Europe | Southern Europe |
| us*eft | 9.335 | 10 | 2022 | Africa | Sub-Saharan Africa |
| us*eft | 2.137 | 176 | 2020 | Africa | Sub-Saharan Africa |
| us*eft | 0.069 | 4 | 2023 | Asia | South-eastern Asia |
| us*eft | 1.124 | 62 | 2023 | Europe | Eastern Europe |
| us*eft | 0.566 | 12 | 2023 | Europe | Southern Europe |
| us*eft | 3.682 | 19 | 2008 | Oceania | Melanesia |
| us*eft | 45.534 | 27,272 | 2022 | Africa | Sub-Saharan Africa |
| us*eft | 14.054 | 1,504 | 2012 | Africa | Sub-Saharan Africa |
| us*eft | 0.691 | 331 | 2023 | Europe | Southern Europe |
| us*eft | 3.427 | 742 | 2019 | Asia | Southern Asia |
| us*eft | 7.281 | 45 | 2022 | Americas | Latin America and the Caribbean |
| us*eft | 1.147 | 121 | 2023 | Europe | Northern Europe |
| us*eft | 0.597 | 53 | 2023 | Europe | Western Europe |
| us*eft | 2.073 | 463 | 2010 | Asia | Western Asia |
| us*eft | 0.912 | 87 | 2020 | Asia | Central Asia |
| us*eft | 3.705 | 2,286 | 2020 | Africa | Sub-Saharan Africa |
| us*eft | 4.813 | 3,307 | 2011 | Asia | South-eastern Asia |
| us*eft | 0.953 | 1 | 2019 | Oceania | Polynesia |
| us*eft | 39.516 | 605 | 2022 | Americas | Latin America and the Caribbean |
| us*eft | 4.621 | 562 | 2020 | Africa | Northern Africa |
| us*eft | 3.228 | 2,817 | 2023 | Asia | Western Asia |
| us*eft | 1.093 | 63 | 2015 | Asia | Central Asia |
| us*eft | 76.582 | 35 | 2022 | Americas | Latin America and the Caribbean |
| us*eft | 0 | 0 | 2019 | Oceania | Polynesia |
| us*eft | 8.768 | 4,143 | 2022 | Africa | Sub-Saharan Africa |
| us*eft | 3.843 | 1,673 | 2021 | Europe | Eastern Europe |
| us*eft | 0.752 | 71 | 2022 | Asia | Western Asia |
| us*eft. England and Wales | 1.148 | 684 | 2021 | Europe | Northern Europe |
| us*eft | 5.763 | 19,796 | 2023 | Americas | Northern America |
| us*eft | 49.631 | 52 | 2012 | Americas | Latin America and the Caribbean |
| us*eft | 11.190 | 383 | 2022 | Americas | Latin America and the Caribbean |
| us*eft | 1.405 | 479 | 2021 | Asia | Central Asia |
| us*eft | 0.321 | 1 | 2020 | Oceania | Melanesia |
| us*eft | 12.607 | 3,568 | 2022 | Americas | Latin America and the Caribbean |
| us*eft | 1.537 | 1,358 | 2011 | Asia | South-eastern Asia |
| us*eft | 6.311 | 1,703 | 2013 | Asia | Western Asia |
| us*eft | 5.250 | 853 | 2015 | Africa | Sub-Saharan Africa |
| us*eft | 6.76 | 1,086 | 2022 | Africa | Sub-Saharan Africa |
Other multi-country studies
A 2024 study by InSight Crime revealed that the Turks and Caicos Islands had the highest homicide rate in Latin America and the Caribbean. Haiti ranked second, followed by St. Kitts and Nevis in third place.
References
Sources
- Look for page numbers on the bottom of pages, and ignore the incorrect page numbers provided by your PDF reader.
References
- "Intentional Homicide". [[United Nations Office on Drugs and Crime]] (UNODC).
- "Victims of Intentional Homicide: 2018". UNODC.
- "Homicide rate {{!}} dataUNODC". [[United Nations Office on Drugs and Crime]]. Timeline graph of "Victims of intentional homicide 1990-2018". Can select a country and a region. Table below graph shows data 1990-2018. Download link icon below table offers multiple formats just for selected country and region. Click "bulk data download" link icon twice at top of page to get Excel file that covers years 1990-2018 for all countries.
- Richards, Patsy. (27 May 1999). "Homicide statistics, research paper 99/56". [[House of Commons of the United Kingdom]] library, Social and general statistics section.
- Fry, Don.. (1985). "Believing the news". Poynter Institute for Media Studies.
- Vizzard, William J.. (2000). "Shots in the dark". Rowman & Littlefield.
- (September 2008). "Global Burden of Armed Violence Report". Geneva Declaration Secretariat.
- [http://www.unodc.org/documents/data-and-analysis/statistics/Homicide/Globa_study_on_homicide_2011_web.pdf 2011 Global Study on Homicide: Trends, Contexts, Data]. "data from 2010 or latest available year". [[United Nations Office on Drugs and Crime]] (UNODC). Vienna, Austria.
- [http://www.unodc.org/documents/gsh/data/GSH2013_Homicide_count_and_rate.xlsx Intentional homicide count and rate per 100,000 population, by country/territory (2000–2012)]. Data (in spreadsheet format) for UNODC report titled "Global Study on Homicide 2013". [[United Nations Office on Drugs and Crime]] (UNODC). Linked from [http://www.unodc.org/gsh/en/data.html Global Study on Homicide – Data: UNODC Homicide Statistics 2013]
- [https://www.unodc.org/documents/data-and-analysis/gsh/Booklet2.pdf Global Study on Homicide 2019. Booklet 2]. [[United Nations Office on Drugs and Crime]] (UNODC). See page 11 for global rate. See page 9 about homicide rates as proxy for overall violence. See Box 1 on page 14 for criminal justice data sources versus public health sources. See figure 2 on page 14 for regional homicide rates in 2017. See figure 3 on page 16 for regional number of homicides. See page 85 about the six-booklet format of this study. Look for page numbers on the bottom of pages, and ignore the incorrect page numbers provided by your PDF reader.
- "Homicide rate".
- "Victims of intentional homicide - Regional Estimate". [[United Nations Office on Drugs and Crime]].
- Newton, Marina Cavalari, Juliana Manjarrés, Christopher. (26 February 2025). "InSight Crime's 2024 Homicide Round-Up".
This article was imported from Wikipedia and is available under the Creative Commons Attribution-ShareAlike 4.0 License. Content has been adapted to SurfDoc format. Original contributors can be found on the article history page.
Ask Mako anything about List of countries by intentional homicide rate — get instant answers, deeper analysis, and related topics.
Research with MakoFree with your Surf account
Create a free account to save articles, ask Mako questions, and organize your research.
Sign up freeThis content may have been generated or modified by AI. CloudSurf Software LLC is not responsible for the accuracy, completeness, or reliability of AI-generated content. Always verify important information from primary sources.
Report