From Surf Wiki (app.surf) — the open knowledge base
Global Peace Index
Measures the relative position of nations' and regions' peacefulness
Measures the relative position of nations' and regions' peacefulness
The Global Peace Index (GPI) is a report produced by the Australia-based NGO Institute for Economics & Peace (IEP) which measures the relative position of nations' and regions' peacefulness. The GPI ranks 163 independent states and territories (collectively accounting for 99.7 per cent of the world's population) according to their levels of peacefulness. In the past decade, the GPI has presented trends of increased global violence and less peacefulness.
The GPI (Global Peace Index) is developed in consultation with an international panel of peace experts from peace institutes and think tanks with data collected by the Economist Intelligence Unit. The Index was first launched in 2007, with subsequent reports being released annually. In 2015 it ranked 165 countries, up from 121 in 2007. The study was conceived by Australian technology entrepreneur Steve Killelea, and is endorsed by individuals such as former UN Secretary-General Kofi Annan, the Dalai Lama, and 2008 Nobel Peace Prize laureate Martti Ahtisaari. The updated index is released each year at events in London, Washington, D.C., and at the United Nations Secretariat in New York City.
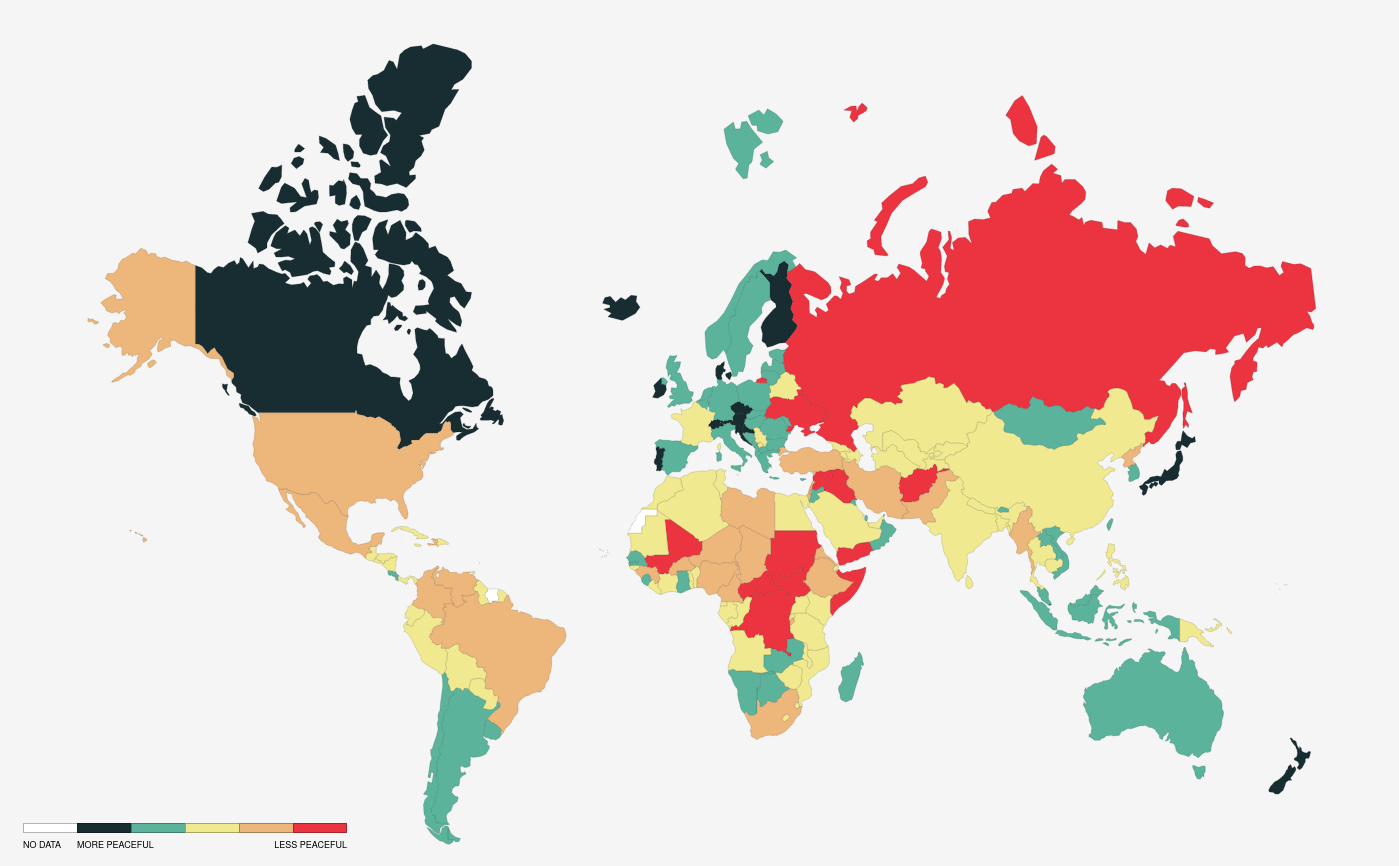
The 2024 GPI indicates Iceland, Ireland, Austria, New Zealand, Singapore, Switzerland, Portugal, Denmark, Slovenia, Malaysia and Canada to be the most peaceful countries, while Yemen, Sudan, South Sudan, Afghanistan, Ukraine, Congo, Russia, Syria, Israel and Mali to be the least peaceful. Among the top 7 most populous nations accounting for over half of the world's population and approximately half of the total GDP of the world, Indonesia ranks 48th overall on the Global Peace Index, China 88th, India 116th, Brazil 131st, the United States 132nd, Pakistan 140th and Nigeria 147th. Findings of the 2024 GPI indicate a 6 per cent deterioration in the global level of peace over the preceding 16 years and a growing inequality in peace between the most and least peaceful countries.
Ten indicators broadly assess what might be described as safety and security in society. Their assertion is that low crime rates, minimal incidences of terrorist acts and violent demonstrations, harmonious relations with neighbouring countries, a stable political scene, and a small proportion of the population being internally displaced or refugees can be suggestive of peacefulness.
Indicators of peacefulness
In 2017, 23 indicators were used to establish peacefulness scores for each country. The indicators were originally selected with the assistance of an expert panel in 2007 and are reviewed by the expert panel on an annual basis. The scores for each indicator are normalised on a scale of 1–5, whereby qualitative indicators are banded into five groupings, and quantitative ones are scored from 1–5, to the third decimal point. A table of the indicators is below. In the table, UCDP stands for the Uppsala Conflict Data Program maintained by the University of Uppsala in Sweden, EIU for The Economist Intelligence Unit, UNSCT for the United Nations Survey of Criminal Trends and Operations of Criminal Justice Systems, ICPS is the International Centre for Prison Studies at King's College London, IISS for the International Institute for Strategic Studies publication The Military Balance, and SIPRI for the Stockholm International Peace Research Institute Arms Transfers Database.
| Indicator | Source | Coding |
|---|---|---|
| Number and duration of internal conflicts | UCDP, IEP | Total number |
| Number of deaths from external organized conflict | UCDP Armed Conflict Dataset | Total number |
| Number of deaths from internal organized conflict | International Institute for Strategic Studies, Armed Conflict Database | Total number |
| Number, duration, and role in external conflicts | UCDP Battle-related Deaths Dataset, IEP | Total number |
| Intensity of organized internal conflict | EIU | Qualitative scale, ranked 1 to 5 |
| Relations with neighbouring countries | EIU | Qualitative scale, ranked 1 to 5 |
| Level of perceived criminality in society | EIU | Qualitative scale, ranked 1 to 5 |
| Number of refugees and displaced persons as percentage of population | UNHCR and IDMC | Refugee population by country or territory of origin, plus the number of a country's internally displaced people (IDP's) as a percentage of the country's total population |
| Political instability | EIU | Qualitative scale, ranked 1 to 5 |
| Impact of terrorism | Global Terrorism Index (IEP) | Quantitative scale, ranked 1 to 5 |
| Political terror | Amnesty International and US State Department | Qualitative scale, ranked 1 to 5 |
| Number of homicides per 100,000 people | UNODC Surveys on Crime Trends and the Operations of Criminal Justice Systems (CTS); EIU estimates | Total number |
| Level of violent crime | EIU | Qualitative scale, ranked 1 to 5 |
| Likelihood of violent demonstrations | EIU | Qualitative scale, ranked 1 to 5 |
| Number of jailed persons per 100,000 people | World Prison Brief, Institute for Criminal Policy Research at Birkbeck, University of London | Total number |
| Number of internal security officers and police per 100,000 people | UNODC CTS; EIU estimates | Total number; Civil police force distinct from national guards or local militia |
| Military expenditure as a percentage of GDP | The Military Balance and IISS | Cash outlays of central or federal government to meet costs of national armed forces, as a percentage of GDP, scores from 1 to 5 based on percentages |
| Number of armed-services personnel per 100,000 | The Military Balance and IISS | All full-time active armed-services personnel |
| Volume of transfers of major conventional weapons as recipient (imports) per 100,000 people | SIPRI Arms Transfers Database | Imports of major conventional weapons per 100,000 people |
| Volume of transfers of major conventional weapons as supplier (exports) per 100,000 people | SIPRI Arms Transfers Database | Exports of major conventional weapons per 100,000 people |
| Financial contribution to UN peacekeeping missions | United Nations Committee on Contributions and IEP | Percentage of countries' "outstanding payments versus their annual assessment to the budget of the current peacekeeping missions" over an average of three years, scored from 1–5 scale based on percentage of promised contributions met |
| Nuclear and heavy weapons capability | The Military Balance, IISS, SIPRI, UN Register of Conventional Arms and IEP | 1–5 scale based on accumulated points; 1 point per armoured vehicle and artillery pieces, 5 points per tank, 20 points per combat aircraft, 100 points per warship, 1000 points for aircraft carrier and nuclear submarine |
| Ease of access to small arms and light weapons | EIU | Qualitative scale, ranked 1 to 5 |
Indicators not already ranked on a 1 to 5 scale were converted by using the following formula: , where max(x) and min(x) are the highest and lowest values for that indicator of the countries ranked in the index. The 0 to 1 scores that resulted were then converted to the 1 to 5 scale. Individual indicators were then weighted according to the expert panel's judgment of their importance. The scores were then tabulated into two weighted sub-indices: internal peace, weighted at 60% of a country's final score, and external peace, weighted at 40% of a country's final score. "Negative Peace", defined as the absence of violence or of the fear of violence, is used as the definition of peace to create the Global Peace Index. An additional aim of the GPI database is to facilitate deeper study of the concept of positive peace, or those attitudes, institutions, and structures that drive peacefulness in society. The GPI also examines relationships between peace and reliable international measures, including democracy and transparency, education and material well-being. As such, it seeks to understand the relative importance of a range of potential determinants, or "drivers", which may influence the nurturing of peaceful societies, both internally and externally.
Statistical analysis is applied to GPI data to uncover specific conditions conducive of peace. Researchers have determined that Positive Peace, which includes the attitudes, institutions, and structures that pre-empt conflict and facilitate functional societies, is the main driver of peace. The eight pillars of positive peace are well-functioning government, sound business environment, acceptance of the rights of others, good relations with neighbours, free flow of information, high levels of human capital, low levels of corruption, and equitable distribution of resources. Well-functioning government, low levels of corruption, acceptance of the rights of others, and good relations with neighbours are more important in countries suffering from high levels of violence. Free flow of information and sound business environment become more important when a country is approaching the global average level of peacefulness, also described as the Mid-Peace level. Low levels of corruption is the only Pillar that is strongly significant across all three levels of peacefulness. This suggests it is an important transformational factor at all stages of a nation's development.
Global Peace Index ranking
Legend
| Rank | Country | Score | Change |
|---|---|---|---|
| 1 | Iceland | 1.095 | |
| 2 | Ireland | 1.260 | |
| 3 | New Zealand | 1.282 | |
| 4 | Austria | 1.294 | |
| 5 | Switzerland | 1.294 | |
| 6 | Singapore | 1.357 | |
| 7 | Portugal | 1.371 | |
| 8 | Denmark | 1.393 | |
| 9 | Slovenia | 1.409 | |
| 10 | Finland | 1.420 | |
| 11 | Czechia | 1.435 | |
| 12 | Japan | 1.440 | |
| 13 | Malaysia | 1.469 | |
| Netherlands | 1.491 | ||
| Canada | 1.491 | ||
| 16 | Belgium | 1.492 | |
| 17 | Hungary | 1.500 | |
| 18 | Australia | 1.505 | |
| 19 | Croatia | 1.519 | |
| 20 | Germany | 1.53 | |
| 21 | Bhutan | 1.536 | |
| Latvia | 1.558 | ||
| Lithuania | 1.558 | ||
| 24 | Estonia | 1.559 | |
| 25 | Spain | 1.578 | |
| 26 | Mauritius | 1.586 | |
| 27 | Qatar | 1.593 | |
| 28 | Slovakia | 1.609 | |
| 29 | Bulgaria | 1.610 | |
| 30 | United Kingdom | 1.634 | |
| 31 | Kuwait | 1.642 | |
| 32 | Norway | 1.644 | |
| 33 | Italy | 1.662 | |
| 34 | Montenegro | 1.685 | |
| 35 | Sweden | 1.709 | |
| 36 | Poland | 1.713 | |
| 37 | Mongolia | 1.719 | |
| Romania | 1.721 | ||
| Vietnam | 1.721 | ||
| 40 | Taiwan | 1.730 | |
| 41 | South Korea | 1.736 | |
| 42 | Oman | 1.738 | |
| 43 | Botswana | 1.743 | |
| 44 | Timor-Leste | 1.758 | |
| 45 | Greece | 1.764 | |
| 46 | Argentina | 1.768 | |
| 47 | Laos | 1.783 | |
| 48 | Uruguay | 1.784 | |
| 49 | Indonesia | 1.786 | |
| 50 | Namibia | 1.789 | |
| 51 | North Macedonia | 1.799 | |
| Albania | 1.812 | ||
| United Arab Emirates | 1.812 | ||
| 54 | Costa Rica | 1.843 | |
| 55 | The Gambia | 1.855 | |
| 56 | Kazakhstan | 1.875 | |
| 57 | Sierra Leone | 1.887 | |
| 58 | Armenia | 1.893 | |
| Madagascar | 1.895 | ||
| Bosnia and Herzegovina | 1.895 | ||
| 61 | Ghana | 1.898 | |
| 62 | Chile | 1.899 | |
| 63 | Kosovo | 1.908 | |
| Serbia | 1.914 | ||
| Zambia | 1.914 | ||
| 66 | Moldova | 1.918 | |
| 67 | Uzbekistan | 1.926 | |
| 68 | Cyprus | 1.933 | |
| 69 | Senegal | 1.936 | |
| 70 | Liberia | 1.939 | |
| 71 | Malawi | 1.955 | |
| 72 | Jordan | 1.957 | |
| 73 | Tanzania | 1.965 | |
| 74 | France | 1.967 | |
| 75 | Paraguay | 1.981 | |
| Nepal | 1.987 | ||
| Angola | 1.987 | ||
| 78 | Kyrgyz Republic | 1.988 | |
| Tajikistan | 1.996 | ||
| Dominican Republic | 1.996 | ||
| 81 | Tunisia | 1.998 | |
| 82 | Equatorial Guinea | 2.004 | |
| 83 | Bolivia | 2.005 | |
| 84 | Panama | 2.006 | |
| 85 | Morocco | 2.012 | |
| 86 | Thailand | 2.017 | |
| Cambodia | 2.019 | ||
| Turkmenistan | 2.019 | ||
| 89 | Trinidad and Tobago | 2.020 | |
| 90 | Saudi Arabia | 2.035 | |
| 91 | Rwanda | 2.036 | |
| 92 | Algeria | 2.042 | |
| 93 | Jamaica | 2.047 | |
| 94 | Côte d'Ivoire | 2.066 | |
| 95 | Azerbaijan | 2.067 | |
| 96 | Peru | 2.073 | |
| 97 | Sri Lanka | 2.075 | |
| 98 | China | 2.093 | |
| 99 | Eswatini | 2.094 | |
| 100 | Bahrain | 2.099 | |
| 101 | Guinea-Bissau | 2.112 | |
| 102 | Cuba | 2.123 | |
| 103 | Republic of the Congo | 2.132 | |
| 104 | El Salvador | 2.136 | |
| 105 | Philippines | 2.148 | |
| 106 | Guyana | 2.149 | |
| 107 | Egypt | 2.157 | |
| 108 | Guatemala | 2.174 | |
| 109 | Georgia | 2.185 | |
| 110 | Mauritania | 2.204 | |
| 111 | Nicaragua | 2.207 | |
| 112 | Benin | 2.211 | |
| 113 | Uganda | 2.217 | |
| 114 | Zimbabwe | 2.223 | |
| 115 | India | 2.229 | |
| 116 | Papua New Guinea | 2.230 | |
| 117 | Gabon | 2.238 | |
| 118 | Guinea | 2.253 | |
| Lesotho | 2.267 | ||
| Belarus | 2.267 | ||
| 121 | Mozambique | 2.273 | |
| 122 | Djibouti | 2.276 | |
| 123 | Bangladesh | 2.318 | |
| South Africa | 2.347 | ||
| Honduras | 2.347 | ||
| 126 | Togo | 2.381 | |
| 127 | Kenya | 2.392 | |
| 128 | United States | 2.443 | |
| 129 | Ecuador | 2.459 | |
| 130 | Brazil | 2.472 | |
| 131 | Libya | 2.478 | |
| 132 | Eritrea | 2.542 | |
| 133 | Burundi | 2.574 | |
| 134 | Chad | 2.593 | |
| 135 | Mexico | 2.636 | |
| 136 | Lebanon | 2.674 | |
| 137 | Cameroon | 2.683 | |
| 138 | Ethiopia | 2.688 | |
| 139 | Venezuela | 2.692 | |
| 140 | Colombia | 2.695 | |
| 141 | Haiti | 2.731 | |
| 142 | Iran | 2.750 | |
| 143 | Niger | 2.759 | |
| 144 | Pakistan | 2.797 | |
| 145 | Palestine | 2.811 | |
| 146 | Turkey | 2.852 | |
| 147 | Iraq | 2.862 | |
| 148 | Nigeria | 2.869 | |
| 149 | North Korea | 2.911 | |
| 150 | Central African Republic | 2.912 | |
| 151 | Somalia | 2.983 | |
| 152 | Burkina Faso | 3.016 | |
| 153 | Myanmar | 3.045 | |
| 154 | Mali | 3.061 | |
| 155 | Israel | 3.108 | |
| 156 | South Sudan | 3.117 | |
| 157 | Syria | 3.184 | |
| 158 | Afghanistan | 3.229 | |
| 159 | Yemen | 3.262 | |
| 160 | Democratic Republic of the Congo | 3.292 | |
| 161 | Sudan | 3.323 | |
| 162 | Ukraine | 3.434 | |
| 163 | Russia | 3.441 |
Note: The GPI's methodology is updated regularly and is improved to reflect the most up-to-date datasets. Each year's GPI report includes a detailed description of the methodology used. Also, the data is revised periodically and so values from previous years may change accordingly. These tables contain the scores and ranking published in the official annual reports. The latest revised data can be found at Vision of Humanity's Interactive world map of the Global Peace Index .
Responses

The Index has received endorsements as a political project from a number of major international figures, including the former Secretary-General of the United Nations, Kofi Annan; former President of Finland and 2008 Nobel Peace Prize laureate Martti Ahtisaari; the 14th Dalai Lama; Archbishop Desmond Tutu; Muhammad Yunus; and former United States President Jimmy Carter.
Jeffrey Sachs at Columbia University said: "The GPI continues its pioneering work in drawing the world's attention to the massive resources we are squandering in violence and conflict." Some at Australian National University say that the GPI report presents "the latest and most comprehensive global data on trends in peace, violence and war" and "provides the world's best analysis of the statistical factors associated with long-term peace, as well as economic analysis on the macroeconomic impacts of everyday violence and war on the global economy."
According to The Economist, the weighting of military expenditure "may seem to give heart to freeloaders: countries that enjoy peace precisely because others (often the USA) care for their defence". The Global Peace Index has been criticized for not including indicators specifically relating to violence against women and children. The impact of Global Peace Index has been lower on the academic study of war and peace than on international organizations.
Previous reports
Notes
References
References
- (June 2023). "Global Peace Index Map » The Most & Least Peaceful Countries".
- [[Institute for Economics & Peace]]. "Global Peace Index 2017".
- Wang, Monica. "The World's Most And Least Peaceful Countries In 2016". Forbes.
- "Global Peace Index".
- (2024-06-11). "'Peacefulness' Is Down Globally. These Are the 10 Most – and Least – Peaceful Countries.".
- (June 2023). "Global Peace Index 2023". [[Institute for Economics & Peace]].
- (2024-01-26). "INDEX". Catholic University of America Press.
- Information about indicators and methodology "2013 Global Peace Index"(PDF). Institute for Economics and Peace. Archived from the original (PDF) on 2013-12-10. Retrieved 2013-06-24.
- Institute for Economics and Peace. "Global Peace Index Report, Methodology, pg. 113–136".
- "2025 Global Peace Index". [[Institute for Economics & Peace]].
- Vizzuality. "Resource Watch".
- ''Endorsers for GPI — Vision of Humanity.'' Retrieved 2013-08-16.
- "Global Peace Index: World Less Peaceful in 2010 Report, Violence Impacting Global Economy $7 Trillion Annually". Phil's Stock World.
- (2017-06-09). "Giving peace a chance? 2017 Global Peace Index". ANU.
- (2007-05-31). "Give peace a rating". The Economist.
- (2007-07-26). "Dark underbelly of the world's most 'peaceful' countries". Christian Science Monitor.
- (2017). "Measuring Peace: Comparability, Commensurability, and Complementarity Using Bottom-Up Indicators". International Studies Review.
This article was imported from Wikipedia and is available under the Creative Commons Attribution-ShareAlike 4.0 License. Content has been adapted to SurfDoc format. Original contributors can be found on the article history page.
Ask Mako anything about Global Peace Index — get instant answers, deeper analysis, and related topics.
Research with MakoFree with your Surf account
Create a free account to save articles, ask Mako questions, and organize your research.
Sign up freeThis content may have been generated or modified by AI. CloudSurf Software LLC is not responsible for the accuracy, completeness, or reliability of AI-generated content. Always verify important information from primary sources.
Report