From Surf Wiki (app.surf) — the open knowledge base
Global Innovation Index
Index for innovation
Index for innovation
| Field | Value |
|---|---|
| title | Global Innovation Index |
| italic title | no |
| cover | Global innovation index 2025 en cover.png |
| caption | Report cover of the Global Innovation Index Report 2025 |
| abbreviation | Glob. Innov. Index |
| language | English, French, Italian, Spanish, Arabic, Chinese, Russian, German, Korean, Portuguese, Japanese |
| publisher | World Intellectual Property Organization |
| history | 2007–present |
| frequency | Annual |
| license | CC BY 4.0 |
| ISSN | 2263-3693 |
| link1 | https://www.wipo.int/global_innovation_index/en/ |
| link1-name | wipo.int/global_innovation_index |
| link2 | https://www.globalinnovationindex.org/Home |
| link2-name | globalinnovationindex.org |
| peer-reviewed = | impact-year = | link1-name = wipo.int/global_innovation_index | link2-name = globalinnovationindex.org
The Global Innovation Index is an annual ranking of countries by their capacity for and success in innovation, published by the World Intellectual Property Organization (WIPO). It was started in 2007 by INSEAD and World Business, a British magazine. Until 2021, it was published by WIPO in partnership with Cornell University, INSEAD, and other organisations and institutions. It is based on both subjective and objective data derived from several sources, including the International Telecommunication Union, the World Bank, and the World Economic Forum.
History
The Global Innovation Index was started in 2007 by INSEAD and World Business, a British magazine. It was created by Soumitra Dutta.
Methodology
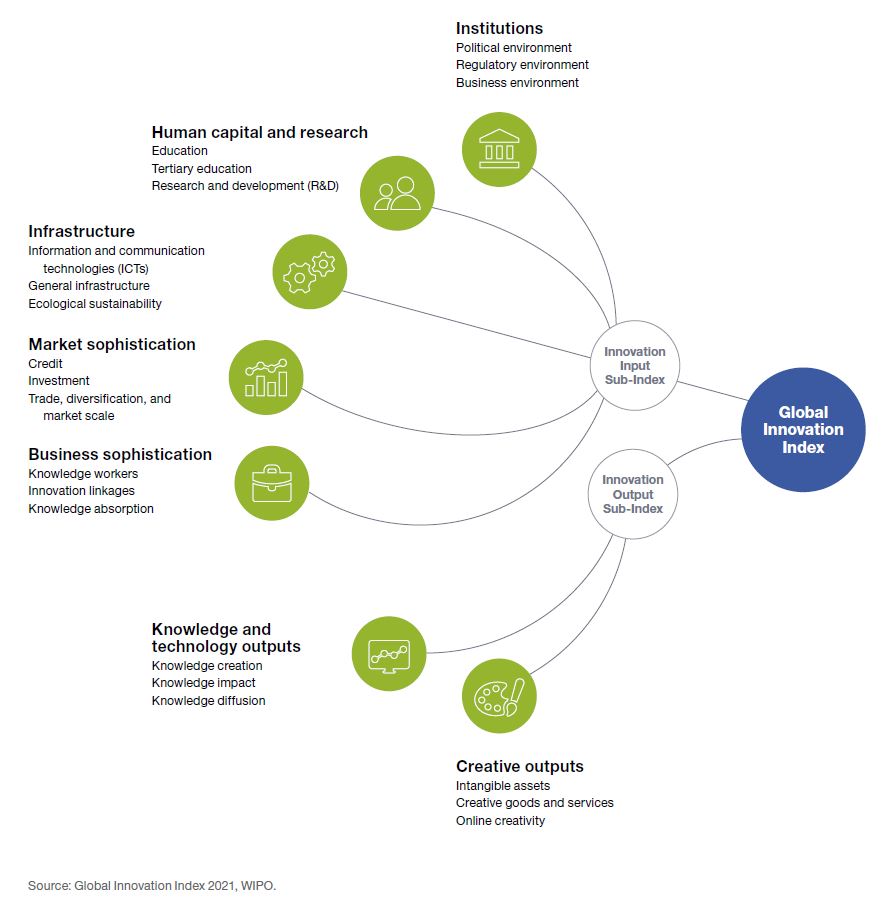
The Global Innovation Index is computed by taking a simple average of the scores in two sub-indices (the Innovation Input Index and Innovation Output Index), which are composed of respectively five and two pillars. Each of those pillars describes an attribute of innovation and have to five indicators, and their score is calculated by the weighted average method.
Since its inception in 2007, the index has had its results analyzed by an increasing number of governments annually, which design policy responses to improve their performance. The index is mentioned in a resolution on science, technology and innovation for sustainable development adopted on 19 December 2019 by the General Assembly of the United Nations.
Criticism
Several scholars have criticized the index for giving excessive significance attributed to factors that are not integral to innovation. For instance, "Ease of Paying Taxes", "Electricity Output" (half-weightage), and "Ease of Protecting Minority Investors" are factors alongside "Ease of Getting Credit" and "Venture Capital Deals." A 2024 study by Sarcina, Paolantonio, Valentini, and Iannone argued that the analysis of the GII pillars is "too aggregated to provide the necessary visibility of the determinants of innovation performance." The research found that indicators within a single pillar "contribute with different weights and have different statistical significance." The authors suggested that the model for calculating the ranking should be redefined to not only consider the "most statistically representative variables" but also to include "geographical, demographic, and socio-economic factors," noting that the importance of various innovation determinants likely differs between countries at different stages of development.
Themes
Every two years, the index covers a theme related to innovation that goes beyond the innovation rankings. In 2020, the theme was "Who will finance innovation?" and shed light on the state of innovation financing by investigating the evolution of existing mechanisms and by pointing to progress and remaining challenges. Previous themes covered topics such as health innovation, environmental innovation, and agricultural and food innovation.
2025 ranking

In 2025, for an economy to feature in the GII 2025, the minimum data coverage requirement is at least 35 indicators in the Innovation Input Sub-Index and 15 indicators in the Innovation Output Sub-Index, with scores for at least two sub-pillars per pillar. In the GII 2025, 139 economies had sufficient data available to be included in the Index. They represent 93.6 percent of the world's population. This year's conceptual framework includes 78 different indicators.
The Global Innovation Index 2025 scores 139 countries and regions.
| Rank | Country and region | Score | Income group |
|---|---|---|---|
| 1 | 66.0 | High-income | |
| 2 | 62.6 | High-income | |
| 3 | 61.7 | High-income | |
| 4 | 60.0 | High-income | |
| 5 | 59.9 | High-income | |
| 6 | 59.1 | High-income | |
| 7 | 57.7 | High-income | |
| 8 | 57.0 | High-income | |
| 9 | 56.9 | High-income | |
| 10 | 56.6 | Upper middle-income | |
| 11 | 55.5 | High-income | |
| 12 | 53.6 | High-income | |
| 13 | 53.4 | High-income | |
| 14 | 52.3 | High-income | |
| 15 | 51.5 | High-income | |
| 16 | 51.1 | High-income | |
| 17 | 51.1 | High-income | |
| 18 | 50.4 | High-income | |
| 19 | 50.1 | High-income | |
| 20 | 49.2 | High-income | |
| 21 | 48.5 | High-income | |
| 22 | 48.0 | High-income | |
| 23 | 47.3 | High-income | |
| 24 | 47.0 | High-income | |
| 25 | 45.5 | High-income | |
| 26 | 45.5 | High-income | |
| 27 | 45.4 | High-income | |
| 28 | 44.9 | High-income | |
| 29 | 44.6 | High-income | |
| 30 | 44.2 | High-income | |
| 31 | 43.9 | High-income | |
| 32 | 42.0 | High-income | |
| 33 | 40.8 | High-income | |
| 34 | 40.6 | Upper middle-income | |
| 35 | 40.1 | High-income | |
| 36 | 40.0 | High-income | |
| 37 | 39.1 | High-income | |
| 38 | 38.2 | Lower middle-income | |
| 39 | 37.7 | High-income | |
| 40 | 37.7 | High-income | |
| 41 | 37.5 | High-income | |
| 42 | 37.4 | High-income | |
| 43 | 37.2 | High-income | |
| 44 | 37.1 | Lower middle-income | |
| 45 | 36.7 | Upper middle-income | |
| 46 | 36.0 | High-income | |
| 47 | 35.5 | High-income | |
| 48 | 34.6 | High-income | |
| 49 | 34.3 | High-income | |
| 50 | 33.6 | Lower middle-income | |
| 51 | 33.1 | High-income | |
| 52 | 32.9 | Upper middle-income | |
| 53 | 32.5 | Upper middle-income | |
| 54 | 31.7 | Upper middle-income | |
| 55 | 31.3 | Upper middle-income | |
| 56 | 31.2 | Upper middle-income | |
| 57 | 31.1 | Lower middle-income | |
| 58 | 30.5 | Upper middle-income | |
| 59 | 30.5 | Upper middle-income | |
| 60 | 30.3 | High-income | |
| 61 | 30.1 | Upper middle-income | |
| 62 | 30.0 | High-income | |
| 63 | 29.8 | Upper middle-income | |
| 64 | 29.8 | Upper middle-income | |
| 65 | 29.7 | Lower middle-income | |
| 66 | 29.7 | Lower middle-income | |
| 67 | 29.6 | Upper middle-income | |
| 68 | 28.8 | High-income | |
| 69 | 28.7 | High-income | |
| 70 | 28.5 | Lower middle-income | |
| 71 | 28.5 | Upper middle-income | |
| 72 | 28.4 | High-income | |
| 73 | 28.2 | High-income | |
| 74 | 27.4 | Upper middle-income | |
| 75 | 27.2 | High-income | |
| 76 | 27.0 | Lower middle-income | |
| 77 | 26.8 | Upper middle-income | |
| 78 | 26.7 | Upper middle-income | |
| 79 | 26.5 | Lower middle-income | |
| 80 | 26.5 | Upper middle-income | |
| 81 | 26.3 | Upper middle-income | |
| 82 | 25.9 | High-income | |
| 83 | 25.2 | Upper middle-income | |
| 84 | 25.1 | High-income | |
| 85 | 25.1 | Upper middle-income | |
| 86 | 24.7 | Lower middle-income | |
| 87 | 24.6 | Upper middle-income | |
| 88 | 24.5 | High-income | |
| 89 | 23.8 | Lower middle-income | |
| 90 | 23.6 | Lower middle-income | |
| 91 | 23.5 | Lower middle-income | |
| 92 | 23.4 | Upper middle-income | |
| 93 | 22.9 | Lower middle-income | |
| 94 | 22.9 | Upper middle-income | |
| 95 | 22.6 | Lower middle-income | |
| 96 | 22.6 | Lower middle-income | |
| 97 | 22.6 | Upper middle-income | |
| 98 | 22.2 | Upper middle-income | |
| 99 | 22.1 | Lower middle-income | |
| 100 | 21.9 | Lower middle-income | |
| 101 | 21.9 | Lower middle-income | |
| 102 | 21.4 | Upper middle-income | |
| 103 | 21.4 | Lower middle-income | |
| 104 | 21.1 | Low-income | |
| 105 | 21.1 | Lower middle-income | |
| 106 | 21.0 | Lower middle-income | |
| 107 | 20.2 | Lower middle-income | |
| 108 | 20.2 | Lower middle-income | |
| 109 | 20.1 | Lower middle-income | |
| 110 | 19.7 | Lower middle-income | |
| 111 | 19.6 | Lower middle-income | |
| 112 | 19.6 | Lower middle-income | |
| 113 | 19.5 | Upper middle-income | |
| 114 | 19.3 | High-income | |
| 115 | 18.9 | Lower middle-income | |
| 116 | 18.2 | Lower middle-income | |
| 117 | 18.1 | Low-income | |
| 118 | 17.8 | Lower middle-income | |
| 119 | 17.7 | Lower middle-income | |
| 120 | 17.6 | Low-income | |
| 121 | 17.5 | Low-income | |
| 122 | 17.3 | Lower middle-income | |
| 123 | 17.1 | Upper middle-income | |
| 124 | 17.1 | Lower middle-income | |
| 125 | 16.0 | Low-income | |
| 126 | 15.9 | Low-income | |
| 127 | 15.8 | Low-income | |
| 128 | 15.4 | Low-income | |
| 129 | 15.4 | Lower middle-income | |
| 130 | 15.4 | Lower middle-income | |
| 131 | 15.4 | Low-income | |
| 132 | 14.9 | Low-income | |
| 133 | 14.9 | Lower middle-income | |
| 134 | 14.4 | Low-income | |
| 135 | 14.0 | Low-income | |
| 136 | 13.7 | Lower middle-income | |
| 137 | 13.6 | Lower middle-income | |
| 138 | 13.0 | Lower middle-income | |
| 139 | 11.9 | Low-income |
2024 ranking

The Global Innovation Index 2024 scores 133 countries and regions. The sorting order is in descending score.
| Rank | Country and region | Score | Income group |
|---|---|---|---|
| 1 | 67.5 | High-income | |
| 2 | 64.5 | High-income | |
| 3 | 62.4 | High-income | |
| 4 | 61.2 | High-income | |
| 5 | 61.0 | High-income | |
| 6 | 60.9 | High-income | |
| 7 | 59.4 | High-income | |
| 8 | 58.8 | High-income | |
| 9 | 58.1 | High-income | |
| 10 | 57.1 | High-income | |
| 11 | 56.3 | Upper middle-income | |
| 12 | 55.4 | High-income | |
| 13 | 54.1 | High-income | |
| 14 | 52.9 | High-income | |
| 15 | 52.7 | High-income | |
| 16 | 52.3 | High-income | |
| 17 | 50.3 | High-income | |
| 18 | 50.1 | High-income | |
| 19 | 50.0 | High-income | |
| 20 | 49.1 | High-income | |
| 21 | 49.1 | High-income | |
| 22 | 48.5 | High-income | |
| 23 | 48.1 | High-income | |
| 24 | 47.7 | High-income | |
| 25 | 45.9 | High-income | |
| 26 | 45.3 | High-income | |
| 27 | 45.1 | High-income | |
| 28 | 44.9 | High-income | |
| 29 | 44.8 | High-income | |
| 30 | 44.0 | High-income | |
| 31 | 43.7 | High-income | |
| 32 | 42.8 | High-income | |
| 33 | 40.5 | Upper middle-income | |
| 34 | 40.2 | High-income | |
| 35 | 40.1 | High-income | |
| 36 | 39.6 | High-income | |
| 37 | 39.0 | Upper middle-income | |
| 38 | 38.5 | High-income | |
| 39 | 38.3 | Lower middle-income | |
| 40 | 37.0 | High-income | |
| 41 | 36.9 | Upper middle-income | |
| 42 | 36.4 | High-income | |
| 43 | 36.3 | High-income | |
| 44 | 36.2 | Lower middle-income | |
| 45 | 36.2 | High-income | |
| 46 | 34.3 | High-income | |
| 47 | 33.9 | High-income | |
| 48 | 33.4 | High-income | |
| 49 | 32.9 | High-income | |
| 50 | 32.7 | Upper middle-income | |
| 51 | 32.6 | High-income | |
| 52 | 32.3 | Upper middle-income | |
| 53 | 31.1 | Lower middle-income | |
| 54 | 30.6 | Upper middle-income | |
| 55 | 30.6 | Upper middle-income | |
| 56 | 30.4 | Upper middle-income | |
| 57 | 30.4 | Upper middle-income | |
| 58 | 29.9 | Upper middle-income | |
| 59 | 29.7 | High-income | |
| 60 | 29.5 | Lower middle-income | |
| 61 | 29.2 | Upper middle-income | |
| 62 | 29.1 | High-income | |
| 63 | 29.0 | Upper middle-income | |
| 64 | 28.9 | Lower middle-income | |
| 65 | 28.9 | Upper middle-income | |
| 66 | 28.8 | Lower middle-income | |
| 67 | 28.7 | Lower middle-income | |
| 68 | 28.7 | Upper middle-income | |
| 69 | 28.3 | Upper middle-income | |
| 70 | 28.3 | Upper middle-income | |
| 71 | 28.1 | High-income | |
| 72 | 27.6 | High-income | |
| 73 | 27.5 | Lower middle-income | |
| 74 | 27.1 | High-income | |
| 75 | 26.7 | Upper middle-income | |
| 76 | 26.4 | Upper middle-income | |
| 77 | 26.1 | High-income | |
| 78 | 25.7 | Upper middle-income | |
| 79 | 25.7 | Upper middle-income | |
| 80 | 25.5 | Upper middle-income | |
| 81 | 25.4 | Lower middle-income | |
| 82 | 24.7 | High-income | |
| 83 | 24.7 | Lower middle-income | |
| 84 | 24.5 | Upper middle-income | |
| 85 | 24.2 | Upper middle-income | |
| 86 | 23.7 | Lower middle-income | |
| 87 | 23.1 | Upper middle-income | |
| 88 | 22.8 | High-income | |
| 89 | 22.6 | Lower middle-income | |
| 90 | 22.3 | Lower middle-income | |
| 91 | 22.0 | Lower middle-income | |
| 92 | 22.0 | Lower middle-income | |
| 93 | 21.9 | Upper middle-income | |
| 94 | 21.5 | Lower middle-income | |
| 95 | 21.3 | Upper middle-income | |
| 96 | 21.0 | Lower middle-income | |
| 97 | 20.8 | Upper middle-income | |
| 98 | 20.6 | Upper middle-income | |
| 99 | 20.4 | Lower middle-income | |
| 100 | 20.2 | Lower middle-income | |
| 101 | 20.0 | Lower middle-income | |
| 102 | 20.0 | Upper middle-income | |
| 103 | 19.9 | Lower middle-income | |
| 104 | 19.7 | Low-income | |
| 105 | 19.3 | Upper middle-income | |
| 106 | 19.1 | Lower middle-income | |
| 107 | 18.6 | Lower middle-income | |
| 108 | 18.4 | High-income | |
| 109 | 18.1 | Lower middle-income | |
| 110 | 17.9 | Low-income | |
| 111 | 17.8 | Lower middle-income | |
| 112 | 17.5 | Lower middle-income | |
| 113 | 17.1 | Lower middle-income | |
| 114 | 16.7 | Lower middle-income | |
| 115 | 16.2 | Lower middle-income | |
| 116 | 15.7 | Lower middle-income | |
| 117 | 15.6 | Low-income | |
| 118 | 15.6 | Lower middle-income | |
| 119 | 15.4 | Lower middle-income | |
| 120 | 15.3 | Lower middle-income | |
| 121 | 14.9 | Low-income | |
| 122 | 14.6 | Upper middle-income | |
| 123 | 14.4 | Lower middle-income | |
| 124 | 14.0 | Lower middle-income | |
| 125 | 13.8 | Lower middle-income | |
| 126 | 13.2 | Lower middle-income | |
| 127 | 13.2 | Low-income | |
| 128 | 13.1 | Low-income | |
| 129 | 12.8 | Low-income | |
| 130 | 12.3 | Low-income | |
| 131 | 11.8 | Low-income | |
| 132 | 11.2 | Low-income | |
| 133 | 10.2 | Lower middle-income |
References
References
- "Academic Network – Portulans Institute".
- "Republic Act No. 11293 : The Philippine Innovation Act declares the GII as a measure of innovation".
- In July 2021, the Intellectual Property Strategy Headquarters, under the Japanese Prime Minister's Office, decided on the Intellectual Property Promotion Plan 2021, which set forth a plan of annual action related to intellectual property for all ministries and agencies. In the first part of the plan, WIPO's GII is cited (p. 5): https://www.kantei.go.jp/jp/singi/titeki2/kettei/chizaikeikaku20210713.pdf
- The GII is also cited throughout the official Malaysian Government report, the Twelfth Malaysia Plan (RMK12): https://rmke12.epu.gov.my/en {{Webarchive. link. (4 June 2023 .)
- "Resolution No. 01/NQ-CP on solutions for implementation of socio economic development plan in 2021".
- (17 September 2015). "UK ranked as world-leader in innovation". Department for Business, Innovation & Skills.
- (2020). "New Technologies, Development and Application III". Springer International Publishing.
- (2024). "Innovation's Performance: A Transnational Analysis Based on the Global Innovation Index". Procedia Computer Science.
- "Publications: Global Innovation Index". Wipo.int.
- (2025). "The Global Innovation Index. Appendix I – Conceptual and measurement framework of the Global Innovation Index".
- (2025). "Global Innovation Index 2025. Appendix III - Sources and definitions".
- (2025). "Global Innovation Index 2025 - GII 2025 results".
- WIPO. "Global Innovation Index 2024, 17th Edition".
- Akhilesh, Kumar. (2024-06-12). "Political Economy of STI in China: Analyzing Official Discourse on Science, Technology and Innovation-Driven Development in the Contemporary China". BRICS Journal of Economics.
- (17 September 2015). "UK ranked as world-leader in innovation". Department for Business, Innovation & Skills.
- 9782952221085. Archived 18 February 2016.
- 9780821382691.
- 9780415742528.
- [https://documents-dds-ny.un.org/doc/UNDOC/GEN/N19/437/01/PDF/N1943701.pdf?OpenElement A/RES/74/229: Seventy-fourth session: Agenda item 20 (b): Globalization and interdependence: science, technology and innovation for sustainable development: Resolution adopted by the General Assembly on 19 December 2019]. Accessed December 2021.
This article was imported from Wikipedia and is available under the Creative Commons Attribution-ShareAlike 4.0 License. Content has been adapted to SurfDoc format. Original contributors can be found on the article history page.
Ask Mako anything about Global Innovation Index — get instant answers, deeper analysis, and related topics.
Research with MakoFree with your Surf account
Create a free account to save articles, ask Mako questions, and organize your research.
Sign up freeThis content may have been generated or modified by AI. CloudSurf Software LLC is not responsible for the accuracy, completeness, or reliability of AI-generated content. Always verify important information from primary sources.
Report