From Surf Wiki (app.surf) — the open knowledge base
Economy of the Philippines
none

none
| Field | Value | |||||||||||||
|---|---|---|---|---|---|---|---|---|---|---|---|---|---|---|
| image | Makati City Lights (Jopet Sy) - Flickr.jpg | |||||||||||||
| image size | 335px | |||||||||||||
| caption | Metro Manila, the economic center of the Philippines | |||||||||||||
| currency | Philippine peso (Filipino: ***piso***; sign: ₱; code: **PHP**) | |||||||||||||
| year | Calendar year | |||||||||||||
| organs | ADB, AIIB, AFTA, APEC, ASEAN, EAS, G-24, RCEP, WTO and others | |||||||||||||
| group | {{plainlist | |||||||||||||
| * Developing/Emerging<ref name | "IMFWEO" | |||||||||||||
| * Lower-middle income economy<ref>{{Cite web | title | World Bank Country and Lending Groups | url=https://datahelpdesk.worldbank.org/knowledgebase/articles/906519-world-bank-country-and-lending-groups | access-date=September 29, 2019 | website=World Bank}} | |||||||||
| population | {{plainlist | |||||||||||||
| 112,729,484 (2024)<ref name | "PSA_POPCEN"{{Cite press release | last=Mapa | first=Dennis | author-link1=Dennis Mapa | title=2024 Census of Population (POPCEN) Population Counts Declared Official by the President | url=https://psa.gov.ph/content/2024-census-population-popcen-population-counts-declared-official-president | archive-url=https://archive.today/20250717053140/https://psa.gov.ph/content/2024-census-population-popcen-population-counts-declared-official-president | |||||||
| publisher | Philippine Statistics Authority | archive-date=July 17, 2025 | url-status=live}}}} | |||||||||||
| gdp | {{plainlist | |||||||||||||
| * $497.49 billion (nominal; 2025 est.)<ref name | "IMFWEO-202504" | |||||||||||||
| * $1.479 trillion (PPP; 2025 est.)<ref name | "IMFWEO-202504" / | |||||||||||||
| gdp rank | {{plainlist | |||||||||||||
| growth | {{plainlist | |||||||||||||
| * 5.6% (2024)<ref name | "IMFWEO"/ | |||||||||||||
| * 4.4% (2025)<ref>{{Cite press release | last | Mapa | first=Dennis | author-link1=Dennis Mapa | title=GDP Grows by 3.0 Percent in the Fourth Quarter of 2025: Brings the Full-Year 2025 GDP Year-on-Year Growth Rate to 4.4 Percent | url=https://psa.gov.ph/statistics/national-accounts | access-date=January 29, 2026 | publisher=Philippine Statistics Authority}} | ||||||
| * 5.8% (2026p)<ref name | "IMFWEO"/ | |||||||||||||
| per capita | {{plainlist | |||||||||||||
| per capita rank | {{plainlist | |||||||||||||
| sectors | {{plainlist | |||||||||||||
| * (2024)<ref name | "SEFIPH"}} | |||||||||||||
| components | {{plainlist | |||||||||||||
| average gross salary | ₱21,544 / US$376 monthly (2024) | |||||||||||||
| inflation | 1.7% (2025) | |||||||||||||
| poverty | {{plainlist | |||||||||||||
| * 15.5% (2023)<ref>{{Cite press release | last | Mapa | first=Dennis | author-link1=Dennis Mapa | title=Percentage of Filipino Families Classified as Poor Declined to 10.9 percent in 2023 | url=https://psa.gov.ph/statistics/poverty | url-status=live | archive-url=https://web.archive.org/web/20240722043532/https://psa.gov.ph/statistics/poverty | archive-date=July 22, 2024 | website=Philippine Statistics Authority}} | ||||
| * 18.0% on less than $3.65/day (2021)<ref>{{Cite web | title | Poverty headcount ratio at $3.65 a day (2017 PPP) (% of population) | url=https://data.worldbank.org/indicator/SI.POV.LMIC?locations=PH | access-date=November 3, 2019 | publisher=World Bank}} | |||||||||
| gini | 39.3 (2023) | |||||||||||||
| hdi | {{plainlist | |||||||||||||
| * 0.720 (2023, 117th)<ref name | "HDI" | |||||||||||||
| * 0.597 (2023, IHDI)<ref name | "HDI"/ | |||||||||||||
| cpi | 33 out of 100 points (2024, 114th rank) | |||||||||||||
| labor | {{plainlist | |||||||||||||
| * (November 2025 est.)<ref name | "PSA_LFS" | |||||||||||||
| occupations | {{plainlist | |||||||||||||
| * (November 2025 est.)<ref name | "PSA_LFS"/ | |||||||||||||
| unemployment | {{plainlist | |||||||||||||
| * (November 2025 est.)<ref name | "PSA_LFS"/ | |||||||||||||
| industries | {{hlist | Electronics assembly | aerospace/parts | agribusiness | automotive/parts | IT and business process outsourcing | food processing | furnitures | pharmaceuticals | petrochemicals | metal casting and mining | shipbuilding | textile | tourism |
| exports | $116.52 billion (2023) | |||||||||||||
| export-goods | {{ublist | |||||||||||||
| Ignition wirings 3.1% | Other 18.9% (2024)<ref name | "extIntAgriTrade-2024" | ||||||||||||
| export-partners | {{ublist | |||||||||||||
| imports | $159.29 billion (2022) | |||||||||||||
| import-goods | {{ublist | Electronic products 21.5% | Agricultural products 15.3% | Mineral products 14.9% | Transport equipment 8.9% Industrial machinery 4.5% | Iron and steel 4.1% | Other 30.8% (2024) | |||||||
| import-partners | {{ublist | |||||||||||||
| savings | ₱7.70 trillion (2024) | |||||||||||||
| debt | {{plainlist | |||||||||||||
| gross external debt | {{plainlist | |||||||||||||
| * 29.8% of GDP (2024p)<ref name | "SEFIPH"/}} | |||||||||||||
| revenue | {{plainlist | |||||||||||||
| expenses | {{plainlist | |||||||||||||
| balance | {{plainlist | |||||||||||||
| reserves | $111.08 billion (November 2025) | |||||||||||||
| current account | {{plainlist | |||||||||||||
| * -3.8% of GDP (2024)<ref name | "BSP-SDDS"/}} | |||||||||||||
| FDI | {{plainlist | |||||||||||||
| * $125.53 billion (Inward, 2024)<ref name | "PHWIR2025" | |||||||||||||
| aid | *recipient*: $1.67 billion (2011) | |||||||||||||
| credit | {{plainlist | |||||||||||||
| * Japan Credit Rating Agency:<ref>{{Cite web | title | Philippines: Japan Credit Rating Agency, Ltd. | url=https://www.jcr.co.jp/download/e15b09c9b02504ceb98cc607d8ee3c3346cc3cbbf1bc89ce99/22i0092_f.pdf | access-date=March 10, 2023 | website=JCR}} | |||||||||
| * Standard & Poor's:<ref>{{Cite news | last | Gonzalez | first=Anna Leah | title=S&P Global Ratings raises PH credit outlook to positive | url=https://www.pna.gov.ph/articles/1238733 | access-date=November 26, 2024 | website=Philippine News Agency}} | |||||||
| * Moody's:<ref>{{Cite news | last | Moaje | first=Marita | title=Moody's affirms PH's 'BAA2' investment-grade credit rating | url=https://www.pna.gov.ph/articles/1231837 | access-date=August 23, 2024 | website=Philippine News Agency}} | |||||||
| * Fitch:<ref>{{Cite web | title | Philippines | url=https://www.fitchratings.com/entity/philippines-80442253 | access-date=May 22, 2023 | website=Fitch Ratings}} | |||||||||
| spelling | US | |||||||||||||
| country | Philippines |
- Developing/Emerging
- Lower-middle income economy
- Newly industrialized country 112,729,484 (2024){{Cite press release |last=Mapa |first=Dennis |author-link1=Dennis Mapa |title=2024 Census of Population (POPCEN) Population Counts Declared Official by the President |url=https://psa.gov.ph/content/2024-census-population-popcen-population-counts-declared-official-president |archive-url=https://archive.today/20250717053140/https://psa.gov.ph/content/2024-census-population-popcen-population-counts-declared-official-president
- $497.49 billion (nominal; 2025 est.)
- $1.479 trillion (PPP; 2025 est.)
- 32nd (nominal; 2025 est.)
- 30th (PPP; 2025 est.)
- 5.6% (2024)
- 4.4% (2025)
- 5.8% (2026p)
- $4,350 (nominal; 2025 est.)
- $12,935 (PPP; 2025 est.)
- 124th (nominal; 2025 est.)
- 114th (PPP; 2025 est.)
- Agriculture: 8.0%
- Industry: 29.1%
- Services: 62.9%
- (2024)}}
- Household consumption 72.5%
- Government consumption 14.5%
- Gross capital formation 23.6%
- Exports of goods and services 26.9%
- Less: Imports of goods and services 37.5%
- Other source 12.6%
- (2024)}}
- 15.5% (2023)
- 18.0% on less than $3.65/day (2021)
- 0.720 (2023, 117th)
- 0.597 (2023, IHDI)
- 51.52 million
- 64.0% participation rate
- (November 2025 est.)
- Agriculture: 20.0%
- Industry: 17.9%
- Services: 62.1%
- (November 2025 est.)
- 4.4%
- 2.25 million unemployed
- (November 2025 est.) | export-goods = {{ublist| Electronic products 53.4%| Agricultural products 10.6%| Manufactured goods 6.4%| Mineral products 4.1%| | Machinery and Transport equipment 3.5% | Ignition wirings 3.1%| Other 18.9% (2024) | export-partners = {{ublist| United States 16.6%| ASEAN 15.0%| Japan 14.1%| Hong Kong 13.1%| China 12.9%| European Union 11.0%| Other 16.3% (2024) | import-goods = {{ublist|Electronic products 21.5% |Agricultural products 15.3% |Mineral products 14.9% |Transport equipment 8.9% Industrial machinery 4.5% |Iron and steel 4.1% |Other 30.8% (2024) | import-partners = {{ublist| ASEAN 28.2%| China 25.7%| Japan 7.9%| South Korea 7.5%| United States 6.4%| European Union 5.8%| Other 18.5% (2024)
- ₱16.05 trillion
- ($280.15 billion)
- 60.7% of GDP (2024)}}
- $137.63 billion
- 29.8% of GDP (2024p)}}
- ₱4.42 trillion
- ($77.13 billion)
- 16.7% of GDP (2024)
- ₱5.92 trillion
- ($103.42 billion)
- 22.4% of GDP (2024)
- -₱1.51 trillion
- (-$26.28 billion)
- −5.7% of GDP (2024)
- -$17.51 billion
- -3.8% of GDP (2024)}}
- $125.53 billion (Inward, 2024)
- $70.74 billion (Outward, 2024)
- Japan Credit Rating Agency:
- A− (Domestic/Foreign)
- A− (Bonds)
- Outlook: Stable
- Standard & Poor's:
- BBB+ (Domestic/Foreign)
- BBB+ (T&C Assessment)
- Outlook: Positive
- Moody's:
- Baa2
- Outlook: Stable
- Fitch:
- BBB (Domestic/Foreign)
- BBB+ (Country Ceiling)
- Outlook: Stable The economy of the Philippines is an emerging market, and considered as a newly industrialized country in the Asia-Pacific region. In 2025, the Philippine economy is estimated to be at ₱28.50 trillion ($497.5 billion), making it the world's 32nd largest by nominal GDP and 9th largest in Asia according to the International Monetary Fund.
The Philippine economy is a service-oriented economy, with relatively more modest contributions from the manufacturing and agriculture sectors. It has experienced significant economic growth and transformation in the past, posting one of the highest GDP growth rates in Asia. With an average annual growth rate of around 6 percent since 2010, the country has emerged as one of the fastest-growing economies in the world. The Philippines is a founding member of the United Nations, Association of Southeast Asian Nations, Asia-Pacific Economic Cooperation, East Asia Summit and the World Trade Organization. The Asian Development Bank (ADB) is headquartered in the Ortigas Center located in the city of Mandaluyong, Metro Manila.
The country's primary exports include semiconductors and electronic products, transport equipment, garments, chemical products, copper, nickel, abaca, coconut oil, and fruits. Its major trading partners include Japan, China, the United States, Singapore, South Korea, the Netherlands, Hong Kong, Germany, Taiwan, and Thailand.
In 2017, the Philippine economy was projected to become the 9th largest in Asia and 19th largest in the world by 2050. By 2035, the Filipino economy is predicted to be the 22nd largest in the world.
The Philippines has been named as one of the Tiger Cub Economies, alongside Indonesia, Malaysia, Vietnam, and Thailand. However, major problems remain, mainly related to alleviating the wide income and growth disparities between the country's different regions and socioeconomic classes, reducing corruption, and investing in the infrastructure necessary to ensure future growth.
In 2024, the World Economic Forum chief Børge Brende said that "there is a real opportunity for this country to become a $2-trillion economy."
The Philippines exhibits one of the highest economic densities in Southeast Asia, characterized by a high concentration of economic output relative to its land area. As of 2024–2025, the Philippines ranks third among ASEAN nations in GDP Density (Nominal GDP per square kilometer), trailing only the city-state of Singapore and the resource-rich sultanate of Brunei. | access-date = 2025-12-20 This is so, because there is such large economic activity that is happening on such low amount of land area that's scattered amongst a fragmented archipelagic geography. This is expressed in the concept called GDP Density. | access-date = 2025-12-20 | access-date = 2025-12-20
In 2025, the Philippines enacted Republic Act No. 12252, amending the Investors’ Lease Act to allow foreign investors to lease private land for up to 99 years, up from the previous limit of 75 years (50 + 25 extension). This reform aims to enhance the country's competitiveness in attracting long-term foreign direct investment by offering greater leasehold security for commercial and industrial projects. Also in 2025, a project called the "Luzon Economic Corridor" is on the works, which will further develop the Philippine economy. | access-date = 2025-12-20
Overview
The Philippine economy has been growing steadily over decades and the International Monetary Fund in 2014 reported it as the 39th largest economy in the world. The Philippines posted a high GDP growth rate of 7.6 percent in 2022. However, the country is not a part of the Group of 20 nations; instead, it is grouped in a second tier for emerging markets or newly industrialized countries.
Notes for economic growth (1980–2023):
1980-82: Slower economic growth due to mismanagement
1983-86: Recession due to factors like corruption
1987-90: Recovery from 1984 crisis
1991-1992: Inflation and natural disasters (notably Mount Pinatubo eruption) caused slower growth
1993-97: Fast growth
1998: Minor recession due to the 1997 Asian financial crisis
1999-2001: Recovery
2002: Recession due to the EDSA II Protest
1999-2001: Recovery
2002-2008: Post-EDSA II recovery
2009: Effects of the Great Recession
2010-2019: Philippines as a Tiger Economy
2021-2023: Rebound
A chart below outlines selected statistics showing trends in the gross domestic product of the Philippines using data taken from the International Monetary Fund.
| | |
| Year | GDP | GDP per capita | GDP | GDP | GDP per capita | GDP growth | PHP:USD | |||||||||||||||||||||||||||||||||||||||||||||||||||||||||
|---|---|---|---|---|---|---|---|---|---|---|---|---|---|---|---|---|---|---|---|---|---|---|---|---|---|---|---|---|---|---|---|---|---|---|---|---|---|---|---|---|---|---|---|---|---|---|---|---|---|---|---|---|---|---|---|---|---|---|---|---|---|---|---|---|
| exchange rate | 2025 | 2024 | 2023 | 2022 | 2021 | 2020 | 2019 | 2018 | 2017 | 2016 | 2015 | 2014 | 2013 | 2012 | 2011 | 2010 | 2009 | 2008 | 2007 | 2006 | 2005 | 2004 | 2003 | 2002 | 2001 | 2000 | 1999 | 1998 | 1997 | 1996 | 1995 | 1994 | 1993 | 1992 | 1991 | 1990 | 1989 | 1988 | 1987 | 1986 | 1985 | 1984 | 1983 | 1982 | 1981 | 1980 | 1979 | 1978 | 1977 | 1976 | 1975 | 1974 | 1973 | 1972 | 1971 | 1970 | ||||||||
| 1,479.4 | 12,934 | 28,502 | 497.5 | 4,349 | 5.50% | 58.805 | ||||||||||||||||||||||||||||||||||||||||||||||||||||||||||
| 1,391.8 | 12,191 | 26,546 | 471.5 | 4,130 | 5.70% | 58.014 | ||||||||||||||||||||||||||||||||||||||||||||||||||||||||||
| 1,278.6 | 11,326 | 24,276 | 436.6 | 3,720 | 5.60% | 55.567 | ||||||||||||||||||||||||||||||||||||||||||||||||||||||||||
| 1,173.1 | 10,512 | 22,023 | 404.3 | 3,623 | 7.76% | 56.120 | ||||||||||||||||||||||||||||||||||||||||||||||||||||||||||
| 994.6 | 9,043 | 19,390 | 393.7 | 3,579 | 5.60% | 50.774 | ||||||||||||||||||||||||||||||||||||||||||||||||||||||||||
| 919.2 | 8,389 | 17,937.6 | 361.5 | 3,298 | −9.50% | 48.036 | ||||||||||||||||||||||||||||||||||||||||||||||||||||||||||
| 1,005 | 9,295 | 19,514.4 | 376.8 | 3,485 | 6.00% | 50.744 | ||||||||||||||||||||||||||||||||||||||||||||||||||||||||||
| 930.0 | 8,720 | 18,262.4 | 346.8 | 3,251 | 6.30% | 52.724 | ||||||||||||||||||||||||||||||||||||||||||||||||||||||||||
| 854.0 | 8,120 | 15,556.4 | 328.5 | 3,123 | 6.70% | 49.923 | ||||||||||||||||||||||||||||||||||||||||||||||||||||||||||
| 798.6 | 7,703 | 15,133.5 | 318.6 | 3,073 | 6.90% | 49.813 | ||||||||||||||||||||||||||||||||||||||||||||||||||||||||||
| 741.0 | 6,547 | 13,307.3 | 292.4 | 2,863 | 5.80% | 47.166 | ||||||||||||||||||||||||||||||||||||||||||||||||||||||||||
| 642.8 | 6,924 | 12,645.3 | 284.8 | 2,844 | 6.10% | 44.617 | ||||||||||||||||||||||||||||||||||||||||||||||||||||||||||
| 454.3 | 4,660 | 11,546.1 | 272.2 | 2,792 | 7.20% | 44.414 | ||||||||||||||||||||||||||||||||||||||||||||||||||||||||||
| 419.6 | 4,380 | 10,564.9 | 250.2 | 2,611 | 6.80% | 41.192 | ||||||||||||||||||||||||||||||||||||||||||||||||||||||||||
| 386.1 | 4,098 | 9,706.3 | 224.1 | 2,379 | 3.60% | 43.928 | ||||||||||||||||||||||||||||||||||||||||||||||||||||||||||
| 365.3 | 3,945 | 9,003.5 | 199.6 | 2,155 | 7.63% | 43.885 | ||||||||||||||||||||||||||||||||||||||||||||||||||||||||||
| 335.4 | 3,685 | 8,026.1 | 168.5 | 1,851 | 1.15% | 46.356 | ||||||||||||||||||||||||||||||||||||||||||||||||||||||||||
| 329.0 | 3,636 | 7,720.9 | 173.6 | 1,919 | 4.15% | 47.485 | ||||||||||||||||||||||||||||||||||||||||||||||||||||||||||
| 309.9 | 3,493 | 6,892.7 | 149.4 | 1,684 | 7.12% | 41.401 | ||||||||||||||||||||||||||||||||||||||||||||||||||||||||||
| 283.5 | 3,255 | 6,271.2 | 122.2 | 1,405 | 5.24% | 49.132 | ||||||||||||||||||||||||||||||||||||||||||||||||||||||||||
| 261.0 | 3,061 | 5,677.8 | 103.1 | 1,209 | 4.78% | 53.067 | ||||||||||||||||||||||||||||||||||||||||||||||||||||||||||
| 242.7 | 2,905 | 5,120.4 | 91.4 | 1,093 | 6.70% | 56.267 | ||||||||||||||||||||||||||||||||||||||||||||||||||||||||||
| 222.7 | 2,720 | 4,548.1 | 83.9 | 1,025 | 4.97% | 55.569 | ||||||||||||||||||||||||||||||||||||||||||||||||||||||||||
| 207.8 | 2,591 | 4,198.3 | 81.4 | 1,014 | 3.65% | 53.096 | ||||||||||||||||||||||||||||||||||||||||||||||||||||||||||
| 197.3 | 2,511 | 3,888.8 | 76.3 | 971 | 2.89% | 51.404 | ||||||||||||||||||||||||||||||||||||||||||||||||||||||||||
| 187.5 | 2,437 | 3,580.7 | 81.0 | 1,053 | 4.41% | 49.998 | ||||||||||||||||||||||||||||||||||||||||||||||||||||||||||
| 175.8 | 2,352 | 3,244.2 | 83.0 | 1,110 | 3.08% | 40.313 | ||||||||||||||||||||||||||||||||||||||||||||||||||||||||||
| 168.1 | 2,297 | 2,952.8 | 73.8 | 1,009 | −0.58% | 39.059 | ||||||||||||||||||||||||||||||||||||||||||||||||||||||||||
| 167.1 | 2,336 | 2,688.7 | 92.8 | 1,297 | 5.19% | 39.975 | ||||||||||||||||||||||||||||||||||||||||||||||||||||||||||
| 156.1 | 2,232 | 2,406.4 | 93.5 | 1,336 | 5.85% | 26.288 | ||||||||||||||||||||||||||||||||||||||||||||||||||||||||||
| 144.8 | 2,118 | 2,111.7 | 83.7 | 1,224 | 4.68% | 26.214 | ||||||||||||||||||||||||||||||||||||||||||||||||||||||||||
| 135.5 | 2,007 | 1,875.7 | 71.0 | 1,052 | 4.39% | 24.418 | ||||||||||||||||||||||||||||||||||||||||||||||||||||||||||
| 127.1 | 1,929 | 1,633.6 | 60.2 | 914 | 2.12% | 27.699 | ||||||||||||||||||||||||||||||||||||||||||||||||||||||||||
| 121.8 | 1,891 | 1,497.5 | 58.7 | 912 | 0.34% | 25.096 | ||||||||||||||||||||||||||||||||||||||||||||||||||||||||||
| 118.6 | 1,882 | 1,379.9 | 50.2 | 797 | −0.49% | 26.650 | ||||||||||||||||||||||||||||||||||||||||||||||||||||||||||
| 115.2 | 1,873 | 1,190.5 | 48.9 | 796 | 3.04% | 28.000 | ||||||||||||||||||||||||||||||||||||||||||||||||||||||||||
| 107.6 | 1,791 | 1,025.3 | 47.3 | 786 | 6.21% | 22.440 | ||||||||||||||||||||||||||||||||||||||||||||||||||||||||||
| 97.6 | 1,663 | 885.5 | 42.0 | 715 | 6.75% | 21.335 | ||||||||||||||||||||||||||||||||||||||||||||||||||||||||||
| 88.4 | 1,540 | 756.5 | 36.8 | 641 | 4.31% | 20.800 | ||||||||||||||||||||||||||||||||||||||||||||||||||||||||||
| 82.4 | 1,471 | 674.6 | 33.1 | 591 | 3.42% | 20.530 | ||||||||||||||||||||||||||||||||||||||||||||||||||||||||||
| 77.9 | 1,426 | 633.6 | 34.1 | 623 | −7.30% | 19.032 | ||||||||||||||||||||||||||||||||||||||||||||||||||||||||||
| 81.6 | 1,530 | 581.1 | 34.8 | 652 | −7.31% | 19.760 | ||||||||||||||||||||||||||||||||||||||||||||||||||||||||||
| 84.9 | 1,630 | 408.9 | 36.8 | 707 | 1.88% | 14.002 | ||||||||||||||||||||||||||||||||||||||||||||||||||||||||||
| 80.1 | 1,578 | 351.4 | 41.1 | 810 | 3.62% | 9.171 | ||||||||||||||||||||||||||||||||||||||||||||||||||||||||||
| 72.9 | 1,471 | 312.0 | 39.5 | 797 | 3.42% | 8.200 | ||||||||||||||||||||||||||||||||||||||||||||||||||||||||||
| 64.4 | 1,334 | 270.1 | 35.9 | 744 | 5.15% | 7.600 | ||||||||||||||||||||||||||||||||||||||||||||||||||||||||||
| 5.60% | 7.415 | |||||||||||||||||||||||||||||||||||||||||||||||||||||||||||||||
| 5.20% | 7.375 | |||||||||||||||||||||||||||||||||||||||||||||||||||||||||||||||
| 5.60% | 7.370 | |||||||||||||||||||||||||||||||||||||||||||||||||||||||||||||||
| 8.00% | 7.428 | |||||||||||||||||||||||||||||||||||||||||||||||||||||||||||||||
| 6.40% | 7.498 | |||||||||||||||||||||||||||||||||||||||||||||||||||||||||||||||
| 5.00% | 7.065 | |||||||||||||||||||||||||||||||||||||||||||||||||||||||||||||||
| 9.20% | 6.730 | |||||||||||||||||||||||||||||||||||||||||||||||||||||||||||||||
| 4.80% | 6.781 | |||||||||||||||||||||||||||||||||||||||||||||||||||||||||||||||
| 4.90% | 6.435 | |||||||||||||||||||||||||||||||||||||||||||||||||||||||||||||||
| 4.60% | 6.435 | |||||||||||||||||||||||||||||||||||||||||||||||||||||||||||||||
| {{notelist | refs= |
Composition by sector
As a newly industrialized country, the Philippines is still an economy with a large agricultural sector; however, the country's service industry has expanded recently. Much of the industrial sector is based on processing and assembly operations in the manufacturing of electronics and other high-tech components, usually from foreign multinational corporations.
Filipinos who go abroad to work–-known as Overseas Filipino Workers or OFWs—are a significant contributor to the economy but are not reflected in the below sectoral discussion of the domestic economy. OFW remittances is also credited for the Philippines' recent economic growth resulting in investment status upgrades from credit ratings agencies such as the Fitch Group and Standard & Poor's. From more than US$2 billion worth of remittance from Overseas Filipinos sent to the Philippines in 1994, this significantly increased to a record US$38.34 billion in 2024 and represented 8.3 percent of the country's GDP.
Agriculture
, agriculture employs 24 percent of the Filipino workforce accounting for 8.9 percent of the total GDP. The type of activity ranges from small subsistence farming and fishing to large commercial ventures with significant export focus.
The Philippines is the world's third largest producer of coconuts, and the world's largest exporter of coconut products. Coconut production is generally concentrated in medium-sized farms. The Philippines is also the world's third largest producer of pineapples, producing 2862000 MT in 2021.
Rice production in the Philippines is important to the food supply in the country and economy. The Philippines is the 8th largest rice producer in the world , accounting for 2.5 percent of global rice production. Rice is the most important food crop, a staple food in most of the country; it is produced extensively in Central Luzon), Western Visayas, Cagayan Valley, Soccsksargen, and Ilocos Region.
The Philippines is one of the largest producers of sugar in the world. At least 17 provinces located in eight regions of the nation have grown sugarcane crops, of which the Negros Island Region accounts for half of the country's total production. As of Crop Year 2012–2013, 29 mills are operational divided as follows: 13 mills in Negros, 6 mills in Luzon, 4 mills in Panay, 3 mills in Eastern Visayas and 3 mills in Mindanao. A range from 360000 to are devoted to sugarcane production. The largest sugarcane areas are found in the Negros Island Region, which accounts for 51 percent of sugarcane areas planted. This is followed by Mindanao which accounts for 20 percent; Luzon with 17 percent; Panay with 7 percent and Eastern Visayas with 4 percent.
File:Sitio Bobonao, Dapitan street.jpg|A coconut grove in Dapitan File:Banana Plantation, Padada.JPG|A banana plantation in Padada File:Sugarcane plantations Bacolod Philippines.jpg|Vast sugarcane plantations in Bacolod File:JfHallSchool9156SPutikSanIldefonsoBulfvf 05.JPG|A rice field in Bulacan File:CalauanLagunajf4387 06.JPG|Pineapples in a market in Laguna
Automotive and aerospace
Main article: Automotive industry in the Philippines
The ABS used in Mercedes-Benz, BMW, and Volvo cars are made in the Philippines. Automotive sales in the Philippines increased to 467,252 in 2024 from 429,807 units a year prior. Toyota sells the most vehicles in the country followed by Mitsubishi, Ford, Nissan, and Suzuki. Honda and Suzuki produce motorcycles in the country. Since around the 2010s, several Chinese car brands have entered the Philippine market; these include Chery and Foton Motor.
Aerospace products in the Philippines are mainly for the export market and include manufacturing parts for aircraft built by both Boeing and Airbus. Moog is the biggest aerospace manufacturer with base in Baguio; the company produces aircraft actuators in their manufacturing facility. Total export output of aerospace products in the Philippines reached US$780 million in 2019.
Electronics

A Texas Instruments plant in Baguio has been operating for 20 years and is the largest producer of DSP chips in the world. Texas Instruments' Baguio plant produces all the chips used in Nokia cell phones and 80% of chips used in Ericsson cell phones in the world. Toshiba hard disk drives are manufactured in Santa Rosa, Laguna. Printer manufacturer Lexmark has a factory in Cebu City. Electronics and other light industries are concentrated in Laguna, Cavite, Batangas and other Calabarzon provinces with sizable numbers found in Southern Philippines that account for most of the country's export.
The Philippine Electronics Industry is classified into (73%) Semiconductor Manufacturing Services (SMS) and (27%) Electronics Manufacturing Services (EMS) according to SEIPI, the largest organization of foreign and Filipino electronics companies in the Philippines. Electronic products continued to be the country's top export with total earnings of US$45.66 billion and accounted for 57.8 percent of the total export of goods in 2022.
Semiconductor Industry
The semiconductor industry plays a critical role in the Philippine economy by integrating the Philippines into the global electronics value chain. The country is primarily involved in the assembly, testing, and packaging stages of semiconductor production rather than chip design or wafer fabrication, serving as a key link in the global supply chain for electronic components.
According to the Semiconductor and Electronics Industries in the Philippines Foundation (SEIPI), semiconductor manufacturing services account for the majority of the country’s electronics industry output. Semiconductor products are widely used in consumer electronics, telecommunications equipment, automotive systems, and industrial applications.
Semiconductor manufacturing facilities in the Philippines are largely operated by multinational firms and are concentrated in major industrial zones, particularly in the CALABARZON region as well as parts of Central Luzon and the Visayas. The industry benefits from a skilled technical workforce, competitive production costs, and government investment incentives.
As part of the broader electronics sector, semiconductors contribute significantly to export earnings, employment generation, and foreign direct investment. The industry also supports technology transfer and skills development, reinforcing its role as one of the Philippines’ most important high-technology manufacturing sectors.
Mining and extraction

The Philippines is rich in mineral and geothermal energy resources. In 2019, it produced 1928 MW of electricity from geothermal sources (% of total electricity production). A 1989 discovery of natural gas reserves in the Malampaya oil fields off the island of Palawan is being used to generate electricity in three gas-powered plants. Philippine gold, nickel, copper, palladium and chromite deposits are among the largest in the world. Other important minerals include silver, coal, gypsum, and sulphur. Significant deposits of clay, limestone, marble, silica, and phosphate exist.
About 60 percent of total mining production are accounted for by non-metallic minerals, which contributed substantially to the industry's steady output growth between 1993 and 1998, with the value of production growing 58 percent. Philippine mineral exports amounted to US$4.22 billion in 2020. Low metal prices, high production costs, lack of investment in infrastructure, and a challenge to the new mining law have contributed to the mining industry's overall decline.
The industry rebounded starting in late 2004 when the Supreme Court upheld the constitutionality of an important law permitting foreign ownership of Philippines mining companies. In 2019, the country was the 2nd largest world producer of nickel and the 4th largest world producer of cobalt. According to Philippine Statistics Authority, the total monetary value of four key metallic minerals which were appraised to Class A namely: copper, chromite, gold and nickel were valued at US$9.01 billion in 2022. Class A mineral resources are commercially recoverable that could contribute to economy annually.
Offshoring and outsourcing
Main article: Business process outsourcing in the Philippines, Call center industry in the Philippines

Business process outsourcing (BPO) and the call center industry contribute to the Philippines' economic growth resulting in investment status upgrades from credit ratings agencies such as Fitch and S&P. In 2008, the Philippines has surpassed India as the world leader in business process outsourcing (BPO). The industry generated 100,000 jobs, and total revenues were placed at US$960 million for 2005. In 2011, BPO sector employment ballooned to over 700,000 people and is contributing to a growing middle class; this increased to around 1.3 million employees by 2022. BPO facilities are concentrated in IT parks and centers in economic zones across the Philippines: Metro Manila, Metro Cebu, Metro Clark, Bacolod, Davao City, and Iloilo City; other areas with significant presence of the BPO industry include Baguio, Cagayan de Oro, Dasmariñas, Dumaguete, Lipa, Naga, and Santa Rosa, Laguna. The majority of the top ten BPO firms of the United States operate in the Philippines.
Call centers began in the Philippines as plain providers of email response and managing services and is a major source of employment. Call center services include customer relations, ranging from travel services, technical support, education, customer care, financial services, online business to customer support, and online business-to-business support. The Philippines is considered as a location of choice due to its many outsourcing benefits such as less expensive operational and labor costs, the high proficiency in spoken English of a significant number of its people, and a highly educated labor pool.
The growth in the BPO industry is promoted by the Philippine government. The industry is highlighted by the Philippines Development Plan as among the 10 high potential and priority development areas. The government provides incentive programs such as tax holidays, tax exemptions, and simplified export and import procedures. Additionally, training is also available for BPO applicants.
In addition to economic contributions, some Philippine call center companies have implemented programs aimed at promoting employee welfare, including wellness initiatives, incentive schemes, and career development support for staff. For example, certain firms have established employee assistance programs, flexible work arrangements, and internal recognition systems to improve workplace morale and retention. This reflects broader efforts within the BPO sector to enhance working conditions and support for employees.
Renewable energy resources
Main article: Renewable energy in the Philippines
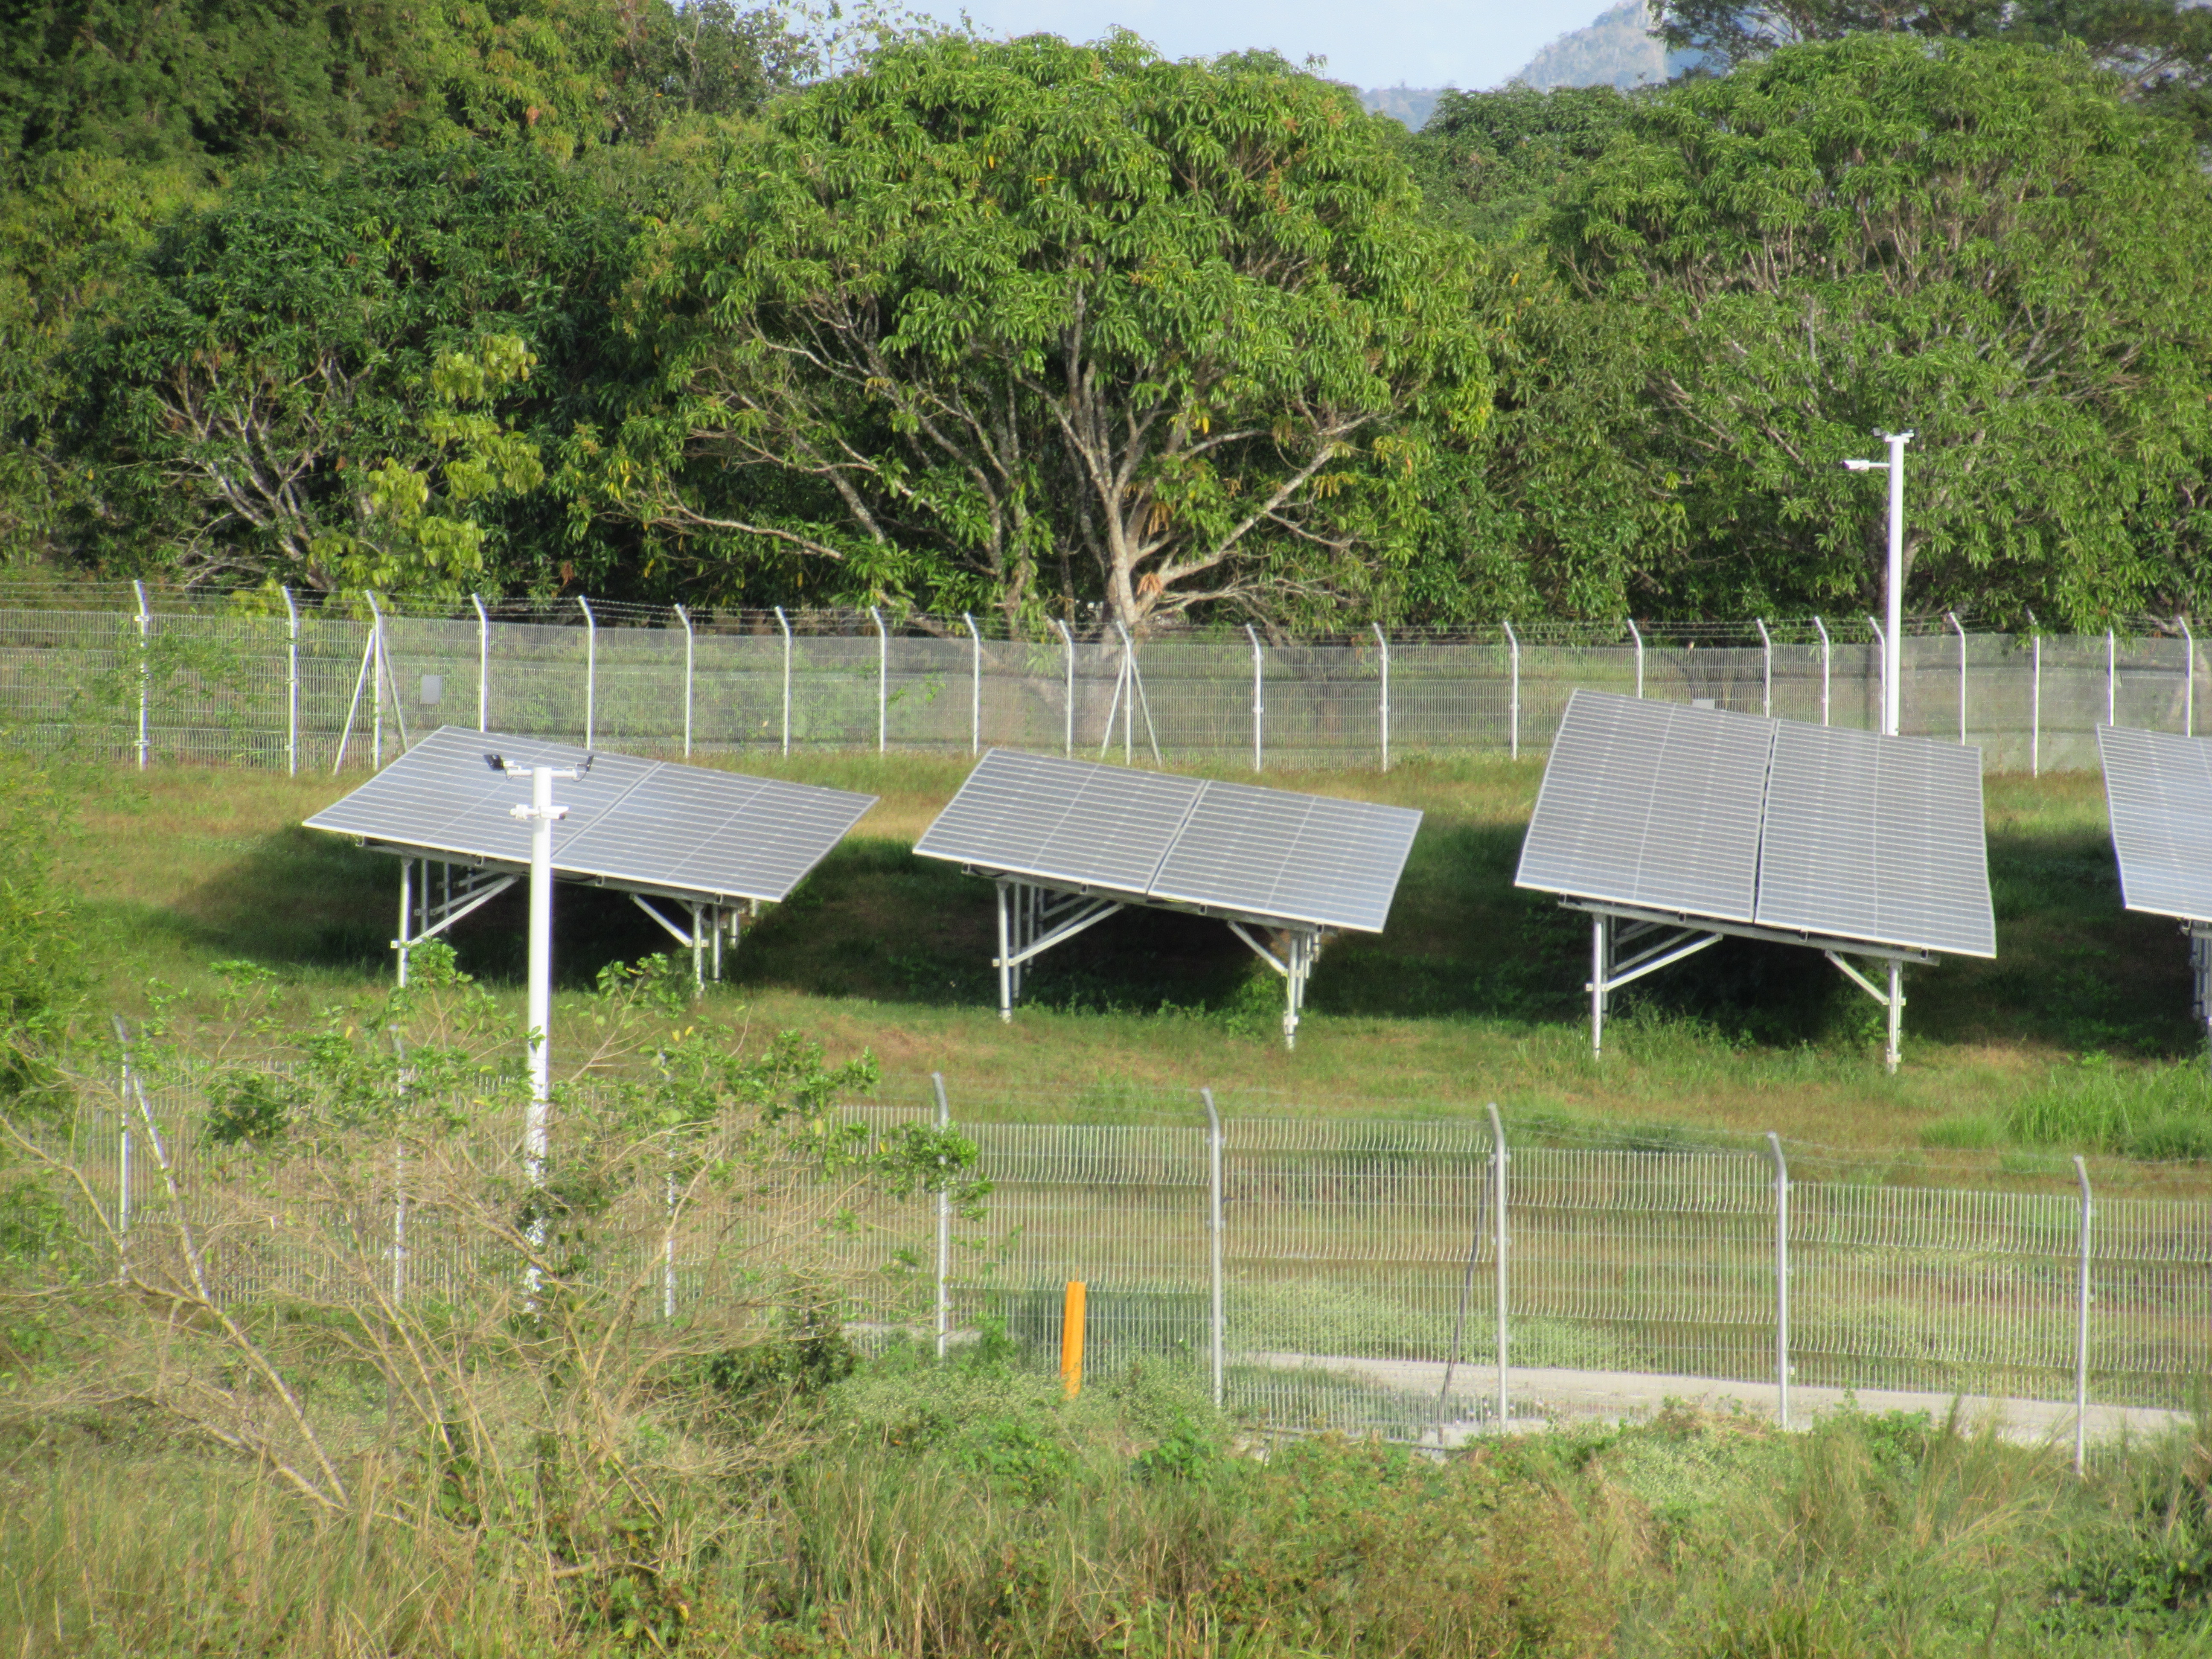
The Philippines has significant potential in solar energy; however, , most of the domestically produced electricity is based on fossil fuel resources, particularly coal. The country produced 7399 MW of renewable energy in 2019.
On November 15, 2022, the renewable energy sector was granted the ability to operate with 100 percent foreign ownership, an increase from the previous 40 percent limit. This change allows for the infusion of foreign capital into the renewable energy (RE) industries. The Department of Energy is targeting an increase in the share of renewable energy in the country's power generation mix, aiming for 35 percent by 2030 and 50 percent by 2040, up from the current 22 percent. Danish firm Copenhagen Infrastructure Partners (CIP) is investing US$5 billion to develop three offshore wind energy projects with a potential capacity of 2000 MW; it will be located in Camarines Norte and Camarines Sur (1000 MW), Northern Samar (650 MW), Pangasinan and La Union (350 MW). In 2022, the share of RE in the energy mix was at 22.8 percent.
Shipbuilding and repair
The Philippines is a significant player in the global shipbuilding industry with 118 registered shipyards in 2021 distributed in Subic, Cebu, Bataan, Navotas and Batangas. As of 2022, it is the seventh largest shipbuilding nation by gross tonnage. Subic-made cargo vessels are exported to countries where shipping operators are based. South Korea's Hanjin started production in Subic in 2007 of the 20 ships ordered by German and Greek shipping operators. Bulk carriers, container ships and big passenger ferries are built in the country's shipyards. General Santos' shipyard is mainly for ship repair and maintenance.
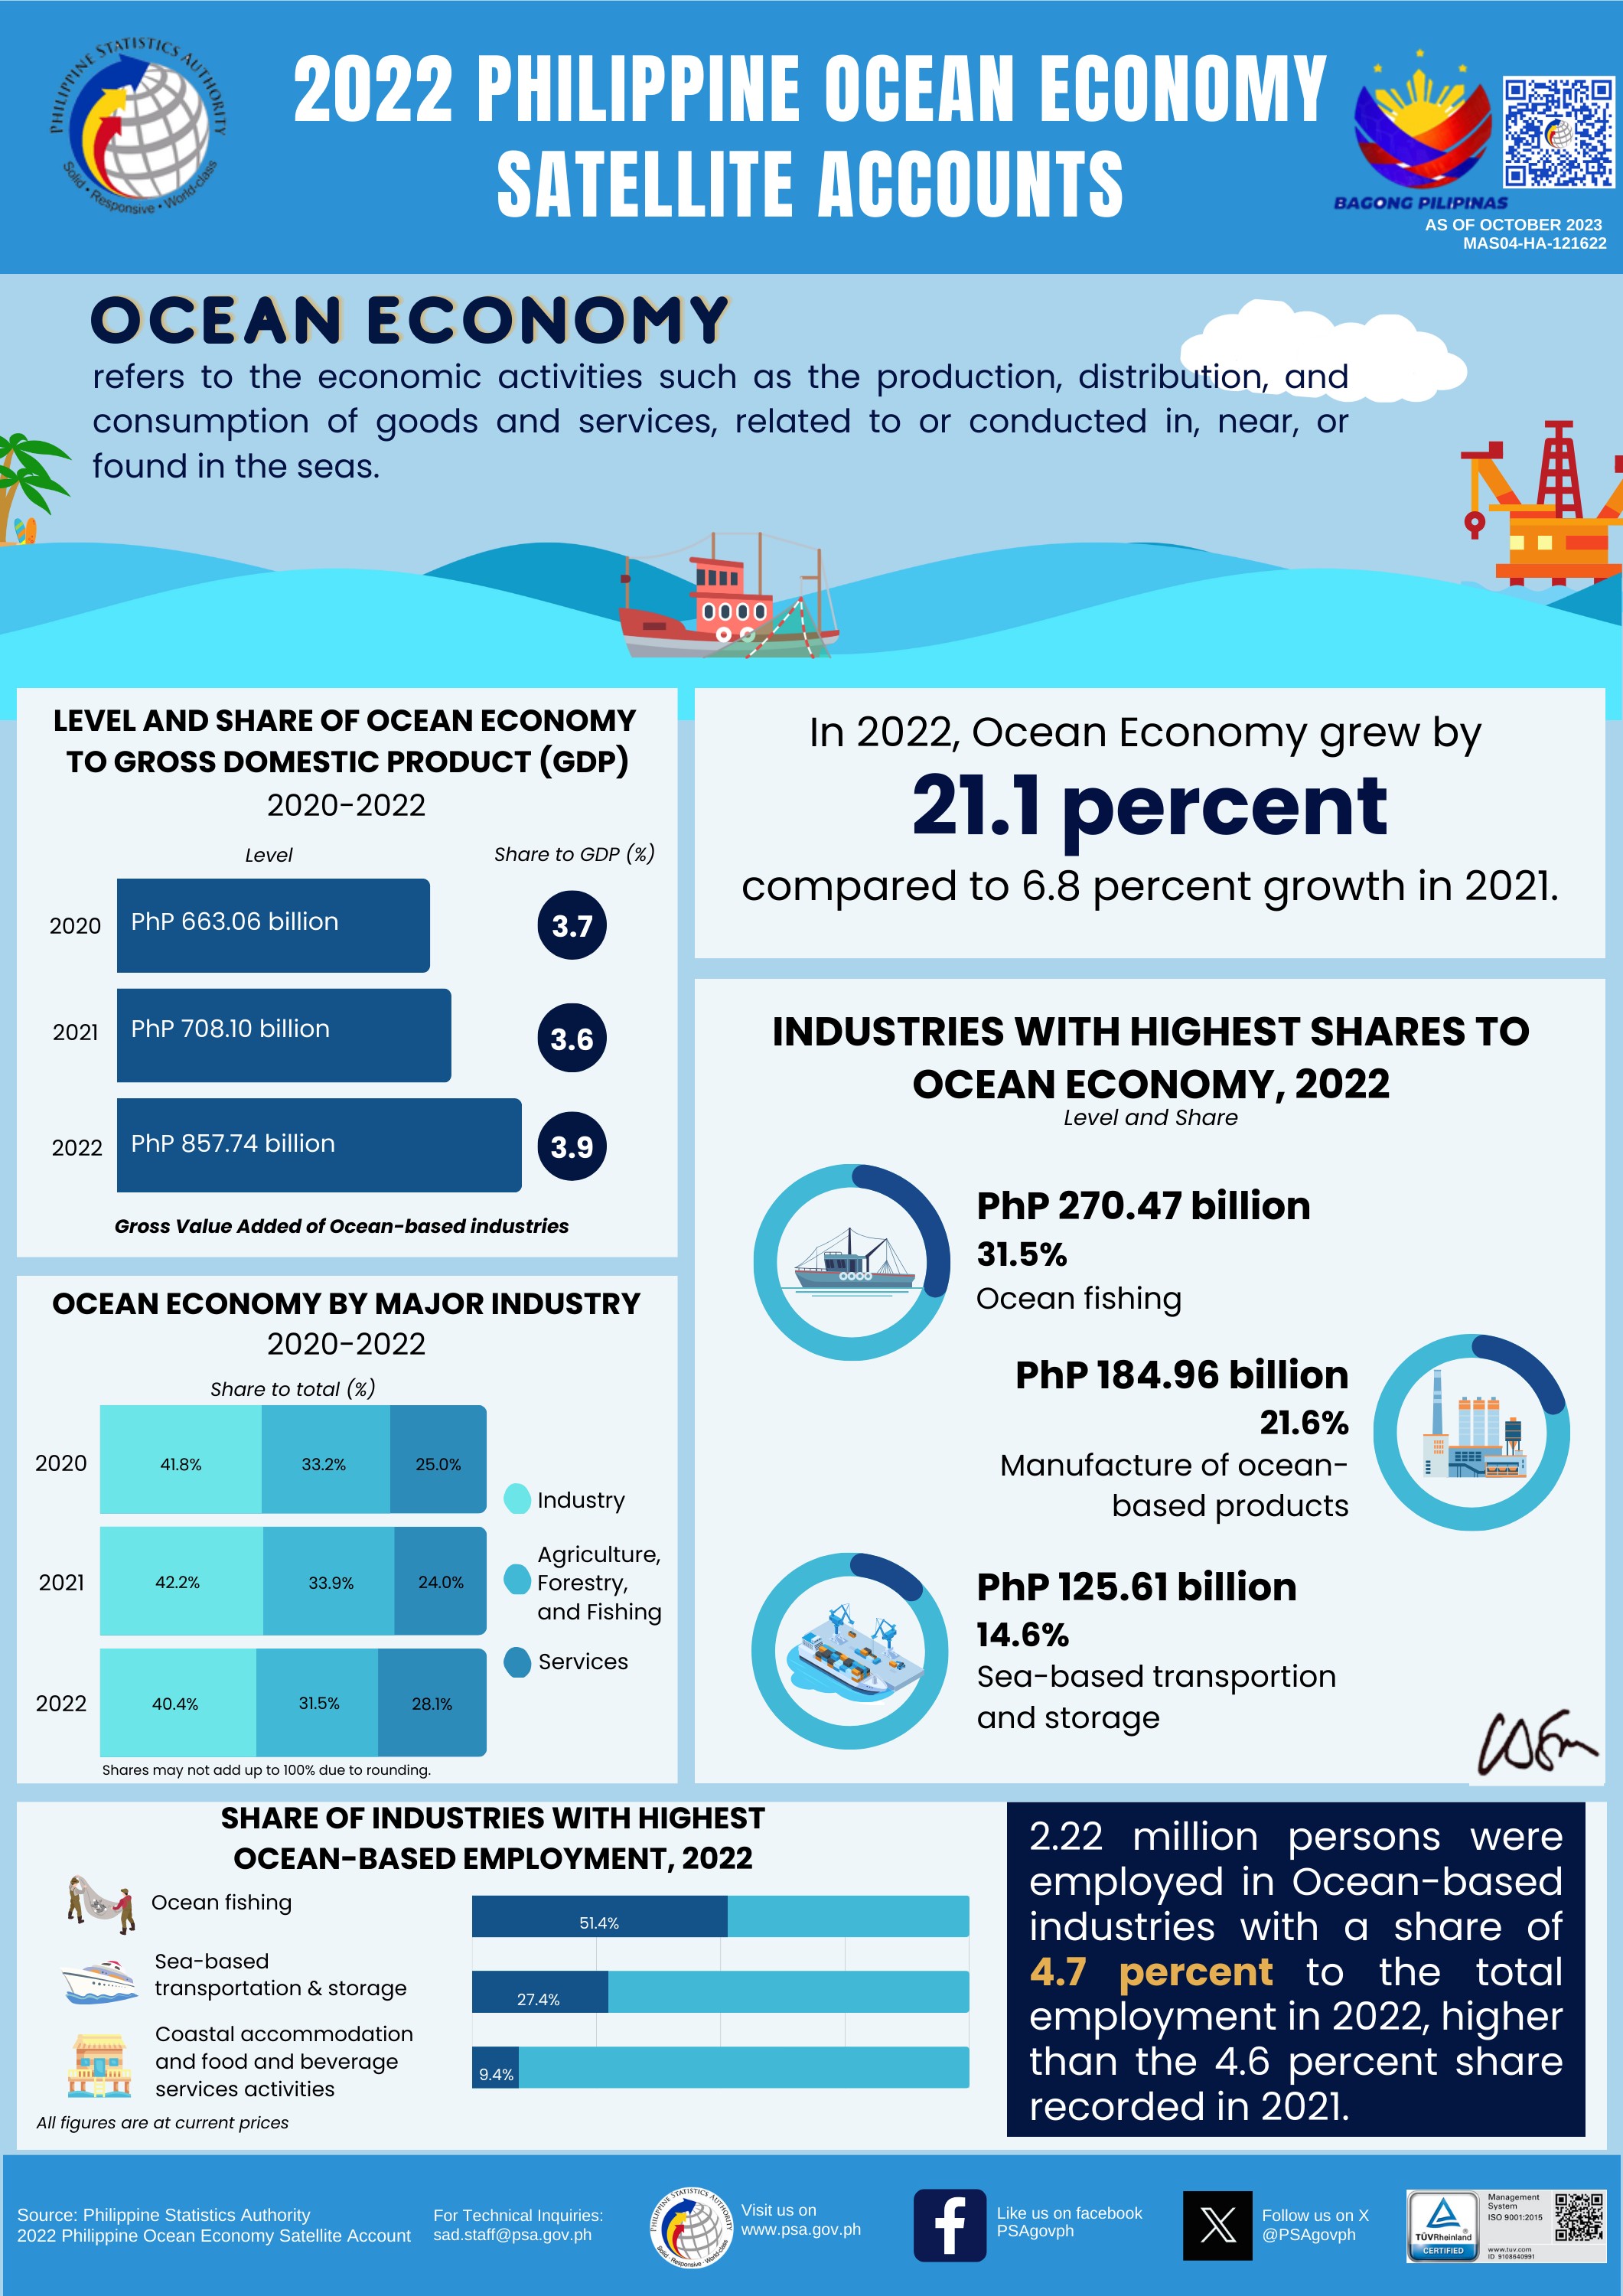
Surrounded by waters, the country has abundant natural deep-sea ports ideal for development as production, construction and repair sites. In the ship repair sector, the Navotas complex in Metro Manila is expected to accommodate 96 vessels for repair. Shipbuilding is part of Philippines' maritime heritage; employing over 600,000 people and contributing almost 15 percent of revenues to the ocean-based industries.
Tourism
Regional accounts
For the year 2022, all economies of the 17 regions in the Philippines recorded positive growths; Western Visayas had the highest growth (9.3 percent), followed by Cordillera Administrative Region (8.7 percent), and Davao Region (8.15 percent).
According to the Philippine Statistics Authority (PSA), gross regional domestic product (GRDP) is GDP measured at regional levels. Figures below are for the year 2019.
| Region | GRDP | Agriculture | Industry | Services | GRDP | ||||||||||||||||||||||||||
|---|---|---|---|---|---|---|---|---|---|---|---|---|---|---|---|---|---|---|---|---|---|---|---|---|---|---|---|---|---|---|---|
| per capita | # | % | # | % | # | % | # | % | Metro Manila | Cordillera | Ilocos Region | Cagayan Valley | Central Luzon | Calabarzon | Mimaropa | Bicol Region | Western Visayas | Central Visayas | Eastern Visayas | Zamboanga Peninsula | Northern Mindanao | Davao Region | Soccsksargen | Caraga | Bangsamoro | Total | |||||
| Data as of October 21, 2020 |
Provincial accounts
According to the Philippine Statistics Authority (PSA), Provincial Product Account (PPA) is GDP measured at provincial levels. Figures below are for the year 2022.
| # | Province | Region | 2022 PPA GDP | 2020 | PPA GDP |
|---|---|---|---|---|---|
| 1 | Metro Manila | Metro Manila | 6,265,608,000,000 | 13,484,462 | 464,654 |
| 2 | Laguna | Calabarzon | 990,690,000,000 | 3,382,193 | 292,914 |
| 3 | Cebu (incl. Cebu City, Lapu-Lapu City & Mandaue) | Central Visayas | 937,750,000,000 | 5,151,274 | 182,042 |
| 4 | Cavite | Calabarzon | 731,390,000,000 | 4,344,829 | 168,336 |
| 5 | Pampanga (incl. Angeles City) | Central Luzon | 658,070,000,000 | 2,900,637 | 226,871 |
| 6 | Batangas | Calabarzon | 615,810,000,000 | 2,908,494 | 211,728 |
| 7 | Bulacan | Central Luzon | 604,710,000,000 | 3,708,890 | 163,043 |
| 8 | Davao del Sur (incl. Davao City) | Davao Region | 599,000,000,000 | 2,457,430 | 243,751 |
| 9 | Misamis Oriental (incl. Cagayan de Oro) | Northern Mindanao | 419,220,000,000 | 1,685,302 | 248,751 |
| 10 | Negros Occidental (incl. Bacolod) | Western Visayas | 379,200,000,000 | 3,223,955 | 117,620 |
| 11 | Pangasinan | Ilocos Region | 352,930,000,000 | 3,163,190 | 111,574 |
| 12 | Iloilo (incl. Iloilo City) | Western Visayas | 351,050,000,000 | 2,509,525 | 139,887 |
| 13 | Rizal | Calabarzon | 340,630,000,000 | 3,330,143 | 102,287 |
| 14 | Nueva Ecija | Central Luzon | 298,570,000,000 | 2,310,134 | 129,244 |
| 15 | Leyte (incl. Tacloban) | Eastern Visayas | 296,950,000,000 | 2,028,728 | 146,373 |
| 16 | Quezon (incl. Lucena) | Calabarzon | 264,460,000,000 | 2,229,383 | 118,625 |
| 17 | South Cotabato (incl. General Santos) | Soccsksargen | 263,830,000,000 | 1,672,791 | 157,718 |
| 18 | Bataan | Central Luzon | 256,890,000,000 | 853,373 | 301,029 |
| 19 | Bukidnon | Northern Mindanao | 248,750,000,000 | 1,541,308 | 161,389 |
| 20 | Zamboanga del Sur (incl. Zamboanga City) | Zamboanga Peninsula | 241,000,000,000 | 2,027,902 | 118,842 |
| 21 | Benguet (incl. Baguio) | Cordillera | 233,810,000,000 | 827,041 | 282,707 |
| 22 | Camarines Sur | Bicol Region | 194,840,000,000 | 2,068,244 | 94,206 |
| 23 | Tarlac | Central Luzon | 193,290,000,000 | 1,503,456 | 128,564 |
| 24 | Isabela | Cagayan Valley | 188,890,000,000 | 1,697,050 | 111,305 |
| 25 | Palawan (incl. Puerto Princesa) | Mimaropa | 180,320,000,000 | 1,246,673 | 144,641 |
| 26 | Bohol | Central Visayas | 171,090,000,000 | 1,394,329 | 122,704 |
| 27 | Davao del Norte | Davao Region | 168,610,000,000 | 1,125,057 | 149,868 |
| 28 | Negros Oriental | Central Visayas | 166,460,000,000 | 1,432,990 | 116,163 |
| 29 | Cagayan | Cagayan Valley | 148,780,000,000 | 1,268,603 | 117,279 |
| 30 | Albay | Bicol Region | 145,130,000,000 | 1,374,768 | 105,567 |
| 31 | Zambales (incl.Olongapo) | Central Luzon | 140,630,000,000 | 909,932 | 154,550 |
| 32 | Lanao del Norte (incl. Iligan) | Northern Mindanao | 136,850,000,000 | 1,086,017 | 126,011 |
| 33 | Cotabato | Soccsksargen | 120,350,000,000 | 1,490,618 | 80,738 |
| 34 | Misamis Occidental | Northern Mindanao | 119,380,000,000 | 617,333 | 193,380 |
| 35 | La Union | Ilocos Region | 118,600,000,000 | 822,352 | 144,220 |
| 36 | Zamboanga del Norte | Zamboanga Peninsula | 114,620,000,000 | 1,047,455 | 109,427 |
| 37 | Oriental Mindoro | Mimaropa | 109,400,000,000 | 908,339 | 120,440 |
| 38 | Agusan del Norte (incl. Butuan) | Caraga | 96,070,000,000 | 760,413 | 126,339 |
| 39 | Ilocos Norte | Ilocos Region | 93,100,000,000 | 609,588 | 152,726 |
| 40 | Davao de Oro | Davao Region | 93,100,000,000 | 767,547 | 121,296 |
| 41 | Ilocos Sur | Ilocos Region | 90,240,000,000 | 706,009 | 127,817 |
| 42 | Masbate | Bicol Region | 80,180,000,000 | 908,920 | 88,215 |
| 43 | Surigao del Norte | Caraga | 78,380,000,000 | 534,636 | 146,604 |
| 44 | Maguindanao del Norte | Bangsamoro | 78,010,000,000 | 943,500 | 82,682 |
| 45 | Sorsogon | Bicol Region | 74,560,000,000 | 828,655 | 89,977 |
| 46 | Capiz | Western Visayas | 74,380,000,000 | 804,952 | 92,403 |
| 47 | Agusan del Sur | Caraga | 74,220,000,000 | 739,367 | 100,383 |
| 48 | Lanao del Sur | Bangsamoro | 71,790,000,000 | 1,195,518 | 60,049 |
| 49 | Sultan Kudarat | Soccsksargen | 71,510,000,000 | 854,052 | 83,730 |
| 50 | Antique | Western Visayas | 70,690,000,000 | 612,974 | 115,323 |
| 51 | Aklan | Western Visayas | 63,570,000,000 | 615,475 | 103,286 |
| 52 | Surigao del Sur | Caraga | 63,190,000,000 | 642,255 | 98,388 |
| 53 | Zamboanga Sibugay | Zamboanga Peninsula | 60,390,000,000 | 669,840 | 90,156 |
| 54 | Camarines Norte | Bicol Region | 60,200,000,000 | 629,699 | 95,601 |
| 55 | Samar | Eastern Visayas | 57,860,000,000 | 793,183 | 72,947 |
| 56 | Nueva Vizcaya | Cagayan Valley | 57,790,000,000 | 497,432 | 116,177 |
| 57 | Davao Oriental | Davao Region | 55,450,000,000 | 576,343 | 96,210 |
| 58 | Occidental Mindoro | Mimaropa | 52,560,000,000 | 525,354 | 100,047 |
| 59 | Sarangani | Soccsksargen | 47,960,000,000 | 558,946 | 85,804 |
| 60 | Sulu | Bangsamoro | 44,970,000,000 | 1,000,108 | 44,965 |
| 61 | Northern Samar | Eastern Visayas | 44,340,000,000 | 639,186 | 69,369 |
| 62 | Southern Leyte | Eastern Visayas | 43,010,000,000 | 429,573 | 100,123 |
| 63 | Maguindanao del Sur | Bangsamoro | 38,230,000,000 | 723,758 | 52,822 |
| 64 | Davao Occidental | Davao Region | 37,900,000,000 | 317,159 | 119,498 |
| 65 | Basilan (incl. Isabela) | Bangsamoro | 34,240,000,000 | 556,586 | 61,518 |
| 66 | Eastern Samar | Eastern Visayas | 33,990,000,000 | 477,168 | 71,233 |
| 67 | Aurora | Central Luzon | 33,990,000,000 | 235,750 | 139,597 |
| 68 | Romblon | Mimaropa | 29,030,000,000 | 308,985 | 93,953 |
| 69 | Catanduanes | Bicol Region | 28,800,000,000 | 271,879 | 105,929 |
| 70 | Kalinga | Cordillera | 27,130,000,000 | 229,570 | 118,177 |
| 71 | Ifugao | Cordillera | 25,770,000,000 | 207,498 | 124,194 |
| 72 | Tawi-Tawi | Bangsamoro | 24,780,000,000 | 440,276 | 56,283 |
| 73 | Abra | Cordillera | 24,570,000,000 | 250,985 | 97,894 |
| 74 | Marinduque | Mimaropa | 21,650,000,000 | 239,207 | 90,507 |
| 75 | Quirino | Cagayan Valley | 21,140,000,000 | 203,828 | 103,715 |
| 76 | Biliran | Eastern Visayas | 16,190,000,000 | 179,312 | 90,290 |
| 77 | Guimaras | Western Visayas | 16,130,000,000 | 187,842 | 85,870 |
| 78 | Mountain Province | Cordillera | 14,890,000,000 | 158,200 | 94,121 |
| 79 | Siquijor | Central Visayas | 12,020,000,000 | 103,395 | 116,253 |
| 80 | Dinagat Islands | Caraga | 12,000,000,000 | 128,117 | 93,664 |
| 81 | Apayao | Cordillera | 11,500,000,000 | 124,366 | 92,469 |
| 82 | Camiguin | Northern Mindanao | 11,100,000,000 | 92,808 | 119,602 |
| 83 | Batanes | Cagayan Valley | 4,570,000,000 | 18,831 | 242,685 |
Source: Philippine Statistics Authority
City accounts
Figures below are Provincial Product Accounts (PPA) for Highly Urbanized Cities (HUC) or Independent Cities. No data available for cities within Metro Manila.
| # | City | Province | Region | Island | 2022 PPA GDP | 2020 | PPA GDP |
|---|---|---|---|---|---|---|---|
| 1 | Davao City | Davao del Sur | Davao Region | Mindanao | 495,310,000,000 | 1,776,949 | 278,742 |
| 2 | Cebu City | Cebu | Central Visayas | Visayas | 288,640,000,000 | 964169 | 299,367 |
| 3 | Cagayan de Oro | Misamis Oriental | Northern Mindanao | Mindanao | 261,780,000,000 | 728402 | 359,389 |
| 4 | Baguio | Benguet | Cordillera | Luzon | 155,030,000,000 | 366,358 | 423,165 |
| 5 | Lapu-Lapu | Cebu | Central Visayas | Visayas | 151,420,000,000 | 497,604 | 304,298 |
| 6 | Iloilo City | Iloilo | Western Visayas | Visayas | 145,050,000,000 | 457,626 | 316,962 |
| 7 | Zamboanga City | Zamboanga del Sur | Zamboanga Peninsula | Mindanao | 139,470,000,000 | 977,234 | 142,719 |
| 8 | Bacolod | Negros Occidental | Western Visayas | Visayas | 132,810,000,000 | 600,783 | 221,062 |
| 9 | Angeles | Pampanga | Central Luzon | Luzon | 132,420,000,000 | 462,928 | 286,049 |
| 10 | General Santos | South Cotabato | Soccsksargen | Mindanao | 129,020,000,000 | 697,315 | 185,024 |
| 11 | Mandaue | Cebu | Central Visayas | Visayas | 109,580,000,000 | 364,116 | 300,948 |
| 12 | Iligan | Lanao del Norte | Northern Mindanao | Mindanao | 77,020,000,000 | 363,115 | 212,109 |
| 13 | Butuan | Agusan del Norte | Caraga | Mindanao | 57,370,000,000 | 372,910 | 153,844 |
| 14 | Puerto Princesa | Palawan | Mimaropa | Luzon | 53,080,000,000 | 307,079 | 172,855 |
| 15 | Olongapo | Zambales | Central Luzon | Luzon | 52,260,000,000 | 260,317 | 200,755 |
| 16 | Tacloban | Leyte | Eastern Visayas | Visayas | 51,530,000,000 | 251,881 | 204,581 |
| 17 | Lucena | Quezon | Calabarzon | Luzon | 46,620,000,000 | 278,924 | 167,142 |
| 18 | Isabela | Basilan | Bangsamoro | Mindanao | 11,760,000,000 | 130,379 | 90,199 |
source: Philippine Statistics Authority
International comparisons
| Organization | Report | As of | Change from previous | Ranking | ||
|---|---|---|---|---|---|---|
| Fraser Institute | Economic Freedom of the World | 2021 | 3 | url=https://web.archive.org/web/20240228100542/https://www.fraserinstitute.org/resource-file?nid=15523&fid=20810 | date=February 28, 2024 }} Fraser Institute | Retrieved February 28, 2024. |
| International Monetary Fund | GDP (PPP) | 2023 | 29th | |||
| International Monetary Fund | GDP (nominal) | 2023 | 5 | 34th | ||
| International Monetary Fund | GDP per capita (PPP) | 2023 | 3 | 116th | ||
| International Monetary Fund | GDP per capita (nominal) | 2023 | 4 | 124th | ||
| International Monetary Fund | Foreign exchange reserves | 2023 | 28th | |||
| The Heritage Foundation/*The Wall Street Journal* | Index of Economic Freedom | 2016 | 13 | 76 out of 178 | ||
| The World Factbook | External debt | 2023 | 3 | 35th | ||
| United Nations | Human Development Index | 2021 | 116 out of 191 | |||
| World Economic Forum | Global Competitiveness | 2019 | 8 | 64 out of 141 | ||
| World Economic Forum | Global Enabling Trade Report | 2014 | 8 | 64 out of 138 | ||
| World Economic Forum | Financial Development Index | 2012 | 5 | 49 out of 60 | ||
| World Bank | Ease of doing business index | 2014 | 13 | 95 out of 183 |
Statistics
| **2024** | **2023** | **2022** | **2021** | **2020** | **2019** | **2018** | **2017** | Social Indicators | External Sectors | Public Finances | *Sources: Bangko Sentral ng Pilipinas* and UNCTAD | |||||||||
|---|---|---|---|---|---|---|---|---|---|---|---|---|---|---|---|---|---|---|---|---|
| **Population** | ||||||||||||||||||||
| *(in million)* | ||||||||||||||||||||
| 112.19 | 111.9 | 110.9 | 110.1 | |||||||||||||||||
| **Poverty** *(%)* | - | 15.5 | - | 18.1 | ||||||||||||||||
| **Labor Force** | ||||||||||||||||||||
| *(in million)* | ||||||||||||||||||||
| 51.81 | 51.2 | 49.0 | 47.7 | |||||||||||||||||
| **Unemployment** *(%)* | 3.8 | 4.4 | 5.4 | 7.8 | ||||||||||||||||
| **Wage Rates** | ||||||||||||||||||||
| *(Nominal ₱: end-of-period)* | ||||||||||||||||||||
| 645.00 | 610.00 | 570.00 | 537.00 | |||||||||||||||||
| **Inflation Rate** | ||||||||||||||||||||
| *(Constant 2018 prices; %)* | ||||||||||||||||||||
| 3.2 | 6.0 | 5.8 | 3.9 | |||||||||||||||||
| **Trade Balance** | ||||||||||||||||||||
| *(US$ million)* | ||||||||||||||||||||
| -68,744 | -66,306 | -69,701 | -52,806 | |||||||||||||||||
| **Export of Goods** | ||||||||||||||||||||
| *(US$ million)* | ||||||||||||||||||||
| 55,012 | 55,257 | 57,710 | 54,228 | |||||||||||||||||
| **Import of Goods** | ||||||||||||||||||||
| *(US$ million)* | ||||||||||||||||||||
| 125,394 | 121,292 | 127,412 | 107,034 | |||||||||||||||||
| **Current Account** | ||||||||||||||||||||
| *(US$ million; % of GDP)* | ||||||||||||||||||||
| -17,512 (-3.8) | -12,387 (-2.8) | -18,261 (-4.5) | -5,943 (-1.5) | |||||||||||||||||
| **External Debt** | ||||||||||||||||||||
| *(US$ million; % of GDP)* | ||||||||||||||||||||
| 137,628 (29.8) | 125,394 (28.7) | 111,268 (27.5) | 106,428 (27.0) | |||||||||||||||||
| **Personal Remittances** | ||||||||||||||||||||
| *(US$ million)* | ||||||||||||||||||||
| 38,341 | 37,210 | 36,136 | 34,884 | |||||||||||||||||
| **Foreign Reserves** | ||||||||||||||||||||
| *(US$ million)* | ||||||||||||||||||||
| 106,234 | 103,725 | 96,130 | 108,794 | |||||||||||||||||
| **FDI Flows** | ||||||||||||||||||||
| *(Inward; US$ million)* | ||||||||||||||||||||
| 8,938 | 8,900 | 9,200 | 10,518 | |||||||||||||||||
| **FDI Stock** | ||||||||||||||||||||
| *(Inward; US$ million)* | ||||||||||||||||||||
| 125,533 | 118,985 | 112,965 | 113,711 | |||||||||||||||||
| **Budget Balance** | ||||||||||||||||||||
| *(₱ billion; % of GDP)* | ||||||||||||||||||||
| -1,506 (-5.7) | -1,512 (-6.2) | -1,614 (-7.3) | -1,670 (-8.6) | |||||||||||||||||
| **Revenues** | ||||||||||||||||||||
| *(₱ billion; % of GDP)* | ||||||||||||||||||||
| 4,419 (16.7) | 3,824 (15.7) | 3,546 (16.1) | 3,006 (15.5) | |||||||||||||||||
| **Expenditures** | ||||||||||||||||||||
| *(₱ billion; % of GDP)* | ||||||||||||||||||||
| 5,925 (22.4) | 5,336 (21.9) | 5,160 (23.4) | 4,676 (24.1) | |||||||||||||||||
| **BSP Rates** | ||||||||||||||||||||
| *(Nominal; O-RRP)* | ||||||||||||||||||||
| 6.33 | 6.16 | 3.07 | 2.00 | |||||||||||||||||
| **Public Debt** | ||||||||||||||||||||
| *(₱ billion; % of GDP)* | ||||||||||||||||||||
| 16,051 (60.7) | 14,616 (60.1) | 13,419 (60.9) | 11,729 (60.4) | |||||||||||||||||
| **Peso-Dollar Rate** | ||||||||||||||||||||
| *(Average Period)* | ||||||||||||||||||||
| 57.291 | 55.630 | 54.478 | 49.225 |
GDP-related data can be found here:
- Industries: electronics assembly, aerospace, agribusiness, automotive, IT and business process outsourcing, shipbuilding, garments, footwear, pharmaceuticals, chemicals, wood products, financial services, food processing, petrochemical, metalcasting and mining, real estate, textile, tourism
- Electricity – production: 106,115 GWh (2021)
- Agriculture – products: abaca, bananas, sugarcane, coconuts, durian, rice, corn, cassavas, mangoes; pork, eggs, beef, pineapples, fish
- Exports – commodities/products: Semiconductors and electronic products, machinery, transport equipment, aerospace/parts, automotive/parts, garments, chemicals, copper, nickel, petroleum products, coconut oil, fruits
- Imports – commodities/products: electronic products, machinery, telecommunication and transport equipment, automotive, chemicals, petroleum, cereals, livestocks, cement and steel, fruits
- Manufacturing Growth: 5.9% (April 2024)
- PMI Manufacturing: 52.2 (April 2024)
- Yield Curve: 10-Year Bond 6.70% (June 2024)
- Net International Investment Position: –$51.317 billion (2023 est.)
Government budget
Main article: Fiscal policy of the Philippines
The national government budget for 2025 has set the following budget allocations:
| Budget allocation | (PHP, billions) | (USD, billions) | Difference from | ||||||||||
|---|---|---|---|---|---|---|---|---|---|---|---|---|---|
| F.Y. 2024 | Department of Education | Department of Public Works and Highways | Department of Health | Department of the Interior and Local Government | Department of National Defense | Department of Social Welfare and Development | Department of Agriculture | Department of Transportation | The Judiciary | Department of Labor and Employment | |||
| 977.6 | 16.78 | 0.89% | |||||||||||
| 900.0 | 15.44 | 10.88% | |||||||||||
| 297.6 | 5.11 | 0.36% | |||||||||||
| 278.4 | 4.78 | 5.33% | |||||||||||
| 256.1 | 4.39 | 6.05% | |||||||||||
| 230.1 | 3.95 | 0.78% | |||||||||||
| 211.3 | 3.60 | 0.49% | |||||||||||
| 180.9 | 3.10 | 59.15% | |||||||||||
| 63.6 | 1.09 | 5.35% | |||||||||||
| 40.6 | 0.70 | 5.91% |
References
Notes
References
- "World Economic Outlook, April 2025: A Critical Juncture amid Policy Shifts".
- "World Bank Country and Lending Groups".
- "World Economic Outlook Database, April 2025".
- Mapa, Dennis. "GDP Grows by 3.0 Percent in the Fourth Quarter of 2025: Brings the Full-Year 2025 GDP Year-on-Year Growth Rate to 4.4 Percent". [[Philippine Statistics Authority]].
- "PHILIPPINES: SELECTED ECONOMIC AND FINANCIAL INDICATORS".
- Mapa, Dennis. "Average Monthly Wage Rate of Time-Rated Workers on Full-Time Basis in the Philippines was at PhP 21,544 in 2024". [[Philippine Statistics Authority]].
- Mapa, Dennis. "Summary Inflation Report Consumer Price Index (2018=100): December 2025". [[Philippine Statistics Authority]].
- Mapa, Dennis. "Percentage of Filipino Families Classified as Poor Declined to 10.9 percent in 2023".
- "Poverty headcount ratio at $3.65 a day (2017 PPP) (% of population)". World Bank.
- "GINI Report - Philippines". [[World Bank Group]].
- "Human Development Report 2025 - A matter of choice: People and possibilities in the age of AI". [[United Nations Development Programme]].
- Mapa, Dennis. "Participation in the labor force in November 2025 increased to 51.52 million Filipinos aged 15 years and over". [[Philippine Statistics Authority]].
- "Manufacturing". [[Department of Trade and Industry (Philippines).
- "Census of Philippine Business and Industry (CPBI)".
- "Philippines (PHL) Exports, Imports, and Trade Partners".
- Del Prado, Divina Gracia. "International Merchandise Trade Statistics of the Philippines for Agricultural Commodities, 2024".
- Del Prado, Divina Gracia. "International Merchandise Trade Statistics of the Philippines 2024".
- Mapa, Dennis. "The Country's Total Gross Saving in 2024 expands to PhP 7.70 trillion".
- "Special Data Dissemination Standards, Economic and Financial Data for the Philippines".
- "Gross International Reserves".
- "PHILIPPINES: BALANCE OF PAYMENT".
- "World Investment Report 2025: Philippines".
- (March 5, 2012). "NEDA: Foreign aid releases slightly increased in 2011 | Inquirer Business". [[Philippine Daily Inquirer]].
- "Philippines: Japan Credit Rating Agency, Ltd.".
- Gonzalez, Anna Leah. "S&P Global Ratings raises PH credit outlook to positive".
- Moaje, Marita. "Moody's affirms PH's 'BAA2' investment-grade credit rating".
- "Philippines".
- "The World Bank in the Philippines".
- (June 8, 2022). "High Growth Potential for U.S. Agricultural Exports to the Philippines".
- (September 20, 1999). "The Philippines: September 1999".
- ""The World in 2050."".
- (December 28, 2020). "Philippines poised to be 22nd biggest economy in the world by 2035 — CEBR". [[BusinessWorld]].
- (March 19, 2024). "Philippines could be a $2-trillion economy in next decade —World Economic Forum". [[GMA Integrated News]].
- (2025-09-05). "Philippines extends land leases to 99 years to attract foreign investors". Reuters.
- (January 26, 2023). "Strongest since 1976: PH records 7.6% economic growth in 2022". [[CNN Philippines]].
- [[International Monetary Fund]]. (April 2012). [http://www.imf.org/external/pubs/ft/weo/2012/01/weodata/weorept.aspx?sy=1980&ey=2017&ssm=1&scsm=1&ssd=1&sort=country&ds=.&br=1&pr1.x=40&pr1.y=11&c=566&s=NGDP_R%2CNGDP_RPCH%2CNGDP%2CNGDPD%2CNGDP_D%2CNGDPRPC%2CNGDPPC%2CNGDPDPC%2CPPPGDP%2CPPPPC%2CPPPSH%2CPPPEX%2CNID_NGDP%2CNGSD_NGDP%2CPCPI%2CPCPIPCH%2CPCPIE%2CPCPIEPCH%2CTM_RPCH%2CTMG_RPCH%2CTX_RPCH%2CTXG_RPCH%2CTXGO%2CTMGO%2CLUR%2CLP%2CGGR%2CGGR_NGDP%2CGGX%2CGGX_NGDP%2CGGXCNL%2CGGXCNL_NGDP%2CGGXONLB%2CGGXONLB_NGDP%2CGGXWDG%2CGGXWDG_NGDP%2CNGDP_FY%2CBCA%2CBCA_NGDPD&grp=0&a=#cs1 ''World Economic Outlook Data, By Country – Philippines: [selected annual data for 1980–2017
] '']. Retrieved 2012-06-23 from the World Economic Outlook Database. - (April 2010). "World Economic Outlook (WEO) Database April 2010 – Report for Selected Countries and Subjects – Philippines and United States".
- "Historical Philippine Peso per US Dollar Exchange Rates".
- "World Economic Outlook Database, October 2024".
- "National Accounts of the Philippines (NAP)". [[Philippine Statistics Authority.
- "Report for Selected Countries and Subjects".
- (April 16, 2013). "Report for Selected Countries and Subjects". Imf.org.
- (April 2002). "The World Economic Outlook (WEO) Database April 2002 – Real Gross Domestic Product (annual percent change) – All countries".
- "Philippines: Selected Economic and Financial Indicators (2018=100)".
- (September 27, 2021). "Philippines". Central Intelligence Agency.
- del Rosario, King. "MBA Buzz: More Funds in the Philippines".
- Starr, Kevin. (June 22, 2011). "Coast of Dreams". Knopf Doubleday Publishing Group.
- Gonzalez, Anna Leah. "Remittances from overseas Filipinos hit all-time high in 2024". [[Philippine News Agency]].
- "Employment situation as of December 2022".
- "Agriculture shared (%) of the total GDP".
- (October 20, 2022). "The Food Security, Biodiversity, and Climate Nexus". [[Springer Nature]].
- (1990). "Toward an alternative land reform paradigm: a Philippine perspective". Ateneo de Manila University Press.
- "World pineapple production by Country".
- (March 9, 2022). "This is how much rice is produced around the world - and the countries that grow the most".
- Narvaez-Soriano, Nora. (1994). "A Guide to Food Selection, Preparation and Preservation". [[Rex Book Store, Inc.]].
- (January 30, 2022). "Top 10 Rice Farming Regions in the Philippines". [[Mindanao Times]].
- (December 22, 2020). "PH logs highest rice production rate at 19.44M metric tons: DA". [[Philippine News Agency]].
- "ESS Website ESS: Statistics home".
- "Historical Statistics".
- (2010). "Master Plan For the Philippine Sugar Industry". Sugar Master Plan Foundation, Inc..
- Crismundo, Kris. "PH vehicle assemblers post record-high sales in 2024". [[Philippine News Agency]].
- Oslowski, Justin. (March 25, 2003). "Automotive Production in the Philippines".
- (March 14, 2023). "Chinese cars and ride-hailing cars". [[The Manila Times]].
- (May 22, 2022). "Foton plans expansion with six new dealership locations". [[BusinessWorld]].
- (May 2016). "The Philippines in the Aerospace Global Value Chain". [[Duke University.
- (January 27, 2022). "Aerospace Industry supports RCEP". [[Philippine Information Agency]].
- (January 30, 2006). "TransCo installs 50-MVA transformer in Benguet". [[The Philippine Star]].
- (July 13, 2007). "Intel Phils manager debunks negative perception". [[Philippine Information Agency]].
- (January 9, 2009). "Texas Instruments in Baguio retrenches 392 employees". C114 - China Communication Network.
- (February 20, 2009). "Toshiba unit to expand RP operations". [[The Philippine Star]].
- "Contact Lexmark".
- (2010). "Fostering Production and Science and Technology Linkages to Stimulates Innovation in ASEAN". [[Economic Research Institute for ASEAN and East Asia]].
- "Homepage |".
- "Highlights of the 2022 Annual International Merchandise Trade Statistics of the Philippines".
- (2024-12-09). "Promoting the Growth of the Semiconductor Ecosystem in the Philippines". OECD.
- (2024-07-25). "Semiconductor & Electronics Industries in the Philippines (SEIPI) Foundation, Inc.".
- (2024-08-13). "PHILIPPINE ELECTRONICS EXPORT PERFORMANCE DECEMBER 2023 - SEIPI".
- Power Planning and Development Division, Electric Power Industry Management Bureau. "2019 Power Situation Report".
- (April 8, 2016). "The Report: Philippines 2016". Oxford Business Group.
- Schneider, Keith. (June 8, 2017). "The Philippines, a nation rich in precious metals, encounters powerful opposition to mining". [[Mongabay]].
- Cinco, Maricar. (June 3, 2016). "Firm sees metal costlier than gold in Romblon sea". [[Philippine Daily Inquirer]].
- (December 11, 2020). "Total mineral product export earnings rise". [[Philippine News Agency]].
- Conde, Carlos H.. (December 3, 2004). "Court ruling in Philippines buoys mining sector there". [[The New York Times]].
- (January 2021). "Mineral Commodity Summaries: Nickel". [[United States Geological Survey]].
- (January 2021). "Mineral Commodity Summaries: Cobalt". [[United States Geological Survey]].
- "Philippines' Class A Gold, Copper, Nickel and Chromite Resources Valued at PhP 491.19 Billion in 2022".
- IBM Global Business Services. (October 2008). [ftp://public.dhe.ibm.com/common/ssi/ecm/en/gbl03012usen/GBL03012USEN.PDF ''Global Location Trends – 2008 Annual Report'']{{dead link. (May 2025)
- link. (September 26, 2012 . ''The Philippine Daily Inquirer''.)
- Garcia, Cathy Rose A.. (March 21, 2012). "BPO industry to generate 100,000 jobs this year: WB". [[ABS-CBN News]].
- (November 14, 2022). "A New Dawn for Global Value Chain Participation in the Philippines". [[World Bank Publications]].
- "Information Technology Parks/Centers".
- (July 2, 2020). "Bacolod still 'center of excellence' for IT-BPO". [[SunStar]].
- "foreign companies eye local BPO sector". [[Philippine Daily Inquirer]].
- (2009). "The Language of Outsourced Call Centers: A Corpus-based Study of Cross-cultural Interaction". [[John Benjamins Publishing]].
- (August 2, 2017). "U.S. Foreign Policy: Back to the Water's Edge". [[Rowman & Littlefield]].
- (April 1, 2015). "The Philippines – Poised for Growth Through BPO".
- "How PH Call Centers Promote Employee Welfare {{!}} SVC".
- (December 2021). "The ASEAN climate and energy paradox". Energy and Climate Change.
- "Series of Economic Fora Session 6: Energy Services and Renewable Energy in the New Normal". [[Department of the Interior and Local Government]] (Philippines), [[Center for Research and Communication]].
- "DOE opens RE for full foreign ownership". [[Manila Bulletin]].
- Crismundo, Kris. "Danish firm investing $5-B for offshore wind projects in PH". [[Philippine News Agency]].
- "DOE to achieve renewable energy goals via reforms". [[Philippine News Agency]].
- (November 27, 2013). "The Philippine Shipbuilding Industry".
- (April 17, 2023). "Robust shipbuilding industry key to making PHL a maritime power". [[BusinessWorld]].
- "Cebu shipbuilder to deliver PHs largest vessel". [[Philippine Daily Inquirer]].
- "Registered Shipbuilding and Ship Repair Entity With Facilities, Manpower & Capitalization in Central Office (as of December 2017)".
- (December 4, 2012). "Philippines Shipbuilding Hub In Asia-Pacific". [[Manila Bulletin]].
- "UN Conference on Trade and Development annual report on shipbuilding, by country (2023)". [[UN Conference on Trade and Development]].
- "New era as shipbuilding production begins in the Philippines".
- Poole, William. "Big ambitions for Philippines shipbuilding".
- "Filipino firm invests P259M for shipyard in Navotas". [[BusinessMirror]].
- (March 19, 2022). "How shipbuilding contributes to PH economic growth". [[The Manila Times]].
- "2022 POESA Infographics".
- "Ocean-based industries grew by 21.1 Percent in 2022, Accounted for 3.9 Percent of GDP".
- (April 27, 2023). "All Economies of 17 Regions Continue to Record Positive Growths in 2022; Western Visayas was the Fastest Growing Region at 9.3 Percent".
- "Gross Regional Domestic Product". [[Philippine Statistics Authority]].
- "Authentication challenge pages".
- link. (February 28, 2024 Fraser Institute). Retrieved February 28, 2024.
- [[List of countries by past and projected GDP (PPP)]]
- [[List of countries by past and projected GDP (nominal)]]
- [[List of countries by GDP (PPP) per capita]]
- [[List of countries by GDP (nominal) per capita]]
- [[List of countries by foreign-exchange reserves]]
- "Index Data 2016".
- External Debt [[List of countries by external debt]]
- "Human Development Report 2021/2022". [[United Nations Development Programme]].
- "The Global Competitiveness Report 2019". [[World Economic Forum]].
- "Phl moves up in WEF Enabling Trade Index".
- "The Financial Development Index 2012 rankings: Comparison with 2011". [[World Economic Forum]].
- "Ease of Doing Business Report". [[The World Bank]].
- "2021 Power Statistics".
- [https://www.cia.gov/the-world-factbook/countries/philippines/ CIA World Factbook, Philippines], Retrieved May 15, 2009.
- "Production Index and Net Sales Index (Monthly Integrated Survey of Selected Industries) April 2024 (2018=100)".
- (July 2024). "PHL S&P Global Philippines Manufacturing PMI".
- "PDEX FIXED INCOME (FI) MARKET SUMMARY".
- "PHL-International Investment Position (BPM6)".
- "Briefer on the 2025 Proposed National Budget". [[Department of Budget and Management]].
This article was imported from Wikipedia and is available under the Creative Commons Attribution-ShareAlike 4.0 License. Content has been adapted to SurfDoc format. Original contributors can be found on the article history page.
Ask Mako anything about Economy of the Philippines — get instant answers, deeper analysis, and related topics.
Research with MakoFree with your Surf account
Create a free account to save articles, ask Mako questions, and organize your research.
Sign up freeThis content may have been generated or modified by AI. CloudSurf Software LLC is not responsible for the accuracy, completeness, or reliability of AI-generated content. Always verify important information from primary sources.
Report