From Surf Wiki (app.surf) — the open knowledge base
Demographics of Russia
none

none
| Field | Value |
|---|---|
| place | Russia |
| image | Russia Population Pyramid.svg |
| image_size | 350px |
| caption | Population pyramid of Russia as of 1 January 2024 |
| size_of_population | 146,028,325 (January 2025) |
| fertility | 1.41 (2024) |
| growth | -0.38% (2022) |
| birth | 8.4 births/1,000 population (2024) |
| death | 12.5 deaths/1,000 population (2024) |
| infant_mortality | 4.5 deaths/1,000 live births (2020) |
| life | 73 years (2023) |
| life_male | 68 years (2023) |
| life_female | 79 years (2023) |
| under_18_years | ~23.21% |
| age_18–44_years | ~34.73% |
| age_45-64_years | 26.55% |
| age_65_years | 15.6% |
| total_mf_ratio | 0.86 male(s)/female (2009) |
| sr_at_birth | 1.06 male(s)/female |
| sr_under_15 | 1.06 male(s)/female (male 11,980,138/female 11,344,818) |
| sr_15-64_years | 0.925 male(s)/female (male 48,166,470/female 52,088,967) |
| sr_65_years_over | 0.44 male(s)/female (male 5,783,983/female 13,105,896) |
| net_migration | 0.9 migrant(s)/1,000 population (2020) |
| nation | *noun*: Russian(s) *adjective*: Russian |
| major_ethnic | Russians (71.73%) |
| minor_ethnic | {{unbulleted list |
| official | Russian |
| spoken | Languages of Russia |
|age_18–44_years = ~34.73% |age_45-64_years = 26.55% | sr_15-64_years = 0.925 male(s)/female (male 48,166,470/female 52,088,967) |
- Tatars (3.20%)
- Chechens (1.14%)
- Bashkirs (1.07%)
- Chuvash (0.73%)
- Avars (0.69%)
- Armenians (0.64%)
- Ukrainians (0.60%)
- Dargins (0.43%)
- Kazakhs (0.40%)
- Kumyks (0.38%)
- Kabardians (0.36%)
- Ingush (0.35%)
- Lezgins (0.33%)
- Others (6.65%)
- Undeclared (11.27%)
Russia has an estimated population of 146.0 million as of 1 January 2025, down from 147.2 million recorded in the 2021 census. It is the most populous country in Europe, and the ninth-most populous country in the world. Russia has a population density of 8.5 /km2, with its overall life expectancy being 73 years (68 years for males and 79 years for females) . The total fertility rate across Russia was estimated to be 1.41 children born per woman , which is in line with the European average but below the replacement rate of 2.1.
By the end of 2024, the natural decline of the Russian population amounted to 596.2 thousand people, according to published data from Rosstat. Compared to the end of 2023, the indicator increased by 20.4% (from 495.3 thousand).
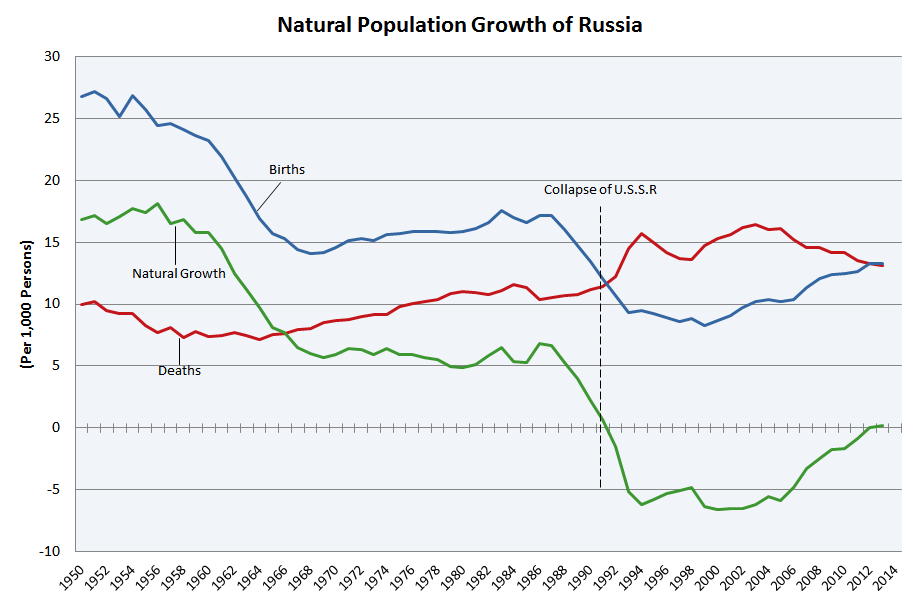
From 1992 to 2012, and again since 2016, Russia's death rate has exceeded its birth rate, which has been called a demographic crisis by analysts. In 2009, Russia recorded annual population growth for the first time in fifteen years; during the mid-2010s, Russia had seen increased population growth due to declining death rates, increased birth rates and increased immigration. Between 2020 and 2021, Russia's population had undergone its largest peacetime decline in recorded history, due to excess deaths from the COVID-19 pandemic.
Russia is a multinational state, home to over 193 ethnic groups nationwide. In the 2021 Census, nearly 72% of the population were ethnic Russians and approximately 19% of the population were ethnic minorities such as the Turkic people.*
- According to the United Nations, Russia's immigrant population is the world's third largest, numbering over 11.6 million; most of whom are from other post-Soviet states.
Population
Demographic statistics according to the latest Rosstat vital statistics and the World Population Review in 2019.
- One birth every 22 seconds
- One death every 13 seconds
- Net loss of one person every 30 seconds
Demographic crisis


After having peaked at 148,689,000 in 1991, the population then decreased, falling to 142,737,196 by 2008. Russia has become increasingly reliant on immigration to maintain its population; 2021 had the highest net immigration since 1994, despite which there was a small overall decline from 146.1 million to 145.4 million in 2021, the largest decline in over a decade.
The natural population had declined by 997,000 between October 2020 and September 2021 (the difference between the number of births and the number of deaths over a period). The natural death rate in January 2020, 2021, and 2022 have each been nearly double the natural birth rate.
Following the Russian invasion of Ukraine in 2022, the demographic crisis in the country has deepened, as the country has suffered high military fatalities while facing renewed human capital flight and brain drain caused by Western mass-sanctions and boycotts. In 2022, tens of thousands of tech workers left Russia. In 2024, the website of the science journal Science indicated that Russia has seen a multi-year brain drain in the science profession and that salaries are decreasing in the Russian scientific community. Many commentators predict that the situation will be worse than during the 1990s. Although, a large part of the emigrants have returned home to Russia in a continuing process.
In March 2023, The Economist reported that "Over the past three years the country has lost around 2 million more people than it would ordinarily have done, as a result of war [in Ukraine], disease and exodus."
The UN is projecting that the decline that started in 2021 will continue, and if current demographic conditions persist, Russia's population will be 120 million in 50 years, a decline of about 17%. In January 2024, the Russian statistics agency Rosstat predicted that Russia's population could drop to 130 million by 2046.
Fertility


Between 1993 and 2008 there was a great decrease in the country's population from 148 to 143 million. There was a huge 50% decrease in the number of births per year from 2.5 million in 1987 to 1.2 million since 1997, but the current 1.42 fertility rate is still higher than that of the 1990s.
At the beginning of 2022, 320,400 babies were born between January and March, 16,600 fewer than January–March 2021. There were nearly twice as many deaths (584,700) as births. The crude birth rate – 8.9 per 100,000 inhabitants – was the lowest since the year 2000.
Russia has a low fertility rate with 1.42 children per woman in 2022, below 2.1 children per woman, which must be the number reached to maintain its population. As a result of their low fertility for decades, the Russian population is one of the oldest in the world with an average of 40.3 years.
Historical fertility rates

The total fertility rate is the number of children born to each woman. It is based on fairly good data for the entire period. Sources: Our World In Data and Gapminder Foundation.
In many of the years from 1843 to 1917, Russia had the highest total fertility rate in the world. These elevated fertility rates did not lead to population growth due to high mortality rate, the casualties of the Russian Revolution, the two world wars and to a lesser extent the political killings.
| TFR | Years | 1840 | 1841 | 1842 | 1843 | 1844 | 1845 | 1846 | 1847 | 1848 | 1849 | 1850 | 1851 | 1852 | 1853 | 1854 | 1855 | 1856 | 1857 | 1858 | 1859 | 1860 | 1861 | 1862 | 1863 | 1864 | 1865 | 1866 | 1867 | 1868 | 1869 | 1870 | 1871 | 1872 | 1873 | 1874 | 1875 | 1876 | 1877 | 1878 | 1879 | 1880 | 1881 | 1882 | 1883 | 1884 | 1885 | 1886 | 1887 | 1888 | 1889 | 1890 | 1891 | 1892 | 1893 | 1894 | 1895 | 1896 | 1897 | 1898 | 1899 | 1900 | 1901 | 1902 | 1903 | 1904 | 1905 | 1906 | 1907 | 1908 | 1909 | 1910 | 1911 | 1912 | 1913 | 1914 | 1915 | 1916 | 1917 | 1918 | 1919 | 1920 | 1921 | 1922 | 1923 | 1924 | 1925 | 1926 |
|---|---|---|---|---|---|---|---|---|---|---|---|---|---|---|---|---|---|---|---|---|---|---|---|---|---|---|---|---|---|---|---|---|---|---|---|---|---|---|---|---|---|---|---|---|---|---|---|---|---|---|---|---|---|---|---|---|---|---|---|---|---|---|---|---|---|---|---|---|---|---|---|---|---|---|---|---|---|---|---|---|---|---|---|---|---|---|---|---|
| 7 | 7 | 7 | 7.01 | 7.02 | 7.03 | 7.05 | 7.06 | 7.08 | 7.08 | |||||||||||||||||||||||||||||||||||||||||||||||||||||||||||||||||||||||||||||||
| 7.07 | 7.07 | 7.07 | 7.06 | 7.05 | 7.03 | 7.01 | 7 | 6.98 | 6.97 | |||||||||||||||||||||||||||||||||||||||||||||||||||||||||||||||||||||||||||||||
| 6.95 | 6.93 | 6.95 | 6.96 | 6.98 | 6.99 | 7.01 | 7.02 | 6.51 | 6.87 | |||||||||||||||||||||||||||||||||||||||||||||||||||||||||||||||||||||||||||||||
| 6.74 | 7.03 | 6.85 | 7.24 | 7.17 | 7.15 | 7.02 | 6.87 | 6.58 | 6.98 | |||||||||||||||||||||||||||||||||||||||||||||||||||||||||||||||||||||||||||||||
| 6.8 | 6.66 | 7.03 | 6.89 | 6.83 | 6.74 | 6.47 | 6.61 | 6.96 | 6.8 | |||||||||||||||||||||||||||||||||||||||||||||||||||||||||||||||||||||||||||||||
| 6.71 | 7.44 | 6.57 | 7.17 | 7.18 | 7.34 | 7.43 | 7.52 | 7.28 | 7.36 | |||||||||||||||||||||||||||||||||||||||||||||||||||||||||||||||||||||||||||||||
| 7.36 | 7.2 | 7.36 | 7.2 | 7.24 | 6.72 | 7.04 | 7.08 | 7.44 | 7.12 | |||||||||||||||||||||||||||||||||||||||||||||||||||||||||||||||||||||||||||||||
| 7.2 | 7.2 | 7.2 | 6.96 | 6.88 | 3.36 | 5.2 | 5.04 | 5.72 | 3.44 | |||||||||||||||||||||||||||||||||||||||||||||||||||||||||||||||||||||||||||||||
| 6.72 | 4.72 | 6 | 6.48 | 6.72 | 6.8 | 6.72 |
| Years | 1941 | 1942 | 1943 | 1944 | 1945 |
|---|---|---|---|---|---|
| 4.60 | 2.96 | 1.68 | 1.72 | 1.92 |
Historical crude birth rates

| Years | 1801–1810 | 1811–1820 | 1821–1830 | 1831–1840 | 1841–1850 | 1851–1860 |
|---|---|---|---|---|---|---|
| Crude birth rates of Russia | 43.7 | 40.0 | 42.7 | 45.6 | 49.7 | 52.4 |
| Years | 1861–1870 | 1871–1880 | 1881–1890 | 1891–1900 | 1901–1910 | 1911–1914 | 18th century | |
|---|---|---|---|---|---|---|---|---|
| (only Orthodox) | 1801–1860 | |||||||
| (only Orthodox) | ||||||||
| Crude birth rates of Russia | 50.3 | 50.4 | 50.4 | 49.2 | 46.8 | 43.9 | 51.0 | 50.0 |
Age structure
File:Russian population by age and sex (demographic pyramid) on 01 January, 1927.png|alt=|Population pyramid in 1927 File:Russia Sex by Age 19410101.png|alt=|Population pyramid in 1941 File:Russia Sex by Age 19460101.png|alt=|Population pyramid in 1946 File:Russia Sex by Age 20150101.png|alt=|Population pyramid in 2015 File:RUS_SbA1y20210101.png|alt=|Population pyramid in 2021 File:Russia animated population pyramid.gif|alt=|Russia animated population pyramid 1946-2023
Structure of the population
| Age group | Male | Female | Total | % | Age group | Male | Female | Total | Percent |
|---|---|---|---|---|---|---|---|---|---|
| Total | 66,264,910 | 76,936,820 | 143,201,730 | 100 | |||||
| 0–4 | 4,377,526 | 4,155,682 | 8,533,208 | 5.97 | |||||
| 5–9 | 3,762,806 | 3,588,032 | 7,350,838 | 5.13 | |||||
| 10–14 | 3,396,364 | 3,231,761 | 6,628,125 | 4.63 | |||||
| 15–19 | 3,776,026 | 3,615,840 | 7,391,866 | 5.16 | |||||
| 20–24 | 5,708,187 | 5,515,543 | 11,223,730 | 7.84 | |||||
| 25–29 | 6,262,379 | 6,179,628 | 12,442,007 | 8.69 | |||||
| 30–34 | 5,583,513 | 5,647,636 | 11,231,149 | 7.84 | |||||
| 35–39 | 5,087,565 | 5,331,818 | 10,419,383 | 7.28 | |||||
| 40–44 | 4,589,504 | 4,861,983 | 9,451,487 | 6.60 | |||||
| 45–49 | 4,632,279 | 5,151,813 | 9,784,092 | 6.83 | |||||
| 50–54 | 5,279,364 | 6,219,077 | 11,498,441 | 8.03 | |||||
| 55–59 | 4,480,855 | 5,817,559 | 10,298,414 | 7.19 | |||||
| 60–64 | 3,523,990 | 5,010,867 | 8,534,857 | 5.96 | |||||
| 65–69 | 1,602,839 | 2,571,671 | 4,174,510 | 2.92 | |||||
| 70–74 | 1,989,724 | 3,975,348 | 5,965,072 | 4.17 | |||||
| 75–79 | 1,179,476 | 2,709,384 | 3,888,860 | 2.72 | |||||
| 80–84 | 722 151 | 2,073,803 | 2,795,954 | 1.95 | |||||
| 85–89 | 253 028 | 1,008,627 | 1,261,655 | 0.88 | |||||
| 90–94 | 46 736 | 219 427 | 266 163 | 0.19 | |||||
| 95–99 | 8 634 | 43 988 | 52 622 | 0.04 | |||||
| 100+ | 1 964 | 7 333 | 9 297 | 0.01 | |||||
| 0–14 | 11,536,696 | 10,975,475 | 22,512,171 | 15.72 | |||||
| 15–64 | 48,923,662 | 53,351,764 | 102,275,426 | 71.42 | |||||
| 65+ | 5,804,552 | 12,609,581 | 18,414,133 | 12.86 |
|0 | 9000000 |1000 | 9000000 |1200 | 14500000 |1500 | 14700000 |1600 | 18000000 |1700 | 18000000 |1800 | 25000000 |1900 | 73000000 |1926 | 93000000 |1930 | 100000000 |1960 | 119000000 |1970 | 130079000 |1979 | 137552000 |1989 | 147386000 |2000 | 146597000 |2010 | 142849000 |2021 | 144700000
Median age
:total: 40.7 years. Country comparison to the world: 51st :male: 37.6 years :female: 43.5 years (2021 est.)
Life expectancy
_-diff.png)
:total population: 70.06 years for a child born in 2021, decreasing from 73.34 in 2019 :male: 65.51 years (2021) :female: 74.51 years (2021)
Infant mortality rate
:total: 4.5 deaths/1,000 live births (2020) :male: 5.0 deaths/1,000 live births (2020) :female: 3.9 deaths/1,000 live births (2020)
Vital statistics
Before WW2
Notable events in Russian demographics:
- Soviet famine of 1930–1933
| Average population | Live births | Deaths | Natural change | Crude birth rate (per 1,000) | Crude death rate (per 1,000) | Natural change (per 1,000) | Crude migration change (per 1,000) | Total fertility rate | Life expectancy | male | female |
|---|---|---|---|---|---|---|---|---|---|---|---|
| 1927 | 94,596,000 | 4,688,000 | 2,705,000 | 1,983,000 | 49.6 | 28.6 | 21.0 | 0.8 | 6.73 | 33.7 | 37.9 |
| 1928 | 96,654,000 | 4,723,000 | 2,589,000 | 2,134,000 | 48.9 | 26.8 | 22.1 | -1.5 | 6.56 | 35.9 | 40.4 |
| 1929 | 98,644,000 | 4,633,000 | 2,819,000 | 1,814,000 | 47.0 | 28.6 | 18.4 | -0.4 | 6.23 | 33.7 | 38.2 |
| 1930 | 100,419,000 | 4,413,000 | 2,738,000 | 1,675,000 | 43.9 | 27.3 | 16.7 | -1.5 | 5.83 | 34.6 | 38.7 |
| 1931 | 101,948,000 | 4,412,000 | 3,090,000 | 1,322,000 | 43.3 | 30.3 | 13.0 | -1.3 | 5.63 | 30.7 | 35.5 |
| 1932 | 103,136,000 | 4,058,000 | 3,077,000 | 981,000 | 39.3 | 29.8 | 9.5 | -5.1 | 5.09 | 30.5 | 35.7 |
| 1933 | 102,706,000 | 3,313,000 | 5,239,000 | −1,926,000 | 32.3 | 51.0 | −18.8 | 20.9 | 4.15 | 15.2 | 19.5 |
| 1934 | 102,922,000 | 2,923,000 | 2,659,000 | 264,000 | 28.7 | 26.1 | 2.6 | -2.6 | 3.57 | 30.5 | 35.7 |
| 1935 | 102,684,000 | 3,577,000 | 2,421,000 | 1,156,000 | 34.8 | 23.6 | 11.3 | 0.6 | 4.31 | 33.1 | 38.4 |
| 1936 | 103,904,000 | 3,899,000 | 2,719,000 | 1,180,000 | 37.5 | 26.2 | 11.4 | 2.6 | 4.54 | 30.4 | 35.7 |
| 1937 | 105,358,000 | 4,377,000 | 2,760,000 | 1,617,000 | 41.5 | 26.2 | 15.3 | 0.7 | 5.08 | 30.5 | 40.0 |
| 1938 | 107,044,000 | 4,379,000 | 2,739,000 | 1,640,000 | 40.9 | 25.6 | 15.3 | 0.9 | 4.99 | 31.7 | 42.5 |
| 1939 | 108,785,000 | 4,329,000 | 2,600,000 | 1,729,000 | 39.8 | 23.9 | 15.9 | -1.7 | 4.91 | 34.9 | 42.6 |
| 1940 | 110,333,000 | 3,814,000 | 2,561,000 | 1,253,000 | 34.6 | 23.2 | 11.4 | 4.26 | 35.7 | 41.9 |
After WW2
Notable events in Russian demographics:
- 1949-1956 – Post–World War II baby boom
- 1991 – Dissolution of the Soviet Union (Russian cross)
| Total average population | Live births | Deaths | Natural change | Crude birth rate | Crude death rate | Natural change | Crude migration change | Total fertility rate | Fertility | Life Expectancy | Abortions reported | urban | rural | male | female | total | |
|---|---|---|---|---|---|---|---|---|---|---|---|---|---|---|---|---|---|
| 1946 | 98,028,000 | 2,546,000 | 1,210,000 | 1,336,000 | 26.0 | 12.3 | 13.6 | -5.4 | 2.81 | 46.6 | 55.3 | ||||||
| 1947 | 98,834,000 | 2,715,000 | 1,680,000 | 1,035,000 | 27.5 | 17.0 | 10.5 | -1.7 | 2.94 | 39.9 | 49.8 | ||||||
| 1948 | 99,706,000 | 2,516,000 | 1,310,000 | 1,206,000 | 25.2 | 13.1 | 12.1 | 2.5 | 2.60 | 47.0 | 56.0 | ||||||
| 1949 | 101,160,000 | 3,089,000 | 1,187,000 | 1,902,000 | 30.5 | 11.7 | 18.8 | -2.3 | 3.21 | 51.0 | 59.8 | ||||||
| 1950 | 102,833,000 | 2,859,000 | 1,180,000 | 1,679,000 | 27.8 | 11.5 | 16.3 | -0.7 | 2.89 | 52.3 | 61.0 | ||||||
| 1951 | 104,439,000 | 2,938,000 | 1,210,000 | 1,728,000 | 28.1 | 11.6 | 16.5 | 0 | 2.92 | 52.3 | 60.6 | ||||||
| 1952 | 106,164,000 | 2,928,000 | 1,138,000 | 1,790,000 | 27.6 | 10.7 | 16.9 | -1.2 | 2.87 | 54.6 | 62.9 | ||||||
| 1953 | 107,828,000 | 2,822,000 | 1,118,000 | 1,704,000 | 26.2 | 10.4 | 15.8 | 1.0 | 2.73 | 55.5 | 63.9 | ||||||
| 1954 | 109,643,000 | 3,048,000 | 1,133,000 | 1,915,000 | 27.8 | 10.3 | 17.5 | 0.1 | 2.97 | 55.9 | 64.1 | ||||||
| 1955 | 111,572,000 | 2,942,000 | 1,037,000 | 1,905,000 | 26.4 | 9.3 | 17.1 | -1.4 | 2.82 | 58.3 | 66.6 | ||||||
| 1956 | 113,327,000 | 2,827,000 | 956,000 | 1,871,000 | 24.9 | 8.4 | 16.5 | -1.4 | 2.73 | 60.1 | 68.8 | ||||||
| 1957 | 115,035,000 | 2,880,000 | 1,017,000 | 1,863,000 | 25.0 | 8.8 | 16.2 | -1.3 | 2.75 | 59.7 | 68.4 | 3,407,398 | |||||
| 1958 | 116,749,000 | 2,861,000 | 931,000 | 1,930,000 | 24.5 | 8.0 | 16.5 | -3.2 | 2.69 | 61.8 | 70.4 | 3,939,362 | |||||
| 1959 | 118,307,000 | 2,796,228 | 920,225 | 1,876,003 | 23.6 | 7.8 | 15.9 | -2.4 | 2.58 | 2.03 | 3.34 | 62.84 | 71.14 | 67.65 | 4,174,111 | ||
| 1960 | 119,906,000 | 2,782,353 | 886,090 | 1,896,263 | 23.2 | 7.4 | 15.8 | -1.8 | 2.56 | 2.06 | 3.26 | 63.67 | 72.31 | 68.67 | 4,373,042 | ||
| 1961 | 121,586,000 | 2,662,135 | 901,637 | 1,760,498 | 21.9 | 7.4 | 14.5 | -1.8 | 2.47 | 2.04 | 3.08 | 63.91 | 72.63 | 68.92 | 4,759,040 | ||
| 1962 | 123,128,000 | 2,482,539 | 949,648 | 1,532,891 | 20.2 | 7.7 | 12.4 | -1.1 | 2.36 | 1.98 | 2.92 | 63.67 | 72.27 | 68.58 | 4,925,124 | ||
| 1963 | 124,514,000 | 2,331,505 | 932,055 | 1,399,450 | 18.7 | 7.5 | 11.2 | -1.3 | 2.31 | 1.93 | 2.87 | 64.12 | 72.78 | 69.05 | 5,134,100 | ||
| 1964 | 125,744,000 | 2,121,994 | 901,751 | 1,220,243 | 16.9 | 7.2 | 9.7 | -1.7 | 2.19 | 1.88 | 2.66 | 64.89 | 73.58 | 69.85 | 5,376,200 | ||
| 1965 | 126,749,000 | 1,990,520 | 958,789 | 1,031,731 | 15.7 | 7.6 | 8.1 | -1.3 | 2.14 | 1.82 | 2.58 | 64.37 | 73.33 | 69.44 | 5,463,300 | ||
| 1966 | 127,608,000 | 1,957,763 | 974,299 | 983,464 | 15.3 | 7.6 | 7.7 | -1.8 | 2.13 | 1.85 | 2.58 | 64.29 | 73.55 | 69.51 | 5,322,500 | ||
| 1967 | 128,361,000 | 1,851,041 | 1,017,034 | 834,007 | 14.4 | 7.9 | 6.5 | -1.2 | 2.03 | 1.79 | 2.46 | 64.02 | 73.43 | 69.30 | 5,005,000 | ||
| 1968 | 129,037,000 | 1,816,509 | 1,040,096 | 776,413 | 14.1 | 8.1 | 6.0 | -1.2 | 1.98 | 1.75 | 2.44 | 63.73 | 73.56 | 69.26 | 4,872,900 | ||
| 1969 | 129,660,000 | 1,847,592 | 1,106,640 | 740,952 | 14.2 | 8.5 | 5.7 | -1.1 | 1.99 | 1.78 | 2.44 | 63.07 | 73.29 | 68.74 | 4,751,100 | ||
| 1970 | 130,252,000 | 1,903,713 | 1,131,183 | 772,530 | 14.6 | 8.7 | 5.9 | -0.7 | 2.00 | 1.77 | 2.52 | 63.07 | 73.44 | 68.86 | 4,837,700 | ||
| 1971 | 130,934,000 | 1,974,637 | 1,143,359 | 831,278 | 15.1 | 8.7 | 6.3 | -0.5 | 2.02 | 1.80 | 2.60 | 63.24 | 73.77 | 69.12 | 4,838,749 | ||
| 1972 | 131,687,000 | 2,014,638 | 1,181,802 | 832,836 | 15.3 | 9.0 | 6.3 | -0.6 | 2.03 | 1.81 | 2.59 | 63.24 | 73.62 | 69.02 | 4,765,900 | ||
| 1973 | 132,434,000 | 1,994,621 | 1,214,204 | 780,417 | 15.1 | 9.2 | 5.9 | 0 | 1.96 | 1.75 | 2.55 | 63.28 | 73.56 | 69.00 | 4,747,037 | ||
| 1974 | 133,217,000 | 2,079,812 | 1,222,495 | 857,317 | 15.6 | 9.2 | 6.4 | 0.2 | 2.00 | 1.78 | 2.63 | 63.12 | 73.77 | 68.99 | 4,674,050 | ||
| 1975 | 134,092,000 | 2,106,147 | 1,309,710 | 796,437 | 15.7 | 9.8 | 5.9 | 1.1 | 1.97 | 1.76 | 2.64 | 62.48 | 73.23 | 68.35 | 4,670,700 | ||
| 1976 | 135,026,000 | 2,146,711 | 1,352,950 | 793,761 | 15.9 | 10.0 | 5.9 | 1.2 | 1.96 | 1.74 | 2.62 | 62.19 | 73.04 | 68.10 | 4,757,055 | ||
| 1977 | 135,979,000 | 2,156,724 | 1,387,986 | 768,738 | 15.9 | 10.2 | 5.7 | 1.2 | 1.92 | 1.72 | 2.58 | 61.82 | 73.19 | 67.97 | 4,686,063 | ||
| 1978 | 136,922,000 | 2,179,030 | 1,417,377 | 761,653 | 15.9 | 10.4 | 5.6 | 0.5 | 1.90 | 1.70 | 2.55 | 61.83 | 73.23 | 68.01 | 4,656,057 | ||
| 1979 | 137,758,000 | 2,178,542 | 1,490,057 | 688,485 | 15.8 | 10.8 | 5.0 | 0.3 | 1.87 | 1.67 | 2.54 | 61.49 | 73.02 | 67.73 | 4,544,040 | ||
| 1980 | 138,483,000 | 2,202,779 | 1,525,755 | 677,024 | 15.9 | 11.0 | 4.9 | 0.4 | 1.87 | 1.68 | 2.51 | 61.38 | 72.96 | 67.70 | 4,506,249 | ||
| 1981 | 139,221,000 | 2,236,608 | 1,524,286 | 712,322 | 16.1 | 10.9 | 5.1 | 1.0 | 1.88 | 1.69 | 2.55 | 61.61 | 73.18 | 67.92 | 4,400,676 | ||
| 1982 | 140,067,420 | 2,328,044 | 1,504,200 | 823,844 | 16.6 | 10.7 | 5.9 | 1.2 | 1.96 | 1.76 | 2.63 | 62.24 | 73.64 | 68.38 | 4,462,825 | ||
| 1983 | 141,056,000 | 2,478,322 | 1,563,995 | 914,327 | 17.6 | 11.1 | 6.5 | 0.6 | 2.11 | 1.89 | 2.76 | 62.15 | 73.41 | 68.15 | 4,317,729 | ||
| 1984 | 142,061,000 | 2,409,614 | 1,650,866 | 758,748 | 17.0 | 11.6 | 5.3 | 1.5 | 2.06 | 1.86 | 2.69 | 61.71 | 72.96 | 67.67 | 4,361,959 | ||
| 1985 | 143,033,000 | 2,375,147 | 1,625,266 | 749,881 | 16.6 | 11.4 | 5.2 | 2.7 | 2.05 | 1.87 | 2.68 | 62.72 | 73.23 | 68.33 | 4,552,443 | ||
| 1986 | 144,156,000 | 2,485,915 | 1,497,975 | 987,940 | 17.2 | 10.4 | 6.9 | 1.0 | 2.18 | 1.98 | 2.83 | 64.77 | 74.22 | 69.95 | 4,579,400 | ||
| 1987 | 145,386,000 | 2,499,974 | 1,531,585 | 968,389 | 17.2 | 10.5 | 6.7 | 1.0 | 2.22 | 1.974 | 3.187 | 64.83 | 74.26 | 69.96 | 4,385,627 | ||
| 1988 | 146,505,000 | 2,348,494 | 1,569,112 | 779,382 | 16.0 | 10.7 | 5.3 | 0.4 | 2.13 | 1.90 | 3.06 | 64.61 | 74.25 | 69.81 | 4,608,953 | ||
| 1989 | 147,342,000 | 2,160,559 | 1,583,743 | 576,816 | 14.7 | 10.7 | 3.9 | 0.4 | 2.01 | 1.83 | 2.63 | 64.20 | 74.50 | 69.73 | 4,427,713 | ||
| 1990 | 147,969,000 | 1,988,858 | 1,655,993 | 332,865 | 13.4 | 11.2 | 2.2 | 0.7 | 1.892 | 1.698 | 2.600 | 63.76 | 74.32 | 69.36 | 4,103,425 | ||
| 1991 | 148,394,000 | 1,794,626 | 1,690,657 | 103,969 | 12.1 | 11.4 | 0.7 | 0.3 | 1.732 | 1.531 | 2.447 | 63.41 | 74.23 | 69.11 | 3,608,421 | ||
| 1992 | 148,538,000 | 1,587,644 | 1,807,441 | -219,797 | 10.7 | 12.2 | -1.5 | 1.7 | 1.547 | 1.351 | 2.219 | 61.96 | 73.71 | 67.98 | 3,436,695 | ||
| 1993 | 148,561,694 | 1,378,983 | 2,129,339 | -750,356 | 9.3 | 14.3 | -5.1 | 3.7 | 1.369 | 1.200 | 1.946 | 58.80 | 71.85 | 65.24 | 3,243,957 | ||
| 1994 | 148,355,867 | 1,408,159 | 2,301,366 | -893,207 | 9.5 | 15.5 | -6.0 | 6.7 | 1.394 | 1.238 | 1.917 | 57.38 | 71.07 | 63.93 | 3,060,237 | ||
| 1995 | 148,459,937 | 1,363,806 | 2,203,811 | -840,005 | 9.2 | 14.9 | -5.7 | 4.6 | 1.337 | 1.193 | 1.813 | 58.11 | 71.60 | 64.62 | 2,766,362 | ||
| 1996 | 148,291,638 | 1,304,638 | 2,082,249 | -777,611 | 8.8 | 14.1 | -5.2 | 3.4 | 1.270 | 1.140 | 1.705 | 59.61 | 72.41 | 65.89 | 2,652,038 | ||
| 1997 | 148,028,613 | 1,259,943 | 2,015,779 | -755,836 | 8.5 | 13.6 | -5.1 | 3.6 | 1.218 | 1.097 | 1.624 | 60.84 | 72.85 | 66.79 | 2,498,716 | ||
| 1998 | 147,802,133 | 1,283,292 | 1,988,744 | -705,452 | 8.7 | 13.5 | -4.8 | 3.0 | 1.232 | 1.109 | 1.643 | 61.19 | 73.12 | 67.14 | 2,346,138 | ||
| 1999 | 147,539,426 | 1,214,689 | 2,144,316 | -929,627 | 8.3 | 14.6 | -6.3 | 1.9 | 1.157 | 1.045 | 1.534 | 59.86 | 72.42 | 65.99 | 2,181,153 | ||
| 2000 | 146,890,128 | 1,266,800 | 2,225,332 | -958,532 | 8.6 | 15.2 | -6.5 | 2.5 | 1.195 | 1.089 | 1.554 | 58.99 | 72.25 | 65.38 | 2,138,800 | ||
| 2001 | 146,303,611 | 1,311,604 | 2,254,856 | -943,252 | 9.0 | 15.4 | -6.5 | 2.0 | 1.223 | 1.124 | 1.564 | 58.88 | 72.16 | 65.30 | 2,114,700 | ||
| 2002 | 145,649,334 | 1,396,967 | 2,332,272 | -935,305 | 9.6 | 16.1 | -6.4 | 1.7 | 1.286 | 1.189 | 1.633 | 58.68 | 71.90 | 64.95 | 1,944,481 | ||
| 2003 | 144,963,650 | 1,477,301 | 2,365,826 | -888,525 | 10.2 | 16.4 | -6.1 | 1.8 | 1.319 | 1.223 | 1.666 | 58.53 | 71.85 | 64.84 | 1,864,647 | ||
| 2004 | 144,333,586 | 1,502,477 | 2,295,402 | -792,925 | 10.4 | 15.9 | -5.5 | 1.8 | 1.344 | 1.253 | 1.654 | 58.91 | 72.36 | 65.31 | 1,797,567 | ||
| 2005 | 143,801,046 | 1,457,376 | 2,303,935 | -846,559 | 10.2 | 16.1 | -5.9 | 2.0 | 1.294 | 1.207 | 1.576 | 58.92 | 72.47 | 65.37 | 1,675,693 | ||
| 2006 | 143,236,582 | 1,479,637 | 2,166,703 | -687,066 | 10.3 | 15.1 | -4.8 | 2.2 | 1.305 | 1.210 | 1.601 | 60.43 | 73.34 | 66.69 | 1,582,398 | ||
| 2007 | 142,862,692 | 1,610,122 | 2,080,445 | -470,323 | 11.3 | 14.6 | -3.3 | 2.5 | 1.416 | 1.294 | 1.798 | 61.46 | 74.02 | 67.61 | 1,479,010 | ||
| 2008 | 142,747,535 | 1,713,947 | 2,075,954 | -362,007 | 12.0 | 14.5 | -2.6 | 2.5 | 1.502 | 1.372 | 1.912 | 61.92 | 74.28 | 67.99 | 1,385,600 | ||
| 2009 | 142,737,196 | 1,761,687 | 2,010,543 | -248,856 | 12.3 | 14.1 | -1.7 | 2.4 | 1.542 | 1.415 | 1.941 | 62.87 | 74.79 | 68.78 | 1,292,389 | ||
| 2010 | 142,833,502 | 1,788,948 | 2,028,516 | -239,568 | 12.5 | 14.2 | -1.7 | 1.9 | 1.567 | 1.439 | 1.983 | 63.09 | 74.88 | 68.94 | 1,186,108 | ||
| 2011 | 142,865,433 | 1,796,629 | 1,925,720 | -129,091 | 12.6 | 13.5 | -0.9 | 2.2 | 1.582 | 1.442 | 2.056 | 64.04 | 75.61 | 69.83 | 1,124,880 | ||
| 2012 | 143,170,950 | 1,902,084 | 1,906,335 | -4,251 | 13.3 | 13.3 | 0.0 | 2.0 | 1.691 | 1.541 | 2.215 | 64.56 | 75.86 | 70.24 | 1,063,982 | ||
| 2013 | 143,585,935 | 1,895,822 | 1,871,809 | 24,013 | 13.3 | 13.0 | 0.2 | 2.0 | 1.707 | 1.551 | 2.264 | 65.14 | 76.31 | 70.77 | 1,012,399 | ||
| 2014 | 144,025,334 | 1,942,683 | 1,912,347 | 30,336 | 13.3 | 13.0 | 0.3 | 17.8 | 1.750 | 1.588 | 2.318 | 65.29 | 76.49 | 70.93 | 929,963 | ||
| 2015 | 146,743,989 | 1,940,579 | 1,908,541 | 32,038 | 13.3 | 13.1 | 0.2 | 1.7 | 1.777 | 1.678 | 2.111 | 65.92 | 76.71 | 71.39 | 848,180 | ||
| 2016 | 147,182,316 | 1,888,729 | 1,891,015 | -2,286 | 12.9 | 12.9 | 0.0 | 1.8 | 1.762 | 1.672 | 2.056 | 66.50 | 77.06 | 71.87 | 836,611 | ||
| 2017 | 147,580,009 | 1,690,307 | 1,826,125 | -135,818 | 11.5 | 12.4 | -0.9 | 1.4 | 1.621 | 1.527 | 1.923 | 67.51 | 77.64 | 72.70 | 779,848 | ||
| 2018 | 147,797,071 | 1,604,344 | 1,828,910 | -224,566 | 10.9 | 12.5 | -1.6 | 0.9 | 1.579 | 1.489 | 1.870 | 67.75 | 77.81 | 72.91 | 661,045 | ||
| 2019 | 147,840,696 | 1,481,074 | 1,798,307 | -317,233 | 10.1 | 12.3 | -2.2 | 2.0 | 1.504 | 1.427 | 1.754 | 68.24 | 78.17 | 73.34 | 621,652 | ||
| 2020 | 147,959,284 | 1,436,514 | 2,138,586 | -702,072 | 9.8 | 14.6 | -4.8 | 0.6 | 1.505 | 1.433 | 1.739 | 66.49 | 76.43 | 71.54 | 553,500 | ||
| 2021 | 147,455,745 | 1,398,253 | 2,441,594 | -1,043,341 | 9.6 | 16.8 | -7.2 | 3.0 | 1.505 | 1.436 | 1.734 | 65.51 | 74.51 | 70.06 | 490,419 | ||
| 2022 | 146,980,061 | 1,304,087 | 1,898,644 | -594,557 | 8.9 | 13.0 | -4.1 | 10.0 | 1.416 | 1.36 | 1.59 | 67.60 | 77.79 | 72.76 | 395,201 | ||
| 2023 | 146,447,424 | 1,264,354 | 1,764,618 | -500,264 | 8.6 | 12.1 | -3.5 | 2.8 | 1.410 | 68.04 | 78.74 | 73.41 | |||||
| 2024 | 146,150,789 | 1,222,408 | 1,818,635 | -596,227 | 8.4 | 12.5 | -4.1 | 2.9 | 1.400 | 72.84 | |||||||
| 2025 | 146,028,325 | 1,175,000 | 8.0 | 1.374 |
| Urban live births | Urban deaths | Urban natural change | Urban crude birth rate (per 1,000) | Urban crude death rate (per 1,000) | Urban natural change (per 1,000) | Rural live births | Rural deaths | Rural natural change | Rural crude birth rate (per 1,000) | Rural crude death rate (per 1,000) | Rural natural change (per 1,000) |
|---|---|---|---|---|---|---|---|---|---|---|---|
| 1950 | 1,171,250 | 436,792 | 734,458 | 26.1 | 9.7 | 16.4 | 1,574,747 | 594,218 | 980,529 | 27.5 | 10.4 |
| 1960 | 1,332,812 | 436,709 | 896,103 | 20.4 | 6.7 | 13.7 | 1,449,541 | 449,831 | 1,000,160 | 26.5 | 8.2 |
| 1970 | 1,205,207 | 646,129 | 559,078 | 14.8 | 7.9 | 6.9 | 698,506 | 485,054 | 213,452 | 14.3 | 10.0 |
| 1980 | 1,535,723 | 970,256 | 565,467 | 15.8 | 10.0 | 5.8 | 667,056 | 555,499 | 111,557 | 16.1 | 13.4 |
| 1990 | 1,386,247 | 1,140,613 | 245,634 | 12.7 | 10.5 | 2.2 | 602,611 | 515,380 | 87,231 | 15.5 | 13.2 |
| 1995 | 933,460 | 1,554,182 | −620,722 | 8.7 | 14.4 | −5.7 | 430,346 | 649,269 | −219,283 | 10.9 | 16.5 |
| 2000 | 886,908 | 1,564,034 | −677,126 | 8.3 | 14.6 | −6.3 | 379,892 | 661,298 | −281,406 | 9.8 | 17.1 |
| 2001 | 928,642 | 1,592,254 | −663,612 | 8.7 | 14.9 | −6.2 | 382,962 | 662,602 | −279,640 | 10.0 | 17.3 |
| 2002 | 998,056 | 1,638,822 | −640,766 | 9.4 | 15.4 | −6.0 | 398,911 | 693,450 | −294,539 | 10.5 | 18.2 |
| 2003 | 1,050,565 | 1,657,569 | −607,004 | 9.9 | 15.6 | −5.7 | 426,736 | 708,257 | −281,521 | 11.1 | 18.4 |
| 2004 | 1,074,247 | 1,606,894 | −532,647 | 10.1 | 15.2 | −5.1 | 428,230 | 688,508 | −260,278 | 11.2 | 18.1 |
| 2005 | 1,036,870 | 1,595,762 | −558,892 | 9.8 | 15.1 | −5.3 | 420,506 | 708,173 | −287,667 | 11.0 | 18.6 |
| 2006 | 1,044,540 | 1,501,245 | −456,705 | 10.0 | 14.3 | −4.3 | 435,097 | 665,458 | −230,361 | 11.4 | 17.4 |
| 2007 | 1,120,741 | 1,445,411 | −324,670 | 10.7 | 13.8 | −3.1 | 489,381 | 635,034 | −145,653 | 12.9 | 16.7 |
| 2008 | 1,194,820 | 1,443,529 | −248,709 | 11.4 | 13.8 | −2.4 | 519,127 | 632,425 | −113,298 | 13.7 | 16.7 |
| 2009 | 1,237,615 | 1,397,591 | −159,976 | 11.8 | 13.3 | −1.5 | 524,072 | 612,952 | −88,880 | 13.9 | 16.3 |
| 2010 | 1,263,893 | 1,421,734 | −157,841 | 12.0 | 13.5 | −1.5 | 520,055 | 606,782 | −81,727 | 14.0 | 16.1 |
| 2011 | 1,270,047 | 1,356,696 | −88,649 | 12.0 | 12.8 | −0.8 | 526,582 | 569,024 | −42,442 | 14.1 | 15.2 |
| 2012 | 1,355,674 | 1,353,635 | 2,039 | 12.8 | 12.8 | 0.0 | 546,410 | 552,700 | −6,290 | 14.7 | 14.8 |
| 2013 | 1,357,310 | 1,332,505 | 24,805 | 12.8 | 12.5 | 0.3 | 538,512 | 539,304 | −792 | 14.5 | 14.5 |
| 2014 | 1,394,860 | 1,362,810 | 32,050 | 12.9 | 12.6 | 0.3 | 547,823 | 549,537 | −1,714 | 14.4 | 14.5 |
| 2015 | 1,455,283 | 1,361,891 | 93,392 | 13.4 | 12.6 | 0.8 | 485,296 | 546,650 | −61,354 | 12.8 | 14.4 |
| 2016 | 1,426,591 | 1,354,944 | 71,597 | 13.1 | 12.4 | 0.7 | 462,138 | 536,071 | −73,933 | 12.2 | 14.2 |
| 2017 | 1,269,527 | 1,310,235 | −40,708 | 11.6 | 12.0 | −0.4 | 420,780 | 515,890 | −95,110 | 11.2 | 13.7 |
| 2018 | 1,205,231 | 1,317,703 | −112,472 | 11.0 | 12.0 | −1.0 | 399,113 | 511,207 | −112,094 | 10.6 | 13.6 |
| 2019 | 1,115,337 | 1,301,650 | −186,313 | 10.2 | 11.9 | −1.7 | 365,737 | 496,657 | −130,920 | 9.8 | 13.3 |
| 2020 | 1,079,887 | 1,568,773 | −488,886 | 9.9 | 14.4 | −4.5 | 356,627 | 569,813 | −213,186 | 9.6 | 15.3 |
| 2021 | 1,047,736 | 1,799,381 | −751,645 | 9.6 | 16.5 | −6.9 | 350,522 | 642,218 | −291,696 | 9.5 | 17.5 |
Current vital statistics
| Period | Live births | Deaths | Natural increase |
|---|---|---|---|
| **January—June 2024** | 599,600 | 921,100 | -321,500 |
| **January—June 2025** | 574,500 | 929,400 | -354,900 |
| **Difference** | -25,100 (-4.19%) | +8,300 (+0.90%) | –33,400 |
| **Source:** |
All numbers for the Russian Federation in this section do not include the Ukrainian regions of Kherson, Zaporizhzhia, Donetsk and Luhansk, which Russia annexed in September 2022 and which are currently partly under Russian military control. The annexation is internationally recognized only by North Korea.
Total fertility rate of federal subjects
| Federal subject | 2024 |
|---|---|
| **Russian Federation** | 1.41 |
| Chechnya | 2.71 |
| Tuva | 2.31 |
| Yamalo-Nenets Autonomous Okrug | 1.92 |
| Altai Republic | 1.87 |
| Ingushetia | 1.84 |
| Dagestan | 1.82 |
| Tyumen Oblast | 1.76 |
| Sakhalin Oblast | 1.73 |
| Chukotka | 1.69 |
| Nenets Autonomous Okrug | 1.66 |
| Khanty–Mansi Autonomous Okrug | 1.65 |
| Astrakhan Oblast | 1.62 |
| Irkutsk Oblast | 1.62 |
| Kabardino-Balkaria | 1.61 |
| North Ossetia–Alania | 1.61 |
| Zabaykalsky Krai | 1.58 |
| Kamchatka Krai | 1.58 |
| Kurgan Oblast | 1.55 |
| Sverdlovsk Oblast | 1.52 |
| Buryatia | 1.52 |
| Sakha | 1.52 |
| Komi Republic | 1.51 |
| Krasnodar Krai | 1.51 |
| Perm Krai | 1.51 |
| Karelia | 1.50 |
| Republic of Crimea | 1.50 |
| Orenburg Oblast | 1.47 |
| Kostroma Oblast | 1.47 |
| Khakassia | 1.46 |
| Novosibirsk Oblast | 1.46 |
| Moscow | 1.46 |
| Chelyabinsk Oblast | 1.45 |
| Tatarstan | 1.44 |
| Khabarovsk Krai | 1.44 |
| Omsk Oblast | 1.43 |
| Kirov Oblast | 1.43 |
| Primorsky Krai | 1.43 |
| Amur Oblast | 1.42 |
| Arkhangelsk Oblast | 1.41 |
| Krasnoyarsk Krai | 1.41 |
| Murmansk Oblast | 1.38 |
| Adygea | 1.38 |
| Chuvashia | 1.36 |
| Bashkortostan | 1.36 |
| Jewish Autonomous Oblast | 1.35 |
| Karachay-Cherkessia | 1.35 |
| Udmurtia | 1.35 |
| Moscow Oblast | 1.34 |
| Vologda Oblast | 1.33 |
| Kaluga Oblast | 1.33 |
| Mari El | 1.33 |
| Samara Oblast | 1.31 |
| Ivanovo Oblast | 1.30 |
| Rostov Oblast | 1.29 |
| Pskov Oblast | 1.29 |
| Kalmykia | 1.28 |
| Nizhny Novgorod Oblast | 1.28 |
| Yaroslavl Oblast | 1.27 |
| Ulyanovsk Oblast | 1.27 |
| Stavropol Krai | 1.26 |
| Tver Oblast | 1.26 |
| Saint Petersburg | 1.26 |
| Kursk Oblast | 1.24 |
| Altai Krai | 1.24 |
| Magadan Oblast | 1.23 |
| Novgorod Oblast | 1.22 |
| Voronezh Oblast | 1.21 |
| Kaliningrad Oblast | 1.20 |
| Oryol Oblast | 1.18 |
| Lipetsk Oblast | 1.18 |
| Kemerovo Oblast | 1.17 |
| Tomsk Oblast | 1.16 |
| Tambov Oblast | 1.16 |
| Penza Oblast | 1.15 |
| Bryansk Oblast | 1.14 |
| Vladimir Oblast | 1.14 |
| Tula Oblast | 1.14 |
| Ryazan Oblast | 1.12 |
| Volgograd Oblast | 1.12 |
| Belgorod Oblast | 1.07 |
| Saratov Oblast | 1.06 |
| Smolensk Oblast | 1.05 |
| Sevastopol | 1.00 |
| Mordovia | 0.99 |
| Leningrad Oblast | 0.89 |
Immigration
Main article: Immigration to Russia
In 2006, in a bid to compensate for the country's demographic decline, the Russian government started simplifying immigration laws. New citizenship rules introduced in April 2014 allowing eligible citizens from former Soviet republics to obtain Russian citizenship, have gained strong interest among Russian-speaking residents of those countries (i.e. Russians, Germans, Belarusians and Ukrainians).
There are an estimated four million undocumented immigrants from the ex-Soviet states in Russia. In 2012, the Russian Federal Security Service's Border Service stated there had been an increase in undocumented migration from the Middle East and Southeast Asia (Note that these were Temporary Contract Migrants) Under legal changes made in 2012, undocumented immigrants who are caught will be banned from reentering the country for 10 years.
Since the collapse of the USSR, most immigrants have come from Ukraine, Uzbekistan, Tajikistan, Azerbaijan, Armenia, Kyrgyzstan, Moldova, Kazakhstan, Turkmenistan, Belarus, from poor areas of China, and from Vietnam and Laos.
Worker migration
Main article: Migrant workers in Russia
Temporary migrant workers in Russia consists of about 7 million people. Most of the temporary workers come from Central Asia (mostly from Uzbekistan, Tajikistan and Kyrgyzstan), the South Caucasus (mostly from Armenia and Azerbaijan), and East Asia (mostly from poor areas of China, from Vietnam and Laos). Most of them work in the construction, cleaning and in the household industries. They primarily live in cities such as Moscow and Moscow Oblast, Saint Petersburg, Yekaterinburg, Novosibirsk, Kazan, Nijniy Novgorod, Vladivostok, Samara, Krasnodar, Ufa, Sochi, Khabarovsk, Krasnoyarsk, Chelyabinsk, Rostov on Don, Volgograd, Omsk, Tyumen, Voronezh, Perm and others. The mayor of Moscow said that Moscow cannot do without worker migrants. New laws are in place that require worker migrants to be fluent in Russian, know Russian history and laws.
Emigration
Main article: Russian diaspora
The 2022 Russian invasion of Ukraine has led to considerable emigration, with over 300,000 Russian citizens and residents estimated to have left Russia by mid-March 2022, at least 500,000 by the end of August 2022, and an additional 400,000 by early October. The total number of political refugees, economic migrants, and conscientious objectors is thought to be more than 900,000. In addition to evading criminal prosecution for opposing the invasion, and fear of being conscripted after President Vladimir Putin's 21 September 2022 announcement of partial mobilization, those fleeing voiced reasons such as disagreement with the war, the uselessness and cruelty of the war, sympathy for Ukraine, disagreement with the political roots of the war with Ukraine, the rejection of killing, and an assessment that Russia is no longer the place for their family.
Occupied and annexed regions
Russia has encouraged or even forced people in occupied or annexed regions to become Russian citizens, a procedure known as passportization. This includes the Donetsk, Kherson, Luhansk and Zaporizhzhia oblasts and the Autonomous Republic of Crimea of Ukraine, as well as South Ossetia and Abkhazia in Georgia.
Employment and income
;Unemployment, youth ages 15–24 : :total: 12%. Country comparison to the world: 72nd :male: 15.3% :female: 16.9% (2015 est.)
Health
Main article: Healthcare in Russia

Russia's constitution guarantees free, universal health care for all Russian citizens, through a compulsory state health insurance program. The Ministry of Health of the Russian Federation oversees the Russian public healthcare system, and the sector employs more than two million people. Federal regions also have their own departments of health that oversee local administration. A separate private health insurance plan is needed to access private healthcare in Russia.
Russia spent 5.32% of its GDP on healthcare in 2018. Its healthcare expenditure is notably lower than other developed nations. Russia has one of the world's most female-biased sex ratios, with 0.859 males to every female with more older females than males prevailing, due to its high male mortality rate in later age. In 2019, the overall life expectancy in Russia at birth was 73.2 years (68.2 years for males and 78.0 years for females), and it had a very low infant mortality rate (5 per 1,000 live births).
The principal causes of death in Russia are cardiovascular diseases. Obesity is a prevalent health issue in Russia; 61.1% of Russian adults were overweight or obese in 2016. However, Russia's historically high alcohol consumption rate is the biggest health issue in the country, as it remains one of the world's highest, despite a stark decrease in the last decade. Smoking is another health issue in the country. The country's high suicide rate, although on the decline, remains a significant social issue.
COVID-19 pandemic
Main article: COVID-19 pandemic in Russia
Russia had one of the highest number of confirmed cases in the world. Analysis of excess deaths from official government demographic statistics, based on births and deaths and excluding migration, showed that Russia had its biggest ever annual population drop in peacetime, with the population declining by 997,000 between October 2020 and September 2021, which demographer Alexei Raksha interpreted as being primarily due to the COVID-19 pandemic.
Ethnic groups
Main article: Ethnic groups in Russia
Russia is a multinational state, with many subnational entities associated with different minorities. There are over 193 ethnic groups nationwide. In the 2021 census, nearly 71.73% of the population identified as ethnic Russians (among those stating their ethnicity), and while approximately 19% of the total population identified with various ethnic minority groups.*
- The percentage of total Russian population that did not publicly indicate any ethnic identity in the census increased from 3.94% in 2010 to 11.27% in 2021.
According to the 2021 Russian census, the number of ethnic Russians decreased by nearly 5.43 million, from roughly 111 million people in 2010 to approximately 105.5 million in 2021.
In 2010, four-fifths of Russia's population originated from West of the Ural Mountains — of which the vast majority were Slavs, with a substantial minority of Finno-Ugric and Germanic peoples. Turkic peoples form a large minority, and are spread around pockets across the vast nation. Various distinct ethnic groups also inhabit the North Caucasus. Other minorities include Mongolian peoples (Buryats and Kalmyks), the Indigenous peoples of Siberia, a historical Jewish population, and the Koryo-saram (including Sakhalin Koreans).
According to the United Nations, Russia's immigrant population was the third-largest in the world as recently as 2016, numbering over 11.6 million; most of which are from post-Soviet states, mainly from Central Asia. Due to a decline in immigrant population and increases in other countries, Russia has the tenth largest immigrant population with 7.6 million as of 2024. There are 22 republics in Russia, who have their own ethnicities, cultures, and languages. In 12 of them in 2021, ethnic Russians constitute a minority:
| Ethnic Russian-minority regions in Russia in 2021 | Republic | ethnic Russians (%) |
|---|---|---|
| Bashkortostan | ||
| Chechnya | ||
| Chuvashia | ||
| Dagestan | ||
| Ingushetia | ||
| Kabardino-Balkaria | ||
| Kalmykia | ||
| Karachay-Cherkessia | ||
| North Ossetia–Alania | ||
| Sakha Republic | ||
| Tatarstan | ||
| Tuva |
Languages
Main article: Russian language, Languages of Russia
Russian is the official and the predominantly spoken language in Russia. It is the most spoken native language in Europe, the most geographically widespread language of Eurasia, as well as the world's most widely spoken Slavic language. Russian is the fifth-most used language on the Internet, and is one of two official languages aboard the International Space Station, as well as one of the six official languages of the United Nations.
Russia is a multilingual nation; approximately 100–150 minority languages are spoken across the country. According to the Russian Census of 2002, 142.6 million across the country spoke Russian, 5.3 million spoke Tatar, and 1.8 million spoke Ukrainian. The constitution allows the country's individual republics the right to establish their own state languages in addition to Russian, as well as guarantee its citizens the right to preserve their native language and to create conditions for its study and development. However, various experts have claimed Russia's linguistic diversity is rapidly declining.
Religion
Main article: Religion in Russia
Russia is a secular state by constitution, and its largest religion is Christianity. It has the world's largest Orthodox population. As of different sociological surveys on religious adherence, between 41% and over 80% of the total population of Russia adhere to the Russian Orthodox Church. Other branches of Christianity present in Russia include Catholicism (approx. 1%), Baptists, Pentecostals, Lutherans and other Protestant churches (together totalling about 0.5% of the population) and Old Believers. There is some presence of Judaism, Buddhism, and Hinduism; pagan beliefs are also present to some extent in remote areas, sometimes syncretized with one of the mainstream religions.
In 2017, a survey made by the Pew Research Center showed that 73% of Russians declared themselves as Christians—out of which 71% were Orthodox, 1% were Catholic, and 2% were Other Christians, while 15% were unaffiliated, 10% were Muslims, and 1% followed other religions. According to various reports, the proportion of Atheists in Russia is between 16% and 48% of the population.
Islam is the second-largest religion in Russia, and it is the traditional religion among most peoples of the North Caucasus, and among some Turkic peoples scattered along the Volga-Ural region. Buddhists have a sizable population in three Siberian republics: Buryatia, Tuva, and Zabaykalsky Krai, and in Kalmykia, the only region in Europe where Buddhism is the most practised religion.
Education
Main article: Education in Russia

Russia has an adult literacy rate of 100%. It grants free education to its citizens under its constitution. The Ministry of Education of Russia is responsible for primary and secondary education, as well as vocational education; while the Ministry of Education and Science of Russia is responsible for science and higher education. Regional authorities regulate education within their jurisdictions within the prevailing framework of federal laws. Russia is among the world's most educated countries, and has the third-highest proportion of tertiary-level graduates in terms of percentage of population, at 62%. It spent roughly 4.7% of its GDP on education in 2018.
Russia has compulsory education for a duration of 11 years, exclusively for children aged 7 to 17–18. Its pre-school education system is highly developed and optional, some four-fifths of children aged 3 to 6 attend day nurseries or kindergartens. Primary school is compulsory for 11 years, starting from age 6 to 7, and leads to a basic general education certificate. An additional two or three years of schooling are required for the secondary-level certificate, and some seven-eighths of Russians continue their education past this level. Admission to an institute of higher education is selective and highly competitive: first-degree courses usually take five years. The oldest and largest universities in Russia are Moscow State University and Saint Petersburg State University. There are ten highly prestigious federal universities across the country. Russia was the world's fifth-leading destination for international students in 2019, hosting roughly 300,000.
Urbanized areas
File:Business Centre of Moscow 2.jpg|Moscow, the capital and largest city of Russia File:Spb 06-2017 img01 Spit of Vasilievsky Island.jpg|Saint Petersburg, the cultural capital and the second-largest city File:E-burg asv2019-05 img46 view from VysotSky.jpg|Yekaterinburg, the fourth-largest city in the country. Russia is one of the world's most urbanized countries, with roughly 75% of its total population living in urban areas. Moscow, the capital and largest city, has a population estimated at 12.4 million residents within the city limits, while over 17 million residents in the urban area, and over 20 million residents in the metropolitan area. Moscow is among the world's largest cities, being the most populous city entirely within Europe, the most populous urban area in Europe, the most populous metropolitan area in Europe, and also the largest city by land area on the European continent. Saint Petersburg, the cultural capital, is the second-largest city, with a population of roughly 5.4 million inhabitants. Other major urban areas are Yekaterinburg, Novosibirsk, Kazan, Nizhny Novgorod, and Chelyabinsk.
Notes
References
References
- link. [[Federal State Statistics Service (Russia). Russian Federal State Statistics Service]]
- "Росстат: Суммарный коэффициент рождаемости продолжил тенденцию к снижению в РФ в 2024 году".
- (2023-02-01). "Население России за год сократилось на 555 тыс. человек".
- (21 February 2025). "Естественное движение населения в разрезе субъектов российской федерации за декабрь 2024 года".
- "Демографический ежегодник России". [[Federal State Statistics Service (Russia).
- "Russia Demographics 2020 (Population, Age, Sex, Trends) – Worldometer".
- "Национальный состав населения". [[Federal State Statistics Service (Russia).
- (10 January 2023). "5 Million Fewer Than in 2010, Ethnic Russians Make Up Only 72 Percent of Russia's Population". The Jamestown Foundation.
- {{ru-pop-ref. 2021Census
- 146,028,325 inhabitants / 17,098,246 km² = 8.5 inhabitants per km²
- "Life expectancy at birth, total (years) - Russian Federation". [[World Bank]].
- "Life expectancy at birth, male (years) - Russian Federation". [[World Bank]].
- "Life expectancy at birth, female (years) - Russian Federation". [[World Bank]].
- (2025-02-25). "Рейтинг рождаемости в регионах: кто в лидерах, а кто в аутсайдерах {{!}} Москва".
- (15 January 2020). "Russia's Putin seeks to stimulate birth rate". BBC.
- (2025-02-25). "Естественная убыль пошла в рост".
- Koehn, Jodi. (5 February 2001). "Russia's Demographic Crisis". [[Woodrow Wilson International Center for Scholars]].
- Foltynova, Kristyna. (19 June 2020). "Migrants Welcome: Is Russia Trying To Solve Its Demographic Crisis By Attracting Foreigners?". [[Radio Free Europe/Radio Liberty]].
- Saver, Pjotr. (13 October 2021). "Russia's population undergoes largest ever peacetime decline, analysis shows". [[The Guardian]].
- "Росстат — Новости Росстата".
- "Russia Population 2018".
- (2 May 2014). "Russia's decaying villages". Al Jazeera.
- "Интерактивная витрина".
- (2022). "Миграция в России, предварительные итоги 2021 года (Migration in Russia, preliminary results of 2021)". Институт демографии НИУ ВШЭ имени А.Г. Вишневского (Institute of Demography, National Research University A.G. Vishnevsky).
- (6 March 2022). "Natural population decrease in Russia down by 21% in Jan 2022 vs Jan 2021, but twice higher than in Jan 2020 – Rosstat". Interfax News Agency.
- Sauer, Pjotr. (13 October 2021). "Russia's population undergoes largest ever peacetime decline". The Guardian.
- (6 March 2022). "Natural population decrease in Russia down by 21% in Jan 2022 vs Jan 2021, but twice higher than in Jan 2020 – Rosstat". Interfax News Agency.
- (26 February 2023). "Russia stares into population abyss as Putin sends its young men to die". The Telegraph.
- (4 April 2022). "Ukraine war threatens to deepen Russia's demographic crisis". [[Financial Times]].
- [https://www.nytimes.com/2022/04/13/technology/russia-tech-workers.html Russian Tech Industry Faces ‘Brain Drain’ as Workers Flee], ''[[New York Times]]'', April 13, 2022.
- [https://apnews.com/article/russia-ukraine-putin-immigration-kazakhstan-technology-c041eb0b7472668087bb94207de2f71d As Russia sees tech brain drain, other nations hope to gain], ''[[Associated Press]]'', March 31, 2022
- [https://www.science.org/content/article/news-glance-russian-brain-drain-trump-s-nominees-and-long-distance-traveler-goes News at a glance: Russian brain drain, Trump’s nominees, and a long-distance traveler goes extinct], website of the science journal [[Science (journal). Science]]. 21 Nov 2024
- Goble, Paul. (18 August 2022). "Russia's Demographic Collapse Is Accelerating". [[Jamestown Foundation]].
- (11 July 2024). "Should I Stay or Should I Go? Russian Emigration in Flux". [[Carnegie Endowment for International Peace]].
- (4 March 2023). "Russia's population nightmare is going to get even worse". [[The Economist]].
- (2022). "World Population Prospects 2022, Standard Projections, Compact File, Variant tab, Total Population, as of 1 January column".
- (12 January 2024). "Russia's Population Could Fall to 130Mln by 2046 – Rosstat". [[The Moscow Times]].
- "Суммарный коэффициент рождаемости".
- Ben Aris. (4 May 2022). "Russian fertility rates fall to record lows on the back of a deteriorating economy and sanctions pressure".
- Max Roser. (2014). "Total Fertility Rate around the world over the last centuries". [[Our World in Data]], [[Gapminder Foundation]].
- "А. Г. Рашин. Население России за 100 лет (1811—1913 гг.). Статистические очерки. Раздел первый. Масштабы и темпы динамики численности населения России за 1811—1913 гг. Глава первая. Динамика общей численности населения России за 1811—1913 гг. страница 38".
- "UNSD — Demographic and Social Statistics".
- "Russia Population 0 to 1800 – Our World in Data".
- "Russia: historical demographical data of the whole country".
- link. [[Russian Federal State Statistics Service. Rosstat]]
- (3 May 2021). "Population of Russia 2022 {{!}} Religion in Russia". Findeasy.in.
- E.Andreev, L.Darski, T. Kharkova "Histoire démographique de la Russie. 1927–1959"
- "Goskomstat". [[Goskomstat]].
- "Демография".
- (8 May 2010). "Каталог публикаций::Федеральная служба государственной статистики".
- "Численность населения".
- "ЕМИСС – Число прерываний беременности".
- "The Demographic Yearbook of Russia 2019".
- [https://www.gks.ru/storage/mediabank/Popul2020.xls Population 2020] {{Webarchive. link. (26 March 2020)
- "Archived copy".
- "fedstat.ru".
- "showdata.gks.ru".
- (14 March 2025). "Естественное движение населения в разрезе субъектов российской федерации за январь 2025 года".
- Lomsadze, Giorgi. (23 April 2014). "The Caucasus Concerned over Born-Again Russians".
- "Uzbekistan: Minorities Taking Advantage of New Russian Citizenship Rules". EurasiaNet.org.
- (23 November 2010). "Новости NEWSru.com :: ФМС: в РФ нелегально работают 3 млн трудовых мигрантов, остальные 4 млн "халтурят" с налогами".
- "Russia reports surge in undocumented migration from Asia". [[Indian Express]].
- "Illegal immigrants can be barred from Russia for 5–10 years". [[The Voice of Russia]].
- "Russia closed for immigration?". Russia.
- "ФМС России".
- (13 February 2023). "Russians abandon wartime Russia in historic exodus". Washington Post.
- (10 April 2022). "Fleeing Putin, Thousands of Educated Russians Are Moving Abroad". [[The Wall Street Journal]].
- Demytrie, Rayhan. (13 March 2022). "Russia faces brain drain as thousands flee abroad". BBC News.
- Bershidsky, Leonid. (15 March 2022). "Russia's Brain Drain Becomes a Stampede for the Exits".
- (4 April 2022). "Russia's war migrants find mixed reception in Georgia". Japan Times.
- (5 April 2022). "Who are the Russians leaving their country?". Deutsche Welle.
- (23 September 2022). "Traffic jams and desperation at the border as Russians flee Putin's 'partial mobilization'".
- [https://www.politico.eu/article/ukraine-citizenship-war-russia-weaponize-passport-passportization-mobilization-draft/ "Forced to fight your own people: How Russia is weaponizing passports"] {{Webarchive. link. (3 August 2023 , Politico, 1 January 2023)
- [https://www.osce.org/files/f/documents/7/d/73289.pdf "Human Rights in the Occupied Territories of Georgia"] {{Webarchive. link. (17 January 2023 , Organization for Security and Co-operation in Europe (OSCE), 18 October 2010)
- Morton, Elise. (25 May 2018). "Russian rivieia: from Soviet sanatoriums to lush gardens, your walking guide to seaside Sochi". [[Calvert 22 Foundation]].
- Cook, Linda. (February 2015). "Constraints on Universal Health Care in the Russian Federation". United Nations.
- (8 January 2021). "Healthcare in Russia: the Russian healthcare system explained". [[Expatica]].
- "Current health expenditure (% of GDP) – Russian Federation". [[World Bank]].
- (24 May 2019). "Analysis of the Financing of Russian Health Care over the Past 100 Years". [[International Journal of Environmental Research and Public Health]].
- (7 February 2020). "Russia". [[The World Factbook]].
- Nuwer, Rachel. (17 February 2014). "Why Russian Men Don't Live as Long". [[The New York Times]].
- (2020). "Life expectancy and Healthy life expectancy, data by country". [[World Health Organization]].
- "Mortality rate, infant (per 1,000 live births) – Russian Federation". [[World Bank]].
- (2020). "Why does Russia have such high cardiovascular mortality rates? Comparisons of blood-based biomarkers with Norway implicate non-ischaemic cardiac damage". Journal of Epidemiology and Community Health.
- (11 August 2017). "Obesity". [[Our World in Data]].
- McKee, Martin. (1 November 1999). "Alcohol in Russia". Alcohol and Alcoholism.
- Fedun, Stan. (25 September 2013). "How Alcohol Conquered Russia". [[The Atlantic]].
- (5 October 2019). "Russia's alcohol policy: a continuing success story". [[The Lancet]].
- (23 March 2020). "Time trends in smoking in Russia in the light of recent tobacco control measures: synthesis of evidence from multiple sources". BMC Public Health.
- "Suicide mortality rate (per 100,000 population) – Russian Federation". [[World Bank]].
- (9 October 2020). "Preventing suicide: Russian Federation adapts WHO self-harm monitoring tool". [[World Health Organization]].
- Curtis, Glenn E.. (1998). "Russia – Ethnic Composition". Federal Research Division of the [[Library of Congress]].
- "Национальный состав населения". [[Federal State Statistics Service (Russia).
- Sidorov, Harun. (7 January 2023). ""Русский мир" Путина и "кот Шредингера"". idelreal.org.
- "Russia – The Indo-European Group".
- (2000). "Power and Ethnicity in the Finno-Ugric Republics of the Russian Federation: The Examples of Komi, Mordovia, and Udmurtia". [[Taylor & Francis]].
- Bartlett, Roger. (July 1995). "The Russian Germans and Their Neighbours". [[Modern Humanities Research Association]].
- Hostler, Charles W.. (1958). "The Turks and Soviet Central Asia". [[Middle East Institute]].
- Sagramoso, Domitilla. (2007). "Violence and Conflict in the Russian North Caucasus". [[Oxford University Press]].
- Zhukovskaya, Natalya L.. (13 September 2007). "Religion and ethnicity in eastern Russia, republic of Buryatia: A panorama of the 1990s". [[Taylor & Francis]].
- Szilagyi, Patricia. (26 May 2021). "The only Buddhist region in Europe". [[Deutsche Welle]].
- Vinokurova, Uliana. (December 2018). "Indigenous Peoples of Siberia and the Challenges of the Twenty-First Century". [[Berghahn Books]].
- Jack, Victor. (4 July 2022). "Russia's Jews fear resurgent anti-Semitism amid Ukraine war". [[Politico]].
- Park, Hyun-gwi. (2013). "The Migration Regime among Koreans in the Russian Far East". [[Brill Publishers.
- Kirk, Ashley. (21 January 2016). "Mapped: Which country has the most immigrants?". [[The Daily Telegraph]].
- Ragozin, Leonid. (14 March 2017). "Russia Wants Immigrants the World Doesn't". [[Bloomberg L.P.]].
- "International Migrant Stock {{!}} Population Division".
- Laub, Zachary. (7 February 2014). "Background Briefing: Why is Russia's North Caucasus region unstable?". [[PBS]].
- "The North Caucasus Bilingualism and Language Identity". Pyatigorsk State Linguistic University.
- "Usage statistics of content languages for websites".
- Wakata, Koichi. "My Long Mission in Space". [[JAXA]].
- "Russian". [[University of Toronto]].
- Iryna, Ulasiuk. (2011). "Legal protection of linguistic diversity in Russia: past and present". [[European University Institute]].
- "Russia – Ethnic groups and languages".
- "Russian Census of 2002". [[Rosstat]].
- "Chapter 3. The Federal Structure". [[Constitution of Russia]].
- (13 March 2020). "Linguistic rights and education in the republics of the Russian Federation: towards unity through uniformity". [[Brill Publishers.
- (2018). "Linguistic Diversity In Russia Is A Threat To Sovereignty Or A Condition Of Cohesion?". Modern Journal of Language Teaching Methods.
- (2 May 2024). "Русская православная церковь". Фонд Общественное Мнение, ФОМ (Public Opinion Foundation).
- (10 May 2017). "Religious Belief and National Belonging in Central and Eastern Europe".
- (10 November 2017). "Orthodox Christianity in the 21st Century".
- There is no official census of religion in Russia, and estimates are based on surveys only. In August 2012, [http://sreda.org/arena ARENA] {{Webarchive. link. (12 October 2012 determined that about 46.8% of Russians are Christians (including Orthodox, [[Catholic Church in Russia). Catholic]], Protestant, and non-denominational), which is slightly less than an absolute 50%+ majority. However, later that year the [http://www.levada.ru/17-12-2012/v-rossii-74-pravoslavnykh-i-7-musulman Levada Center] {{Webarchive. link. (31 December 2012 determined that 76% of Russians are Christians, and in June 2013 the [http://fom.ru/obshchestvo/10953 Public Opinion Foundation] {{Webarchive). link. (15 April 2020 determined that 65% of Russians are Christians. These findings are in line with [http://www.pewforum.org/2011/12/19/global-christianity-exec/ Pew] {{Webarchive). link. (10 May 2020 's 2010 survey, which determined that 73.3% of Russians are Christians, with [http://wciom.ru/index.php?id=268&uid=13365 VTSIOM] {{Webarchive). link. (29 September 2020 's 2010 survey (≈77% Christian), and with [http://www.fgi-tbff.org/sites/default/files/elfinder/FGIImages/Research/fromresearchtopolicy/ipsos_mori_briefing_pack.pdf#page=40 Ipsos MORI] {{webarchive). link. (17 January 2013 's 2011 survey (69%).)
- ''[http://www.kommersant.ru/doc/1997068 Верю — не верю] {{Webarchive. link. (27 August 2012 ''. "Ogonek", No. 34 (5243), 27 August 2012. ''Retrieved 24 September 2012''.)
- link
- [http://sreda.org/en/arena "Arena: Atlas of Religions and Nationalities in Russia"] {{Webarchive. link. (6 December 2017 . Sreda, 2012.)
- [http://c2.kommersant.ru/ISSUES.PHOTO/OGONIOK/2012/034/ogcyhjk2.jpg 2012 Arena Atlas Religion Maps]. ''Ogonek'', No. 34 (5243), 27 August 2012. Retrieved 21 April 2017. [https://web.archive.org/web/20170421154615/http://c2.kommersant.ru/ISSUES.PHOTO/OGONIOK/2012/034/ogcyhjk2.jpg Archived].
- (10 May 2017). "Religious Belief and National Belonging in Central and Eastern Europe". [[Pew Research Center]].
- Zuckerman, P.. (2005). "The Cambridge Companion to Atheism". Cambridge University Press.
- (2010). "Europe: Belarus, Russian Federation and Ukraine". [[Marshall Cavendish]].
- Jardine, Bradley. (4 January 2017). "Russia's Buddhist Republic". [[The Diplomat (magazine).
- "Lomonosov Moscow State University". [[QS World University Rankings]].
- "Literacy rate, adult total (% of people ages 15 and above) – Russian Federation". [[World Bank]].
- Oleg, Kouptsov. (1997). "Mutual recognition of qualifications: the Russian Federation and the other European countries". [[UNESCO]].
- (October 2019). "Education system Russia". [[Nuffic]].
- (2022). "Population with tertiary education". [[OECD]].
- "Government expenditure on education, total (% of GDP) – Russian Federation". [[World Bank]].
- (2006). "Early childhood care and education in the Russian Federation". [[UNESCO]].
- "Russia – Education".
- Ridder-Symoens, Hilde de. (1996). "History of the University in Europe: Volume 2, Universities in Early Modern Europe (1500–1800)". [[Cambridge University Press]].
- "Global Flow of Tertiary-Level Students". [[UNESCO]].
- (8 August 2020). "RUSSIA: Central'nyj Federal'nyj Okrug – Central Federal District". City Population.de.
- "Demographia World Urban Areas". Demographia.
- Alexander Akishin. (17 August 2017). "A 3-Hour Commute: A Close Look At Moscow The Megapolis". Strelka Mag.
- (11 September 2017). "Moscow, a City Undergoing Transformation". Planète Énergies.
- (8 August 2020). "RUSSIA: Severo-Zapadnyj Federal'nyj Okrug: Northwestern Federal District". City Population.de.
This article was imported from Wikipedia and is available under the Creative Commons Attribution-ShareAlike 4.0 License. Content has been adapted to SurfDoc format. Original contributors can be found on the article history page.
Ask Mako anything about Demographics of Russia — get instant answers, deeper analysis, and related topics.
Research with MakoFree with your Surf account
Create a free account to save articles, ask Mako questions, and organize your research.
Sign up freeThis content may have been generated or modified by AI. CloudSurf Software LLC is not responsible for the accuracy, completeness, or reliability of AI-generated content. Always verify important information from primary sources.
Report