From Surf Wiki (app.surf) — the open knowledge base
Demographics of Eritrea
none
none
| Field | Value |
|---|---|
| place | Eritrea |
| image | Flag of Eritrea.svg |
| alt | Flag of Eritrea |
| size_of_population | Estimates range between 3.6 million and 6.7 million Eritrea has never conducted an official government census. |
| growth | 1.03% (2022 est.) |
| birth | 27.04 births/1,000 population (2022 est.) |
| death | 6.69 deaths/1,000 population (2022 est.) |
| life | 66.85 years |
| life_male | 64.25 years |
| life_female | 69.53 years (2022 est.) |
| fertility | 3.58 children born/woman (2022 est.) |
| infant_mortality | 41.5 deaths/1,000 live births |
| age_65_years | 4% |
| age_0–14_years | 38.23% |
| total_mf_ratio | 0.97 male(s)/female (2022 est.) |
| sr_at_birth | 1.03 male(s)/female |
| sr_under_15 | 1.01 male(s)/female |
| nation | Eritrean |
| major_ethnic | Tigrinya, Tigre |
| minor_ethnic | Saho, Bilen, Beja, Kunama, Nara, Afar |
| spoken | Languages of Eritrea |
For the national origin group of Eritrea, see Eritreans.
-10.11 migrant(s)/1,000 population (2022 est.) | age_18–44_years = | age_45-64_years = | age_0–14_years =38.23% | age_15–64_years = | sr_15–64_years =
0.67 male(s)/female
Sources disagree as to the current population of Eritrea, with some proposing numbers as low as 3.6 million and others as high as 6.7 million. Eritrea has never conducted an official government census.
The nation has nine recognized ethnic groups. Of these, the largest is the Tigrinya, who make up around 50% of the population; the Tigre people, who also speak Semitic languages, constitute around 30% of residents. Most of the rest of the population belong to other Afro-Asiatic-speaking communities of the Cushitic branch. Additionally, there are a number of Nilo-Saharan-speaking ethnic minorities and other smaller groups.
The two most followed religions are Christianity (47%-63% of the total population) and Islam (52%).
Population
Sources disagree as to the current population of Eritrea, with UN DESA proposing a low estimate of 3.6 million for 2021 and the Common Market for Eastern and Southern Africa proposing a high estimate of 6.7 million for 2019. Eritrea has never conducted an official government census. In its 2019 data release, UN DESA described why its estimate was much lower than earlier estimates, stating, "The decrease is due to the availability of new official population estimates for several years (population count in 2000, official estimates up to 2018) that contribute to lower the size of the population in the recent years, as well as to revised past estimates since 1950."
In the 2010s, worsening conditions fueled migration pressure, with Eritreans trying to reach Europe illegally.Why they leave -- Eritreans are taking to the seas because of worsening conditions at home 12 October 2013. "Some 30,000 people reached Italy illegally in boats in the first nine months of 2013, three times as many as in the whole of 2012, according to Frontex, [...] the largest batch came from Eritrea, a country that has supposedly been at peace for the past 13 years." Emigration has left Eritrea ‘desolate’, say bishops, Catholic Herald, 6 September 2014. The UN Department of Economic and Social Affairs expects Eritrean population growth to accelerate to 1.8% per year from 2020 to 2030, vs. 1.1% per year from 2010 to 2020.
The proportion of children below the age of 15 in 2020 was 41.1%, 54.3% were between 15 and 65 years of age, while 4.5% were 65 or older.
| Population aged 0–14 (%) | Population aged 15–64 (%) | Population aged 65+ (%) |
|---|---|---|
| 1950 | 45.3 | 51.6 |
| 1960 | 43.4 | 53.9 |
| 1970 | 44.1 | 53.4 |
| 1980 | 44.3 | 53.1 |
| 1990 | 45.2 | 52.1 |
| 2000 | 45.7 | 50.4 |
| 2010 | 39.5 | 56.5 |
| 2020 | 41.1 | 54.3 |
Population Estimates by Sex and Age Group (1 July 2020) (Estimates based on the 2000 quick population count results and 1995, 2002 and 2010 Eritrea Demographic and Health Surveys.):
| Age group | Male | Female | Total | % | Age group | Male | Female | Total | Percent |
|---|---|---|---|---|---|---|---|---|---|
| Total | 1 704 531 | 1 760 057 | 3 464 588 | 100 | |||||
| 0–4 | 258 209 | 260 452 | 518 661 | 14.97 | |||||
| 5–9 | 226 081 | 229 410 | 455 492 | 13.15 | |||||
| 10–14 | 189 259 | 192 799 | 382 058 | 11.03 | |||||
| 15–19 | 156 082 | 159 332 | 315 413 | 9.10 | |||||
| 20–24 | 141 888 | 134 220 | 276 108 | 7.97 | |||||
| 25–29 | 166 664 | 158 295 | 324 959 | 9.38 | |||||
| 30–34 | 139 275 | 141 835 | 281 110 | 9.11 | |||||
| 35–39 | 103 079 | 103 347 | 206 427 | 5.96 | |||||
| 40–44 | 62 197 | 76 107 | 138 304 | 3.99 | |||||
| 45–49 | 60 159 | 77 960 | 138 119 | 3.99 | |||||
| 50–54 | 47 632 | 55 264 | 102 896 | 2.97 | |||||
| 55–59 | 39 491 | 50 117 | 89 607 | 2.59 | |||||
| 60–64 | 34 801 | 35 259 | 70 060 | 2.02 | |||||
| 65–69 | 28 019 | 28 134 | 56 153 | 1.62 | |||||
| 70–74 | 22 886 | 24 318 | 47 204 | 1.36 | |||||
| 75–79 | 14 576 | 18 574 | 33 150 | 0.96 | |||||
| 80–84 | 8 912 | 10 116 | 19 028 | 0.55 | |||||
| 85+ | 5 323 | 4 519 | 9 842 | 0.28 | |||||
| 0–14 | 673 549 | 682 661 | 1 356 210 | 39.14 | |||||
| 15–64 | 951 266 | 991 735 | 1 943 001 | 56.08 | |||||
| 65+ | 79 716 | 85 661 | 165 377 | 4.77 |
Vital statistics
Demographic and Health Surveys
The United Nations Department of Economic and Social Affairs (UN DESA) Population Division published its UN DESA 2019 Revision (World Population Prospects 2019) data release based on several data samples, including the 1995 and 2002 Demographic and Health Surveys (1995 DHS, 2002 DHS) and the 2010 Population and Health Survey (2010 PHS), since a full census had not been carried out in Eritrea .
The 1995 DHS survey was carried out in Eritrea by the Eritrean National Statistics Office (NSO) and Macro International Inc., collecting data by interviewing 5,054 women aged 15–49 and 1,114 men aged 15–59, chosen to be a statistically representative sample, from September 1995 to January 1996.
The 2002 DHS survey was carried out by the NSO (renamed as the National Statistics and Evaluation Office), with support from the United States Agency for International Development (USAID) and ORC Macro, collecting data with interviews of 8,754 women in Eritrea in the 15–49 age range, in what was considered to be a statistically representative sample of the full population. Key findings of the survey included a drop from 1995 to 2002 of fertility from 6.1 to 4.8 children per woman; improved knowledge of contraception; a drop in post-neonatal mortality; improved antenatal care; a doubling of the full vaccination rate for 12–23 month old babies from 41 to 76 percent; 38 percent of children under five years old were chronically malnourished or stunted; and near universal knowledge of HIV and AIDS.
In 2010, the NSO, supported by the Fafo Institute for Applied International Studies, published a Population and Health Survey (EPHS2010), based on a survey covering 34,423 households by choosing 900 areas around Eritrea, 525 rural and 375 urban, and randomly selecting 40 households in each cluster. Interviews aimed to include all women aged 15–49 and men aged 15–59 who were either residents or visitors in any selected household on the night preceding the interview. Key findings compared to the 1995 DHS survey included a decrease in early childhood mortality, increased children's vaccination, decreased maternal death, and a "wide gap between knowledge and use of family planning".
Fertility and mortality
| Period | Live births per 5 years | Deaths per 5 years | Natural change per 5 years | CBR* | CDR* | NC* | TFR* | IMR* |
|---|---|---|---|---|---|---|---|---|
| 1950–1955 | 204 000 | 128 000 | 76 000 | 47.5 | 29.7 | 17.7 | 6.96 | 199 |
| 1955–1960 | 233 000 | 128 000 | 105 000 | 48.8 | 26.8 | 22.0 | 6.96 | 181 |
| 1960–1965 | 261 000 | 127 000 | 134 000 | 48.4 | 23.6 | 24.8 | 6.82 | 160 |
| 1965–1970 | 291 000 | 133 000 | 158 000 | 47.4 | 21.7 | 25.7 | 6.70 | 148 |
| 1970–1975 | 324 000 | 140 000 | 184 000 | 46.0 | 19.8 | 26.2 | 6.62 | 140 |
| 1975–1980 | 366 000 | 148 000 | 218 000 | 45.3 | 18.3 | 27.9 | 6.62 | 132 |
| 1980–1985 | 422 000 | 161 000 | 261 000 | 45.2 | 17.3 | 27.7 | 6.70 | 121 |
| 1985–1990 | 469 000 | 174 000 | 295 000 | 44.0 | 16.4 | 23.3 | 6.6 | 112 |
| 1990–1995 | 428 000 | 168 000 | 260 000 | 38.4 | 15.1 | 19.4 | 6.3 | 94.4 |
| 1995–2000 | 359 000 | 140 000 | 219 000 | 31.9 | 12.5 | 24.0 | 5.6 | 71.1 |
| 2000–2005 | 442 000 | 135 000 | 307 000 | 34.6 | 10.6 | 28.3 | 5.1 | 59.4 |
| 2005–2010 | 564 000 | 140 000 | 424 000 | 37.6 | 9.4 | 28.3 | 4.8 | 51.6 |
| 2010–2015 | 552 000 | 134 000 | 418 000 | 33.9 | 8.2 | 25.7 | 4.35 | 45.0 |
| 2015–2020 | 528 000 | 125 000 | 403 000 | 30.6 | 7.2 | 23.4 | 4.1 | 34.7 |
| * Values per year: CBR = crude birth rate (per 1000); CDR = crude death rate (per 1000); NC = natural change (per 1000); IMR = infant mortality rate per 1000 births; TFR = total fertility rate (number of children per woman) |
Urban/rural and geographical distribution
Total Fertility Rate (TFR) (Wanted Fertility Rate) and Crude Birth Rate (CBR) (1995 DHS, Table 3.1; 2002 DHS, Table 4.1;)
| Year | Total | Urban | Rural | CBR | TFR | CBR | TFR | CBR | TFR |
|---|---|---|---|---|---|---|---|---|---|
| 1995 | 37.5 | 6.10 | 29.3 | 4.23 | 40.3 | 6.99 | |||
| 2002 | 32 | 4.8 | 28 | 3.5 | 35 | 5.7 |
Fertility geographical distribution as of 2010 (PHS, Table 4–2):
| Zoba | Total fertility rate | Mean number of children ever born to women age 40–49 | Percentage of women age 15-49 currently pregnant |
|---|---|---|---|
| Debubawi Keih Bahri | 4.2 | 5.4 | 7.6 |
| Maekel | 3.4 | 4.1 | 5.5 |
| Semenawi Keih Bahri | 5.4 | 5.9 | 8.1 |
| Anseba | 5.7 | 6.3 | 8.2 |
| Gash-Barka | 5.4 | 5.6 | 8.0 |
| Debub | 5.0 | 6.0 | 7.9 |
Life expectancy
| Period | Life expectancy in |
|---|---|
| Years | |
| 1950–1955 | 34.08 |
| 1955–1960 | 36.68 |
| 1960–1965 | 40.08 |
| 1965–1970 | 42.15 |
| 1970–1975 | 44.11 |
| 1975–1980 | 45.91 |
| 1980–1985 | 47.33 |
| 1985–1990 | 48.69 |
| 1990–1995 | 50.77 |
| 1995–2000 | 53.97 |
| 2000–2005 | 56.70 |
| 2005–2010 | 60.71 |
| 2010–2015 | 63.42 |
| 2015–2020 | 65.74 |
Migration
- Revision 2010
- Revision 2015
- Revision 2019 In 2015, there was a major outflow of emigrants from Eritrea. The Guardian attributed the emigration to Eritrea being "a totalitarian state where most citizens fear arrest at any moment and dare not speak to their neighbours, gather in groups or linger long outside their homes", with a major factor being the conditions and long durations of conscription in the Eritrean Army. At the end of 2018, the United Nations High Commissioner for Refugees (UNHCR) estimated that about 507,300 Eritreans were refugees who had fled Eritrea. Factors corresponding to emigration include the "lack of political, religious and social freedom", economic reasons and indefinite military service. Young people choosing to flee Eritrea often keep their plans secret from their families in order to decrease their families' stress and risk of being fined or imprisoned. Payment to people smugglers is typically made when a refugee arrives in Libya and provides the smugglers with a telephone number of a diaspora contact who is expected to pay. Several refugees given educational opportunities while residing in refugee camps in Ethiopia felt that they lacked long-term life opportunities beyond obtaining academic degrees, motivating them to attempt further emigration to Europe.
During the first four half decades of the twenty-first century, UN DESA Population Division, in its 2019 Revision of World Population Prospects, estimated that Eritrea had 227 thousand more immigrants than emigrants during 2000–2005 (more people arrived than left), and had net outflows afterwards, with 80 thousand net emigrants during 2005–2010, 246 thousand during 2010–2015 and 199 thousand during 2015–2020.
Ethno-linguistic groups
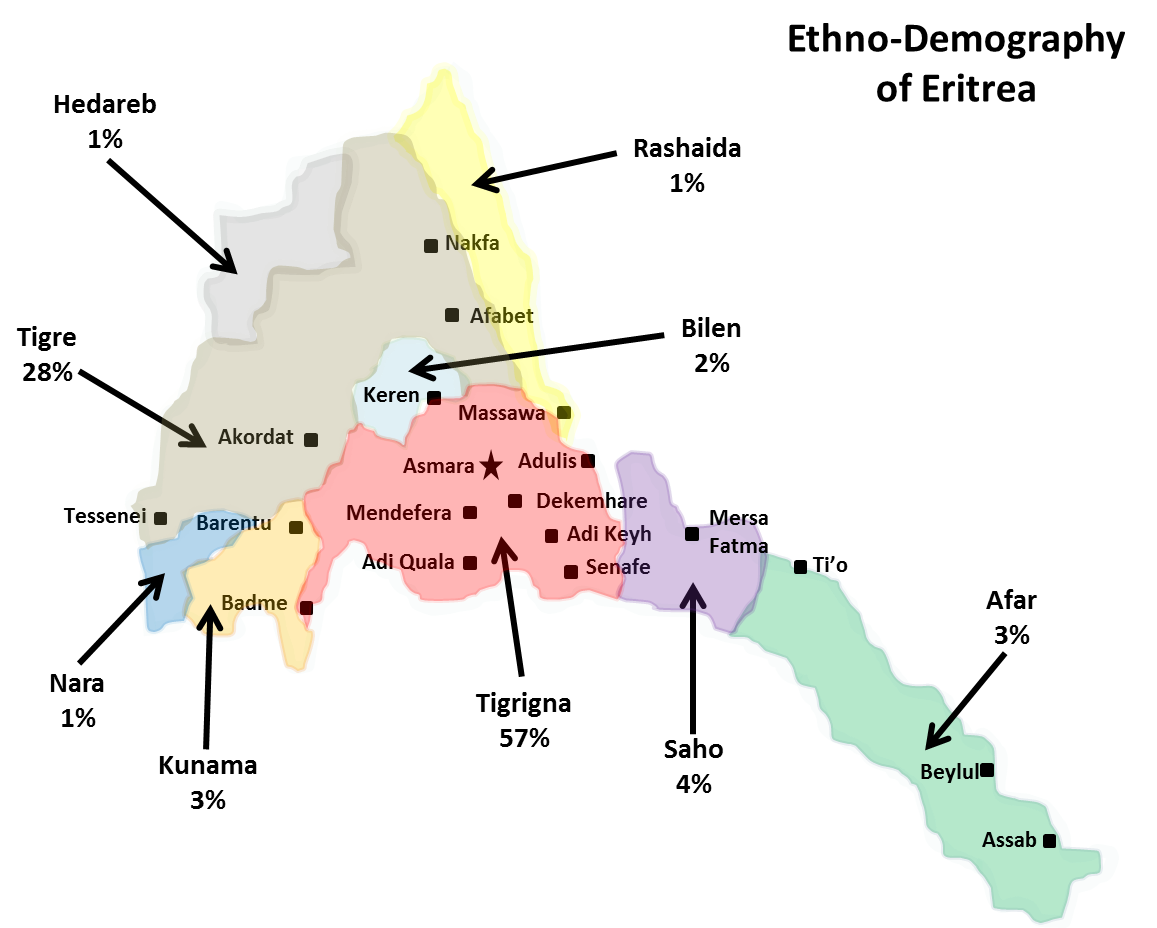
Eritrea's population comprises nine recognized ethnic groups, most of whom speak languages from the Ethiopian Semitic branch of the Afro-Asiatic family. The East African Semitic languages spoken in Eritrea are Tigre, Tigrinya, and the newly recognized Dahlik. Other Afro-Asiatic languages belonging to the Cushitic branch are also widely spoken in the country. The latter include Afar, Beja, Blin, and Saho.
In addition, languages belonging to the Nilo-Saharan language family (Kunama and Nara) are spoken as a mother tongue by the Kunama and Nara Nilotic ethnic minorities that live in the north and northwestern part of the country. The Rashaida speak Arabic, while there are also a number of Italians who speak their native Italian language.
Afro-Asiatic communities
Semitic speakers
Tigrinya
Main article: Tigrinya people
The majority of the Tigrinya inhabit the highlands of Eritrea; however, migration to other parts of the country has occurred. Their language is called Tigrinya. They are the largest ethnic group in the country, constituting about 50% of the population. The predominantly Tigrinya populated urban centers in Eritrea are the capital Asmara, Mendefera, Dekemhare, Adi Keyh, Adi Quala and Senafe, while there is a significant population of Tigrinya in other cities including Keren, and Massawa. They are 92% Christians, (of which 90% are of the Eritrean Orthodox faith, 5% Roman Catholic and Eastern Catholic (whose mass is held in Ge'ez as opposed to Latin), and 5% belonging to various Protestant and other Christian denominations, the majority of which belong to the (Lutheran) Evangelical Church of Eritrea).
Tigre
Main article: Tigre people
The Tigre reside in the western lowlands in Eritrea. Many also migrated to Sudan at the time of the Ethiopian-Eritrean conflict and lived there since. They are a nomadic and pastoralist people, related to the Tigrinya and to the Beja people. They are a predominantly Muslim nomadic people who inhabit the northern, western, and coastal lowlands of Eritrea, and constitute 30% of the country's population. Some also inhabit areas in eastern Sudan. 95% of the Tigre people adhere to the Islamic religion Sunni Islam, but there are a small number of Christians among them as well (often referred to as the Mensaï in Eritrea). Their language is called Tigre.
Rashaida
Main article: Rashaida people
The Rashaida are one of Eritrea's nine recognized ethnic groups. They represent around 1% of the population of Eritrea. The Rashaida reside in the northern coastal lowlands of Eritrea and the northern eastern coasts of Sudan. They are predominantly Muslim and are the only ethnic group in Eritrea to have Arabic as their communal language, specifically the Hejazi dialect. The Rashaida first came to Eritrea in the 19th century from the Arabian Coast.
Jeberti
The Jeberti people in Eritrea trace descent from early Muslim adherents. The term Jeberti is also locally sometimes used to generically refer to all Islamic inhabitants of the highlands. The Jeberti in Eritrea speak Arabic and Tigrinya. They account for about 8% of the Tigrinya speakers in the nation.
Cushitic speakers
Afar
Main article: Afar people
According to the CIA, the Afar constitute 4% of the nation's population. They live in the Debubawi Keyih Bahri Region of Eritrea, as well as the Afar Region in Ethiopia, and Djibouti. They speak the Afar language as a mother tongue, and are predominantly Muslim. Afars in Eritrea number about 600,000 individuals, the smallest population out of the countries they reside in. In Djibouti, there are about 780,000 group members, and in Ethiopia, they number approximately 2,100,000.
Saho
Main article: Saho people
The Saho represent 4% of Eritrea's population. They principally reside in the Debubawi Keyih Bahri Region and the Northern Red Sea Region of Eritrea. Their language is called Saho. They are predominantly Muslim, although a few Christians known as the Irob live in the Debub region of Eritrea and the Tigray region of Ethiopia.
Bilen
Main article: Bilen people
The Bilen in Eritrea represent around 3% of the country's population. They are primarily concentrated in the north-central areas, in and around the city of Keren, and south towards Asmara, the nation's capital. Many of them entered Eritrea from Kush (central Sudan) in the 8th century and settled at Merara, after which they went to Wag and Lasta. The Bilen then returned to Axum in Ethiopia's Tigray Province, and battled with the natives; in the resulting aftermath, the Bilen returned to their main base at Merara. The Bilen include adherents of both Islam and Christianity. They speak the Bilen language as a mother tongue. Christian adherents are mainly urban and have interbred with the Tigrinya who live in the area. Muslim adherents are mainly rural and have intermingled with the adjacent Tigre.
Beja
Main article: Beja people
The Beja in Eritrea, or Hedareb, constitute 2% of local residents. They mainly live along the north-western border with Sudan. Group members are predominantly Muslim and communicate in Beja as a first or second language. The Beja also include the Beni-Amer people, who have retained their native Beja language alongside Hedareb.
Nilo-Saharan communities
Kunama
Main article: Kunama people
According to the CIA, the Kunama constitute around 4% of Eritrea's population. They mainly live in the country's Gash Barka Region, as well as in adjacent parts of Ethiopia's Tigray Region. Many of them reside in the contested border village of Badme. Their language is called Kunama. Although some Kunama still practice traditional beliefs, most are converts to either Christianity (Roman Catholic and Protestant) or Islam.
Nara
Main article: Nara people
The Nara represent 2% of the nation's population. They principally reside along the south-western border with Sudan and Ethiopia. They are generally Muslim, with a few Christians and some practising their indigenous beliefs. Their language is called Nara.
Other communities
Italians
Main article: Italian Eritreans
A few monolingual Italian Eritreans remain. As of 2008, they were estimated at 900 people, down from around 38,000 residents at the end of World War II.
Languages
:Afar, Arabic (spoken by the Rashaida), Beja (spoken by the Hedareb), Blin, Kunama, Nara, Saho, Tigre, Tigrinya, as a second language. English, Italian and Arabic are the foremost second languages.
Religion
Main article: Religion in Eritrea
File:Regions of Eritrea.svg|thumb|Regions of Eritrea 1. Maekel 2. Anseba 3. Gash-Barka 4. Debub 5. Northern Red Sea 6. Southern Red Sea poly 167 182 163 205 179 211 184 203 176 179 Maekel Region poly 167 182 176 179 118 108 118 50 59 85 53 133 Anseba Region poly 163 205 167 182 53 133 19 258 91 276 135 239 147 206 Gash-Barka Region poly 184 203 179 211 147 206 135 239 153 254 221 248 225 226 189 200 Debub region poly 176 179 184 203 189 200 225 226 221 248 271 259 279 220 200 159 155 21 118 50 118 108 Northern Red Sea Region poly 279 220 271 259 419 388 442 361 319 241 Southern Red Sea Region People in Eritrea practice various religions. According to the Pew Research Center (2010), 62.9% of the population are Christian, mostly followers of Eritrean Orthodox Tewahdo, and to a lesser extent, Roman Catholicism, with the second-largest religion being Muslims. In general, most local residents who adhere to Christianity live in the Maekel and Debub regions, whereas those who follow Islam predominantly inhabit the Anseba, Northern Red Sea, Southern Red Sea and Gash-Barka regions. A few adherents of traditional faiths can also be found, particularly in the lowlands.
| editor-first1=Mark | editor-last1=Juergensmeyer | editor-first2=Wade Clark | editor-last2=Roof | encyclopedia=Encyclopedia of Global Religion | publisher=SAGE Publishing | location=Los Angeles | date=2011 | isbn=978-0-7619-2729-7 | article=Eritrea | first=Becky | last= Hsu | pages=354–355 | url=https://books.google.com/books?id=WwJzAwAAQBAJ&q=eritrea | access-date=2020-10-22 | via=Google Books}} | Christians | Muslims | Other |
|---|---|---|---|---|---|---|---|---|---|---|---|---|---|---|---|---|---|---|
| Maekel Region, *ዞባ ማእከል* | ||||||||||||||||||
| Debub region, *ዞባ ደቡብ* | {{percentage bar | 1 | ||||||||||||||||
| Gash-Barka Region, *ዞባ ጋሽ ባርካ* | ||||||||||||||||||
| Anseba Region, *ዞባ ዓንሰባ* | {{percentage bar | 1 | ||||||||||||||||
| Northern Red Sea Region, | ||||||||||||||||||
| *Semienawi Keyih Bahri ዞባ ሰሜናዊ ቀይሕ ባሕሪ* | ||||||||||||||||||
| Southern Red Sea Region, | ||||||||||||||||||
| *Debubawi Keyih Bahri ዞባ ደቡባዊ ቀይሕ ባሕሪ* | {{percentage bar | 1 |
References
.
Attribution:
References
- Minahan, James. (1998). "Miniature empires: a historical dictionary of the newly independent states". Greenwood Publishing Group.
- (2015-04-02). "Religious Composition by Country, 2010-2050".
- "Eritrea".
- "Eritrea".
- [http://www.worldbank.org/prospects/migrationandremittances Bilateral Estimates of Migrant Stocks in 2010] estimates 942,000 emigrants, of whom 450,000 migrated to [[Sudan]] and 290,000 to [[Ethiopia]]. Cf. the World' Bank's [http://siteresources.worldbank.org/INTLAC/Resources/Factbook2011-Ebook.pdf Migration and Remittances Factbook 2011].
- "World Population Prospects 2019, custom data acquired via website.".
- "UNSD — Demographic and Social Statistics".
- "MEASURE DHS: Demographic and Health Surveys".
- (2023-02-09). "The World Factbook".
- Alders, Anne. "the Rashaida".
- Kifleyesus, Abbebe. (January 2009). "Jeberti Women Traders' Innumeracy: Its Impact on Commercial Activity in Eritrea". L'Homme: Revue française d'anthropologie.
- Facts On File, Incorporated. (2009). "Encyclopedia of the Peoples of Africa and the Middle East". Infobase Publishing.
- (19 December 2011). "Table: Christian Population as Percentages of Total Population by Country". Pew Research Center's Religion & Public Life Project.
- {{Cite encyclopedia. [[SAGE Publishing]]. (2011). Becky. Hsu. link
- (2019). "World Population Prospects 2019".
- (2019). "Eritrea – Indicators – Population (million people), 2018".
- (2019). "File MORT/3-1: Deaths (both sexes combined) by region, subregion and country, 1950-2100 (thousands)".
- (2019). "File FERT/1: Births (both sexes combined) by region, subregion and country, 1950-2100 (thousands)".
- (2019). "File FERT/3: Crude birth rate by region, subregion and country, 1950-2100 (births per 1,000 population)".
- (2019). "File FERT/4: Total fertility by region, subregion and country, 1950-2100 (live births per woman)".
- (2019). "File POP/3: Rate of natural increase by region, subregion and country, 1950-2100 (per 1,000 population)".
- (2019). "File MORT/2: Crude death rate by region, subregion and country, 1950-2100 (deaths per 1,000 population)".
- (2019). "File MORT/1-1: Infant mortality rate (both sexes combined) by region, subregion and country, 1950-2100 (infant deaths per 1,000 live births)".
- (2019). "File MORT/7-1: Life expectancy at birth (both sexes combined) by region, subregion and country, 1950-2100 (years)".
- (2019). "Population Division – World Population Prospects 2019 – Data Sources".
- (2003-06-16). "Eritrea – 2002 Demographic and Health Survey – Key Findings".
- (2001-01-29). "Eritrea – Demographic and Health Survey 1995".
- (2003-06-02). "Eritrea – Demographic and Health Survey 2002".
- (2010). "Eritrea – Population and Health Survey 2010".
- (2015-07-15). "It's not at war, but up to 3% of its people have fled. What is going on in Eritrea?". [[The Guardian]].
- (2020). "Eritrea – events of 2019".
- (2019). "File MIGR/2: Net number of migrants (both sexes combined) by region, subregion and country, 1950-2100 (thousands)".
- (2019). "File MIGR/2: Net number of migrants (both sexes combined) by region, subregion and country, 1950-2100 (thousands)".
- (2017). "File MIGR/2: Net number of migrants (both sexes combined) by region, subregion and country, 1950-2100 (thousands)".
- (2015). "File MIGR/2: Net number of migrants (both sexes combined) by major area, region and country, 1950-2100 (thousands)".
- (2013). "File MIGR/2: Net number of migrants (both sexes combined) by major area, region and country, 1950-2100 (thousands)".
- (2011). "File 19: Net number of migrants (both sexes combined) by major area, region and country, 1950-2100 (thousands)".
- (2019-07-22). "I asked young Eritreans why they risk migration. This is what they told me".
- (2021-02-28). "Why Eritrean refugees choose the risky migration to Europe".
- (2019-08-28). "World Population Prospect 2019: release note about major differences in total population estimates for mid-2019 between 2017 and 2019 revisions".
This article was imported from Wikipedia and is available under the Creative Commons Attribution-ShareAlike 4.0 License. Content has been adapted to SurfDoc format. Original contributors can be found on the article history page.
Ask Mako anything about Demographics of Eritrea — get instant answers, deeper analysis, and related topics.
Research with MakoFree with your Surf account
Create a free account to save articles, ask Mako questions, and organize your research.
Sign up freeThis content may have been generated or modified by AI. CloudSurf Software LLC is not responsible for the accuracy, completeness, or reliability of AI-generated content. Always verify important information from primary sources.
Report