From Surf Wiki (app.surf) — the open knowledge base
Atmospheric methane
Methane (CH4) in Earth's atmosphere

Methane (CH4) in Earth's atmosphere
Since the beginning of the Industrial Revolution (around 1750), the methane concentration in the atmosphere has increased by about 160%, and human activities almost entirely caused this increase. Since 1750 methane has contributed 3% of greenhouse gas (GHG) emissions in terms of mass but is responsible for approximately 23% of radiative or climate forcing. By 2019, global methane concentrations had risen from 722 parts per billion (ppb) in pre-industrial times to 1866 ppb. This is an increase by a factor of 2.6 and the highest value in at least 800,000 years.
Methane increases the amount of ozone (O3) in the troposphere (4 mi to 12 mi from the Earth's surface) and also in the stratosphere (from the troposphere to 31 mi above the Earth's surface). Both water vapour and ozone are GHGs, which in turn add to climate warming.
Role in climate change
Methane in Earth.27s atmosphere Methane as a greenhouse gas


Radiative or climate forcing is the scientific concept used to measure the human impact on the environment in watts per square meter (W/m2). It refers to the "difference between solar irradiance absorbed by the Earth and energy radiated back to space" The direct radiative greenhouse gas forcing effect of methane was estimated to be an increase of 0.5 W/m2 relative to the year 1750 (estimate in 2007).
In their 2021 "Global Methane Assessment" report, the UNEP and CCAC said that their "understanding of methane's effect on radiative forcing" improved with research by teams led by M. Etminan in 2016, and William Collins in 2018. This resulted in an "upward revision" since the 2014 IPCC Fifth Assessment Report (AR5). The "improved understanding" says that prior estimates of the "overall societal impact of methane emissions" were likely underestimated.
Etminan et al. published their new calculations for methane's radiative forcing (RF) in a 2016 Geophysical Research Letters journal article which incorporated the shortwave bands of CH4 in measuring forcing, not used in previous, simpler IPCC methods. Their new RF calculations which significantly revised those cited in earlier, successive IPCC reports for well mixed greenhouse gases (WMGHG) forcings by including the shortwave forcing component due to CH4, resulted in estimates that were approximately 20–25% higher. Collins et al. said that CH4 mitigation that reduces atmospheric methane by the end of the century, could "make a substantial difference to the feasibility of achieving the Paris climate targets", and would provide us with more "allowable carbon emissions to 2100".
In addition to the direct heating effect and the normal feedbacks, the methane breaks down to carbon dioxide and water. This water is often above the tropopause, where little water usually reaches. Ramanathan (1998) notes that both water and ice clouds, when formed at cold lower stratospheric temperatures, are extremely efficient in enhancing the atmospheric greenhouse effect. He also notes that there is a distinct possibility that large increases in methane in future may lead to a surface warming that increases nonlinearly with the methane concentration.
Mitigation efforts to reduce short-lived climate pollutants like methane and black carbon would help combat "near-term climate change" and would support Sustainable Development Goals.
Sources

- OWID cites: Jones, Matthew W., Glen P. Peters, Thomas Gasser, Robbie M. Andrew, Clemens Schwingshackl, Johannes Gütschow, Richard A. Houghton, Pierre Friedlingstein, Julia Pongratz, and Corinne Le Quéré. “National Contributions to Climate Change Due to Historical Emissions of Carbon Dioxide, Methane and Nitrous Oxide”. Scientific Data. Zenodo, November 13, 2024. https://doi.org/10.5281/zenodo.14054503.]] thumb|upright=1.35|Main sources of global methane emissions (2008–2017) according to the [[Global Carbon Project]]|right Any process that results in the production of methane and its release into the atmosphere can be considered a "source". The known sources of methane are predominantly located near the Earth's surface. Two main processes that are responsible for methane production include microorganisms anaerobically converting organic compounds into methane (methanogenesis), which are widespread in aquatic ecosystems, and ruminant animals.
Methane is also released in the Arctic for example from thawing permafrost.
Measurement techniques
Methane was typically measured using gas chromatography. Gas chromatography is a type of chromatography used for separating or analyzing chemical compounds. It is less expensive in general, compared to more advanced methods, but it is more time and labor-intensive.
Spectroscopic methods were the preferred method for atmospheric gas measurements due to its sensitivity and precision. Also, spectroscopic methods are the only way of remotely sensing the atmospheric gases. Infrared spectroscopy covers a large spectrum of techniques, one of which detects gases based on absorption spectroscopy. There are various methods for spectroscopic methods, including Differential optical absorption spectroscopy, laser-induced fluorescence, and Fourier-transform infrared.
In 2011, cavity ring-down spectroscopy was the most widely used IR absorption technique of detecting methane. It is a form of laser absorption spectroscopy which determines the mole fraction to the order of parts per trillion.
Global monitoring

thumb|upright=1.35|Methane concentration at NOAA's Mauna Loa observatory through July 2021: A record-high of 1912 ppb was reached in December 2020.CH4 has been measured directly in the environment since the 1970s. The Earth's atmospheric methane concentration has increased 160% since preindustrial levels in the mid-18th century.
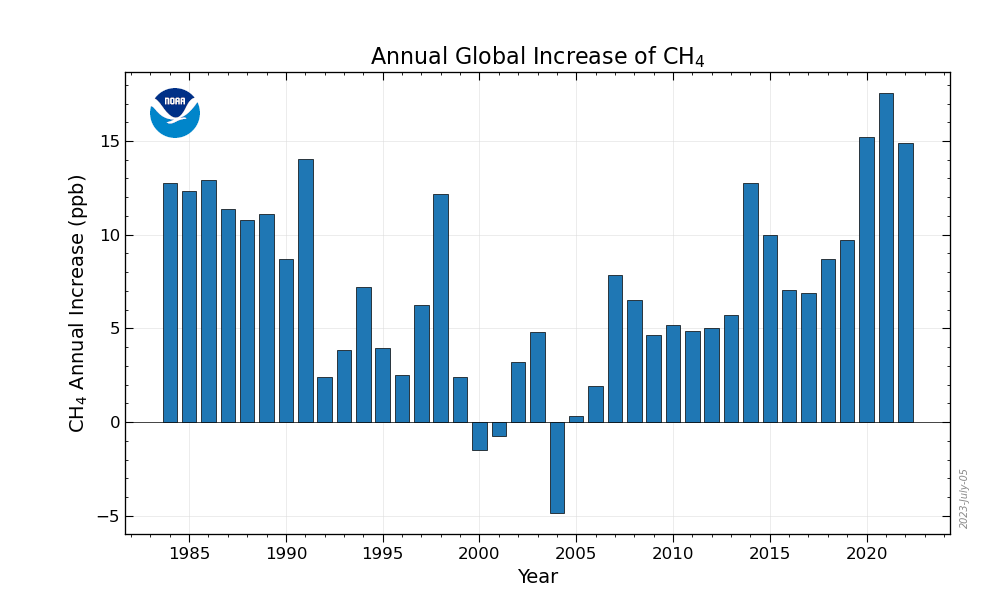
Long term atmospheric measurements of methane by NOAA show that the build up of methane nearly tripled since pre-industrial times since 1750. In 1991 and 1998 there was a sudden growth rate of methane representing a doubling of growth rates in previous years. The June 15, 1991 eruption of Mount Pinatubo, measuring VEI-6was the second-largest terrestrial eruption of the 20th century. In 2007 it was reported that unprecedented warm temperatures in 1998the warmest year since surface records were recordedcould have induced elevated methane emissions, along with an increase in wetland and rice field emissions and the amount of biomass burning.
Data from 2007 suggested methane concentrations were beginning to rise again. This was confirmed in 2010 when a study showed methane levels were on the rise for the 3 years 2007 to 2009. After a decade of near-zero growth in methane levels, "globally averaged atmospheric methane increased by [approximately] 7 nmol/mol per year during 2007 and 2008. During the first half of 2009, globally averaged atmospheric CH4 was [approximately] 7 nmol/mol greater than it was in 2008, suggesting that the increase will continue in 2009." From 2015 to 2019 sharp rises in levels of atmospheric methane have been recorded.
In 2010, methane levels in the Arctic were measured at 1850 nmol/mol which is over twice as high as at any time in the last 400,000 years. According to the IPCC AR5, since 2011 concentrations continued to increase. After 2014, the increase accelerated and by 2017, it reached 1,850 parts per billion (ppb). The annual average for methane (CH4) was 1866 ppb in 2019 and scientists reported with "very high confidence" that concentrations of CH4 were higher than at any time in at least 800,000 years. The largest annual increase occurred in 2021 with current concentrations reaching a record 260% of pre-industrialwith the overwhelming percentage caused by human activity.
Since 2006, atmospheric methane concentrations have risen, while the global average δ¹³C–CH₄ value has shown a gradual decline. Based on this, the National Oceanic and Atmospheric Administration (NOAA) concluded that the recent methane growth primarily originated from microbial emissions with lighter isotopes such as wetland and agricultural emissions, rather than increased thermal or combustion sources (e.g., fossil fuels).
However, this conclusion is not universally accepted. Changes in isotopes and sinks, such as OH (hydroxyl radicals), indicate that the recent atmospheric methane growth is not dominantly driven by fossil fuels. However, isotopic changes reflect the combined effects of sources and sinks of methane. Thus, the atmospheric δ¹³C–CH₄ evolution can be influenced by multiple factors. Lighter δ¹³C values only indicate relatively greater microbial sources; therefore, they cannot directly rule out concurrent increases in fossil fuel emissions. Several recent inversion models show that emissions from fossil fuels, agriculture, and waste (for example, landfills, manure management and wastewater treatment) can each account for roughly half of the atmospheric increase, with anthropogenic sources (agriculture + fossil fuels) dominating the overall increase. In addition, substantial uncertainties exist in both the δ¹³C–CH₄ isotopic fingerprint of sources and the emission estimates themselves, rendering source apportionment results sensitive to prior assumptions. Overall, this is a subject that remains open to scientific debate.
In 2013, IPCC scientists said with "very high confidence", that concentrations of atmospheric methane CH4 "exceeded the pre-industrial levels by about 150% which represented "levels unprecedented in at least the last 800,000 years." The globally averaged concentration of methane in Earth's atmosphere increased by about 150% from 722 ± 25 ppb in 1750 to 1803.1 ± 0.6 ppb in 2011. As of 2016, methane contributed radiative forcing of 0.62 ± 14% Wm−2, or about 20% of the total radiative forcing from all of the long-lived and globally mixed greenhouse gases. The atmospheric methane concentration has continued to increase since 2011 to an average global concentration of 1911.8 ± 0.6 ppb as of 2022. The May 2021 peak was 1891.6 ppb, while the April 2022 peak was 1909.4 ppb, a 0.9% increase.
The Global Carbon Project consortium produces the Global Methane Budget. Working with over fifty international research institutions and 100 stations globally, it updates the methane budget every few years.
In 2013, the balance between sources and sinks of methane was not yet fully understood. Scientists were unable to explain why the atmospheric concentration of methane had temporarily ceased to increase.
The focus on the role of methane in anthropogenic climate change has become more relevant since the mid-2010s.
Natural sinks or removal of atmospheric methane
The amount of methane in the atmosphere is the result of a balance between the production of methane on the Earth's surfaceits sourceand the destruction or removal of methane, mainly in the atmosphereits sink in an atmospheric chemical process. Since methane oxidation consumes OH (hydroxyl radicals), higher methane concentrations can reduce global mean OH levels and slightly increase methane's atmospheric lifetime (originally approximately 9 years). This creates a positive feedback between methane sources and sinks that is explicitly considered in contemporary atmospheric chemistry–climate studies.
Carbon isotope analysis allows scientists to identify the source of the carbon in a methane sample by carefully measuring the ratio of the most common form of carbon, carbon-12, and its stable isotope, carbon-13 (13C), which has one extra neutron and is thus heavier. That means 13C is ever so slightly heavier than 12C. By analyzing the isotopic composition of methane in the atmosphere, it is possible to distinguish between microbial, thermal, and combustion sources of methane in atmospheric observations and inversion models.
Another major natural sink is through oxidation by methanotrophic or methane-consuming bacteria in Earth's soils.
thumb|upright=1.8|left|NASA computer models from 2005, calculated based on information available at that time, show the amount of methane (parts per million by volume) at the surface (top) and in the stratosphere (bottom).These 2005 NASA computer model simulationscalculated based on data available at that timeillustrate how methane is destroyed as it rises. As air rises in the tropics, methane is carried upwards through the tropospherethe lowest portion of Earth's atmosphere which is 4 mi to 12 mi from the Earth's surface, into the lower stratospherethe ozone layerand then the upper portion of the stratosphere.
This atmospheric chemical process is the most effective methane sink, as it removes 90% of atmospheric methane. This global destruction of atmospheric methane mainly occurs in the troposphere.
Methane molecules react with hydroxyl radicals (OH)the "major chemical scavenger in the troposphere" that "controls the atmospheric lifetime of most gases in the troposphere". Through this CH4 oxidation process, atmospheric methane is destroyed and water vapor and carbon dioxide are produced.
While this decreases the concentration of methane in the atmosphere, it is unclear if this leads to a net positive increase in radiative forcing because both water vapor and carbon dioxide are more powerful GHGs factors in terms of affecting the warming of Earth.
This additional water vapor in the stratosphere caused by CH4 oxidation, adds approximately 15% to methane's radiative forcing effect.
By the 1980s, the global warming problem had been transformed by the inclusion of methane and other non-CO2 trace-gasesCFCs, N2O, and O3 on global warming, instead of focusing primarily on carbon dioxide. Both water and ice clouds, when formed at cold lower stratospheric temperatures, have a significant impact by increasing the atmospheric greenhouse effect. Large increases in future methane could lead to a surface warming that increases nonlinearly with the methane concentration.
Methane also affects the degradation of the ozone layerthe lowest layer of the stratosphere from about 15 to above Earth, just above the troposphere. NASA researchers in 2001, had said that this process was enhanced by global warming, because warmer air holds more water vapor than colder air, so the amount of water vapor in the atmosphere increases as it is warmed by the greenhouse effect. Their climate models based on data available at that time, had indicated that carbon dioxide and methane enhanced the transport of water into the stratosphere.
Atmospheric methane could last about 120 years in the stratosphere until it is eventually destroyed through the hydroxyl radicals oxidation process.
Mean lifespan

There are different ways to quantify the period of time that methane impacts the atmosphere. The average time that a physical methane molecule is in the atmosphere is estimated to be around 9.6 years. However, the average time that the atmosphere will be affected by the emission of that molecule before reaching equilibrium – known as its 'perturbation lifetime' – is approximately twelve years.
The reaction of methane and chlorine atoms acts as a primary sink of Cl atoms and is a primary source of hydrochloric acid (HCl) in the stratosphere.
CH4 + Cl → CH3 + HCl
The HCl produced in this reaction leads to catalytic ozone destruction in the stratosphere.
Methanotrophs in soils and sediments
Soils act as a major sink for atmospheric methane through the methanotrophic bacteria that reside within them. This occurs with two different types of bacteria. "High capacity-low affinity" methanotrophic bacteria grow in areas of high methane concentration, such as waterlogged soils in wetlands and other moist environments. And in areas of low methane concentration, "low capacity-high affinity" methanotrophic bacteria make use of the methane in the atmosphere to grow, rather than relying on methane in their immediate environment. Methane oxidation allows methanotrophic bacteria to use methane as a source of energy, reacting methane with oxygen and as a result producing carbon dioxide and water.
: CH4 + 2O2 → CO2 + 2H2O
Forest soils act as good sinks for atmospheric methane because soils are optimally moist for methanotroph activity, and the movement of gases between soil and atmosphere (soil diffusivity) is high. With a lower water table, any methane in the soil has to make it past the methanotrophic bacteria before it can reach the atmosphere. Wetland soils, however, are often sources of atmospheric methane rather than sinks because the water table is much higher, and the methane can be diffused fairly easily into the air without having to compete with the soil's methanotrophs.
Methanotrophic bacteria also occur in the underwater sediments. Their presence can often efficiently limit emissions from sources such as the underwater permafrost in areas like the Laptev Sea.
Removal technologies
Methane concentrations in the geologic past
left |upright=1.35|thumb|Compilation of [[paleoclimatology]] data of methaneFrom 1996 to 2004, researchers in the European Project for Ice Coring in Antarctica (EPICA) project were able to drill and analyze gases trapped in the ice cores in Antarctica to reconstruct GHG concentrations in the atmosphere over the past 800,000 years". They found that prior to approximately 900,000 years ago, the cycle of ice ages followed by relatively short warm periods lasted about 40,000 years, but by 800,000 years ago the time interval changed dramatically to cycles that lasted 100,000 years. There were low values of GHG in ice ages, and high values during the warm periods.
This 2016 EPA illustration above is a compilation of paleoclimatology showing methane concentrations over time based on analysis of gas bubbles from EPICA Dome C, Antarcticaapproximately 797,446 BCE to 1937 CE, Law Dome, Antarcticaapproximately 1008 CE to 1980 CE Cape Grim, Australia1985 CE to 2015 CE Mauna Loa, Hawaii1984 CE to 2015 CE and Shetland Islands, Scotland: 1993 CE to 2001 CE.

In 2001, NASA's Goddard Institute for Space Studies and Columbia University's Center for Climate Systems Research scientists confirmed that other greenhouse gases apart from carbon dioxide were important factors in climate change in research presented at the annual meeting of the American Geophysical Union (AGU). They offered a theory on the 100,000-year long Paleocene–Eocene Thermal Maximum that occurred approximately 55 million years ago. They posited that there was a vast release of methane that had previously been kept stable through "cold temperatures and high pressure...beneath the ocean floor". This methane release into the atmosphere resulted in the warming of the earth. A 2009 journal article in Science, confirmed NASA research that the contribution of methane to global warming had previously been underestimated.
Early in the Earth's history carbon dioxide and methane likely produced a greenhouse effect. The carbon dioxide would have been produced by volcanoes and the methane by early microbes. During this time, Earth's earliest life appeared. According to a 2003 article in the journal Geology, these first, ancient bacteria added to the methane concentration by converting hydrogen and carbon dioxide into methane and water. Oxygen did not become a major part of the atmosphere until photosynthetic organisms evolved later in Earth's history. With no oxygen, methane stayed in the atmosphere longer and at higher concentrations than it does today.
References
References
- "Methane - Earth Indicator / Atmospheric Methane Concentrations since 1984". National Aeronautics and Space Administration (NASA).
- (December 12, 2016). "The Global Methane Budget 2000–2012". Earth System Science Data.
- "Climate Change 2021. The Physical Science Basis. Summary for Policymakers. Working Group I contribution to the WGI Sixth Assessment Report of the Intergovernmental Panel on Climate Change". The Intergovernmental Panel on Climate Change.
- (May 11, 2020). "CO₂ and Greenhouse Gas Emissions". Our World in Data.
- (March 19, 2023). "Synthesis Report of the IPCC Sixth Assessment Report (AR6)".
- ((IPCC AR5 WG1)). (2013). "Climate Change 2013: The Physical Science Basis – Summary for Policymakers". Cambridge University Press.
- "Radiative forcing".
- (1993). "Atmospheric Methane: Sources, Sinks, and Role in Global Change". Springer.
- (2026). "The NOAA Annual Greenhouse Gas Index (AGGI)". National Oceanic and Atmospheric Administration (NOAA).
- "Climate Change 2013: The Physical Science Basis. Contribution of Working Group I to the Fifth Assessment Report of the Intergovernmental Panel on Climate Change". Cambridge University Press.
- ["Climate change 2013 : the physical science basis: Working Group I contribution to the Fifth Assessment Report of the Intergovernmental Panel on Climate Change"]({{google books).
- Drew, Shindell. (2013). "Climate Change 2013: The Physical Science Basis – Working Group 1 contribution to the IPCC Fifth Assessment Report: Radiative Forcing in the AR5". [[Rutgers University]].
- Rebecca, Lindsey. (14 January 2009). "Climate and Earth's Energy Budget: Feature Articles".
- "Climate Change Synthesis Report 2007". United Nations Environment Programme.
- (April 20, 2018). "Increased importance of methane reduction for a 1.5 degree target". Environmental Research Letters.
- (May 6, 2021). "Global Methane Assessment: Benefits and Costs of Mitigating Methane Emissions". [[United Nations Environment Programme]].
- (December 27, 2016). "Radiative forcing of carbon dioxide, methane, and nitrous oxide: A significant revision of the methane radiative forcing". Geophysical Research Letters.
- "Ramanathan". Ambio-Royal Swedish Academy of sciences.
- "Primer on Short-Lived Climate Pollutants". Climate & Clean Air Coalition.
- (July 15, 2020). "The Global Methane Budget 2000–2017". Earth System Science Data.
- (2011-01-27). "PCF-Based Cavity Enhanced Spectroscopic Sensors for Simultaneous Multicomponent Trace Gas Analysis". Sensors.
- "AGAGE Data & Figures {{!}} Advanced Global Atmospheric Gases Experiment".
- (December 5, 2016). "Trends in Atmospheric Methane". NOAA Earth System Research Laboratory.
- (2021). "Methane Tracker 2021". IEA.
- . (March 1, 2019). ["Methane in the atmosphere is surging, and that's got scientists worried"](https://www.latimes.com/science/sciencenow/la-sci-sn-methane-atmosphere-accelerating-20190301-story.html).
- (2007). "IPCC AR4 SYR Appendix Glossary".
- (9 January 2007). "Radiative forcing due to stratospheric water vapour from CH4 oxidation". Geophysical Research Letters.
- (2013). "Anthropogenic and Natural Radiative Forcing". Cambridge University Press.
- "ESRL/GMD FTP Data Finder".
- (2021). "Chapter 5: Global Carbon and other Biogeochemical Cycles and Feedbacks". Cambridge University Press, Cambridge, UK and New York, NY, USA.
- (2022). "Global Methane Assessment". United Nations Environment Programme and Climate and Clean Air Coalition.
- "Ch.2 Changes in Atmospheric Constituents and in Radiative Forcing". IPPC.
- (2006-09-28). "Scientists pinpoint cause of slowing methane emissions". National Oceanic & Atmospheric Administration news Online.
- Denman, K.L.. "7. Couplings Between Changes in the Climate System and Biogeochemistry.". [[IPCC Fourth Assessment Report.
- (2008-04-23). "Annual Greenhouse Gas Index (AGGI) Indicates Sharp Rise in Carbon Dioxide and Methane in 2007". National Oceanic & Atmospheric Administration – Earth System Research Laboratory.
- Heidi Blake. (February 22, 2010). "Climate change could be accelerated by 'methane time bomb'". The Telegraph.
- McKie, Robin. (2019-02-17). "Sharp rise in methane levels threatens world climate targets". The Observer.
- (2019). "Very Strong Atmospheric Methane Growth in the 4 Years 2014–2017: Implications for the Paris Agreement". Global Biogeochemical Cycles.
- (2017). "Reduced biomass burning emissions reconcile conflicting estimates of the post-2006 atmospheric methane budget". Nature Communications.
- (2019). "Interpreting contemporary trends in atmospheric methane". Proceedings of the National Academy of Sciences of the United States of America.
- (2020). "Increasing anthropogenic methane emissions arise equally from agricultural and fossil fuel sources". Environmental Research Letters.
- (20 February 2024). "Investigation of the renewed methane growth post-2007 with high-resolution 3-D variational inverse modeling and isotopic constraints". Atmospheric Chemistry and Physics.
- (11 November 2021). "Anthropogenic emission is the main contributor to the rise of atmospheric methane during 1993–2017". National Science Review.
- IPCC. (2013). "Climate Change 2013: The Physical Science Basis".
- Stocker. "Climate Change 2013: The Physical Science Basis. Contribution of Working Group I to the Fifth Assessment Report of the Intergovernmental Panel on Climate Change".
- Laboratory, US Department of Commerce, NOAA, Earth System Research. (2023-07-05). "Globally averaged marine surface annual mean data". ESRL Global Monitoring Division – Global Greenhouse Gas Reference Network.
- Laboratory, US Department of Commerce, NOAA, Earth System Research. (2023-07-05). "Globally averaged marine surface monthly mean data". ESRL Global Monitoring Division – Global Greenhouse Gas Reference Network.
- (2022-11-11). "Global Carbon Budget 2022". Earth System Science Data.
- (2016). "The growing role of methane in anthropogenic climate change".
- "GMAO Chemical Forecasts and GEOS–CHEM NRT Simulations for ICARTT (top) and Randy Kawa, NASA GSFC Atmospheric Chemistry and Dynamics Branch (lower)".
- (16 March 2022). "Tropical methane emissions explain large fraction of recent changes in global atmospheric methane growth rate". Nature Communications.
- NOAA Research. (12 October 2021). "New analysis shows microbial sources fueling rise of atmospheric methane". National Oceanic and Atmospheric Administration.
- (2017). "Global inventory of gas geochemistry data from fossil fuel, microbial and burning sources, version 2017". Earth System Science Data.
- (September 22, 2013). "Three decades of global methane sources and sinks". Nature Geoscience.
- Levine, S.. "Treatise on geochemistry". Elsevier Science.
- (January 9, 2007). "Radiative forcing due to stratospheric water vapour from CH4 oxidation". Geophysical Research Letters.
- (2017). "Water Vapour and Methane Coupling in the Stratosphere observed with SCIAMACHY Solar Occultation Measurements". Atmospheric Chemistry and Physics.
- Ramanathan, V.. (1998). "Trace-Gas Greenhouse Effect and Global Warming: Underlying Principles and Outstanding Issues Volvo Environmental Prize Lecture-1997". Ambio.
- "Ramanathan". Ambio-Royal Swedish Academy of Sciences.
- (2008-03-20). "Ozone Basics".
- Shindell, Drew. (2001). "Wetter Upper Atmosphere May Delay Global Ozone Recovery". NASA.
- (July 2006). "Long-term changes of methane and hydrogen in the stratosphere in the period 1978–2003 and their impact on the abundance of stratospheric water vapor". Journal of Geophysical Research: Atmospheres.
- (April 2010). "Methane and Nitrous Oxide Emissions From Natural Sources". USA Environmental Protection Agency Office of Atmospheric Programs.
- (January 2013). "Future methane, hydroxyl, and their uncertainties: key climate and emission parameters for future predictions". Atmospheric Chemistry and Physics.
- (1 August 2018). "An assessment of natural methane fluxes simulated by the CLASS-CTEM model". Biogeosciences.
- (January 16, 2012). "How long do greenhouse gases stay in the air?". The Guardian.
- Warneck, Peter. (2000). ["Chemistry of the Natural Atmosphere"]({{google books). Academic Press.
- "Methane Sinks − Soils". Greenhouse Gas Online.
- (26 June 2020). "Assessing the potential for non-turbulent methane escape from the East Siberian Arctic Shelf". Biogeosciences.
- (April 2019). "The oldest ice on Earth may be able to solve the puzzle of the planet's climate history". University of Bern.
- (August 2016). "Climate Change Indicators in the United States: Atmospheric Concentrations of Greenhouse Gases".
- (May 15, 2008). "Orbital and millennial-scale features of atmospheric CH4 over the past 800,000 years". Nature.
- (2002). "Historic CH4 Records from Antarctic and Greenland Ice Cores, Antarctic Firn Data, and Archived Air Samples from Cape Grim, Tasmania". Environmental System Science Data Infrastructure for a Virtual Ecosystem; Carbon Dioxide Information Analysis Center (CDIAC), Oak Ridge National Laboratory (ORNL).
- (2016). "Monthly mean CH4 concentrations for Cape Grim, Australia". National Oceanic and Atmospheric Administration.
- (2016). "Monthly mean CH4 concentrations for Mauna Loa, Hawaii". National Oceanic and Atmospheric Administration.
- (October 2002). "Atmospheric methane record from Shetland Islands, Scotland". U.S. Department of Energy.
- "Methane {{!}} Reg Morrison".
- (December 15, 2014). "Two massive, rapid releases of carbon during the onset of the Palaeocene–Eocene thermal maximum". Nature Geoscience.
- (July 2003). "How to kill (almost) all life: the end-Permian extinction event". Trends in Ecology & Evolution.
- (December 12, 2001). "Methane Explosion Warmed The Prehistoric Earth, Possible Again". NASA/Goddard Space Flight Center, EOS Project Science Office.
- (October 30, 2009). "Improved Attribution of Climate Forcing to Emissions". Science.
- Vergano, Dan. (2009-10-29). "Methane's role in global warming underestimated". USA Today.
- Gale, Joseph. (2009). ["Astrobiology of Earth: the emergence, evolution, and future of life on a planet in turmoil"]({{google books). Oxford University Press.
- (January 2003). "Methane-rich Proterozoic atmosphere?". Geology.
This article was imported from Wikipedia and is available under the Creative Commons Attribution-ShareAlike 4.0 License. Content has been adapted to SurfDoc format. Original contributors can be found on the article history page.
Ask Mako anything about Atmospheric methane — get instant answers, deeper analysis, and related topics.
Research with MakoFree with your Surf account
Create a free account to save articles, ask Mako questions, and organize your research.
Sign up freeThis content may have been generated or modified by AI. CloudSurf Software LLC is not responsible for the accuracy, completeness, or reliability of AI-generated content. Always verify important information from primary sources.
Report