From Surf Wiki (app.surf) — the open knowledge base
Affinity diagram
One of the Seven Management and Planning Tools
One of the Seven Management and Planning Tools
The affinity diagram is a business tool used to organize ideas and data. It is one of the Seven Management and Planning Tools. People have been grouping data into groups based on natural relationships for thousands of years; however, the term affinity diagram was devised by Jiro Kawakita in the 1960s and is sometimes referred to as the KJ Method.
The tool is commonly used within project management and allows large numbers of ideas stemming from brainstorming to be sorted into groups, based on their natural relationships, for review and analysis. It is also frequently used in contextual inquiry as a way to organize notes and insights from field interviews. It can also be used for organizing other freeform comments, such as open-ended survey responses, support call logs, or other qualitative data.
Process
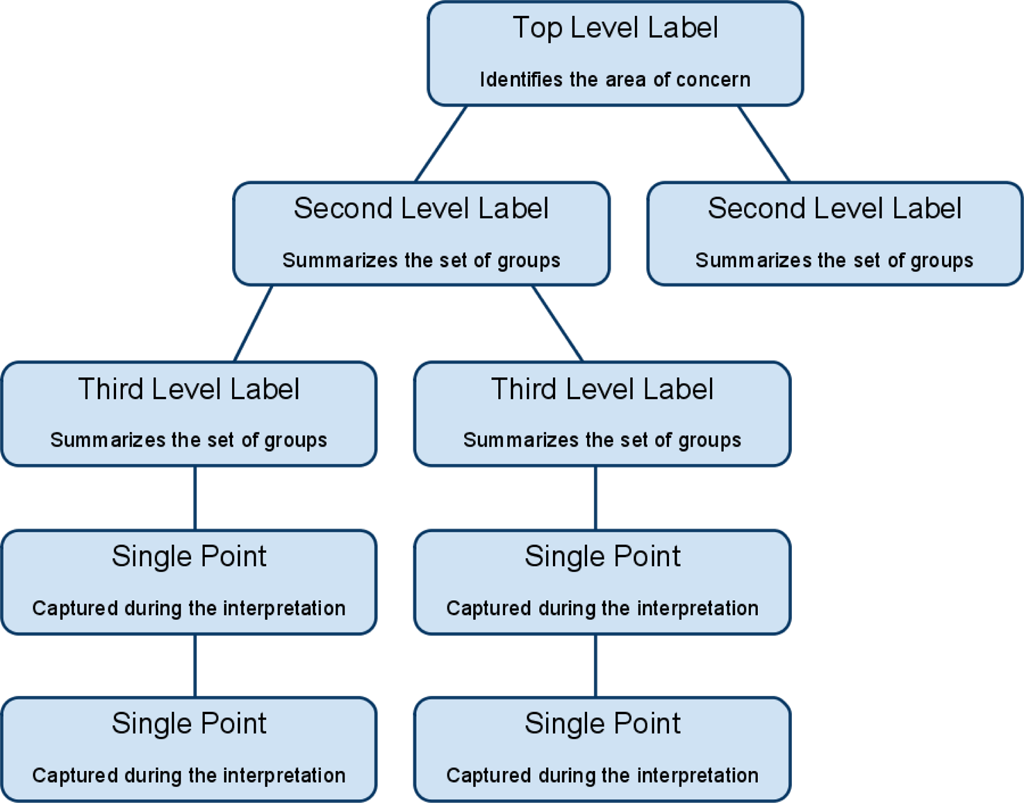
The affinity diagram organizes ideas with following steps:
- Record each idea on cards or notes.
- Look for ideas that seem to be related.
- Sort cards into groups until all cards have been used.
Once the cards have been sorted into groups the team may sort large clusters into subgroups for easier management and analysis. Once completed, the affinity diagram may be used to create a cause and effect diagram.
In many cases, the best results tend to be achieved when the activity is completed by a cross-functional team, including key stakeholders. The process requires becoming deeply immersed in the data, which has benefits beyond the tangible deliverables.
Citations
References
- {{cite book|last=Project Management Institute|title=A guide to the project management body of knowledge (PMBOK guide)|date=2021|others=Project Management Institute|isbn=978-1-62825-664-2
References
- Improving Performance Through Statistical Thinking By Galen C. Britz
- [http://www.pmhut.com/affinity-diagram-kawakita-jiro-or-kj-method Affinity Diagram - Kawakita Jiro or KJ Method], Retrieved June 6, 2010
- "Using Affinity Diagrams to make sense from brainstorming".
- Value: Its Measurement, Design and Management By M. Larry Shillito
- "NHS Improvement network".
This article was imported from Wikipedia and is available under the Creative Commons Attribution-ShareAlike 4.0 License. Content has been adapted to SurfDoc format. Original contributors can be found on the article history page.
Ask Mako anything about Affinity diagram — get instant answers, deeper analysis, and related topics.
Research with MakoFree with your Surf account
Create a free account to save articles, ask Mako questions, and organize your research.
Sign up freeThis content may have been generated or modified by AI. CloudSurf Software LLC is not responsible for the accuracy, completeness, or reliability of AI-generated content. Always verify important information from primary sources.
Report