From Surf Wiki (app.surf) — the open knowledge base
2008 United States House of Representatives elections in Washington
none
none
| Field | Value |
|---|---|
| election_name | 2008 United States House of Representatives elections in Washington |
| country | Washington |
| type | legislative |
| ongoing | no |
| previous_election | 2006 United States House of Representatives elections in Washington |
| previous_year | 2006 |
| next_election | 2010 United States House of Representatives elections in Washington |
| next_year | 2010 |
| seats_for_election | All 9 Washington seats to the United States House of Representatives |
| election_date | |
| party1 | Democratic Party (United States) |
| last_election1 | **6** |
| seats1 | **6** |
| seat_change1 | |
| popular_vote1 | **1,725,316** |
| percentage1 | **59.20%** |
| swing1 | 5.07% |
| party2 | Republican Party (United States) |
| last_election2 | 3 |
| seats2 | 3 |
| seat_change2 | |
| popular_vote2 | 1,189,147 |
| percentage2 | 40.80% |
| swing2 | 5.66% |
| map_image | {{switcher |
| map_caption |
|[[File:2008 United States House of Representatives elections in Washington.svg|x200px]] |District results |[[File:2008 United States House of Representatives elections in Washington results map by county.svg|x200px]] |County results}} Democratic Republican The 2008 congressional elections in Washington was held on November 4, 2008, to determine who will represent the state of Washington in the United States House of Representatives. Representatives are elected for two-year terms; those elected will serve in the 111th Congress from January 4, 2009, until January 3, 2011. The election coincided with the 2008 U.S. presidential election. Nonpartisan blanket primary elections were held on August 19, 2008.
Washington has nine seats in the House, apportioned according to the 2000 United States census. Its 2007-2008 congressional delegation consisted of six Democrats and three Republicans. All of the incumbents were re-elected, with only the 8th district race being considered competitive.
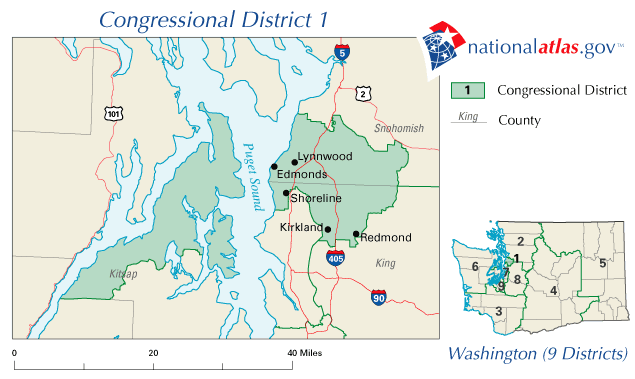
District 1
Incumbent Democrat Jay Inslee has represented the 1st district in Congress since 1999. Inslee won in the 2006 election with 68% of the vote. He was opposed by Republican candidate Larry Ishmael.
Primary results
General election
Predictions
| Source | Ranking | As of |
|---|---|---|
| The Cook Political Report | November 6, 2008 | |
| Rothenberg | November 2, 2008 | |
| Sabato's Crystal Ball | November 6, 2008 | |
| Real Clear Politics | November 7, 2008 | |
| CQ Politics | November 6, 2008 |
Results
By county
| County | Jay Inslee | Larry Ishmael | Margin | Total votes | # | % | # | % | # | % | Totals | 233,780 | 67.76% | 111,240 | 32.24% | 122,540 | 35.52% | 345,020 |
|---|---|---|---|---|---|---|---|---|---|---|---|---|---|---|---|---|---|---|
| King (part) | **85,283** | **69.71%** | 37,062 | 30.29% | 48,221 | 39.41% | 122,345 | |||||||||||
| Kitsap (part) | **41,602** | **66.15%** | 21,284 | 33.85% | 20,318 | 32.31% | 62,886 | |||||||||||
| Snohomish (part) | **106,895** | **66.90%** | 52,894 | 33.10% | 54,001 | 33.80% | 159,789 |
District 2

Incumbent Democrat Rick Larsen has represented the 2nd district in Congress since 2001. Larsen won in the 2006 election with 64% of the vote. He was opposed by Republican candidate Rick Bart. Two other Democrats challenged the two in the primary election, Doug Schaffer and Glen Johnson.
Primary results
General election
Predictions
| Source | Ranking | As of |
|---|---|---|
| The Cook Political Report | November 6, 2008 | |
| Rothenberg | November 2, 2008 | |
| Sabato's Crystal Ball | November 6, 2008 | |
| Real Clear Politics | November 7, 2008 | |
| CQ Politics | November 6, 2008 |
Results
By county
| County | Rick Larsen | |||||||||||||||||||||||||
|---|---|---|---|---|---|---|---|---|---|---|---|---|---|---|---|---|---|---|---|---|---|---|---|---|---|---|
| Democratic | Rick Bart | |||||||||||||||||||||||||
| Republican | Margin | Total votes cast | # | % | # | % | # | % | Totals | 217,416 | 62.39% | 131,051 | 37.61% | 86,365 | 24.78% | 348,467 | ||||||||||
| Island | 24,948 | 61.70% | 15,489 | 38.30% | 9,459 | 23.39% | 40,437 | |||||||||||||||||||
| King (part) | 198 | 66.89% | 98 | 33.11% | 100 | 33.78% | 296 | |||||||||||||||||||
| San Juan | 7,308 | 72.44% | 2,781 | 27.56% | 4,527 | 44.87% | 10,089 | |||||||||||||||||||
| Skagit | 34,641 | 64.52% | 19,051 | 35.48% | 15,590 | 29.04% | 53,692 | |||||||||||||||||||
| Snohomish (part) | 87,457 | 59.00% | 60,784 | 41.00% | 26,673 | 17.99% | 148,241 | |||||||||||||||||||
| Whatcom | 62,864 | 65.68% | 32,848 | 34.32% | 30,016 | 31.36% | 95,712 |
District 3
Baird:
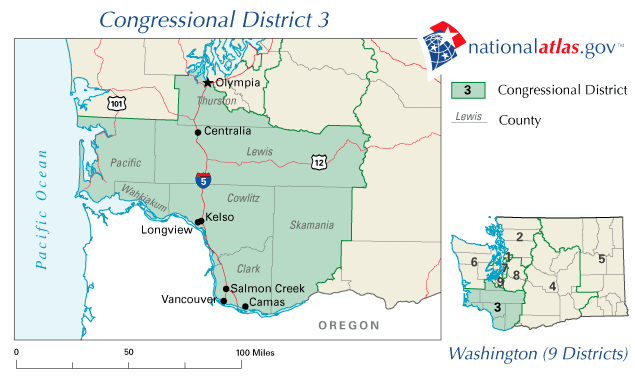
Incumbent Democrat Brian Baird has represented the 3rd district in Congress since 1999. Baird won in the 2006 election with 63% of the vote. He was opposed by Republican candidate Michael Delavar. Democrat Cheryl Crist and Republican Christine Webb also entered the primary.
Primary results
General election
Predictions
| Source | Ranking | As of |
|---|---|---|
| The Cook Political Report | November 6, 2008 | |
| Rothenberg | November 2, 2008 | |
| Sabato's Crystal Ball | November 6, 2008 | |
| Real Clear Politics | November 7, 2008 | |
| CQ Politics | November 6, 2008 |
Results
By county
| County | Brian Baird | Michael Delavar | Margin | Total votes | # | % | # | % | # | % | Totals | 216,701 | 64.01% | 121,828 | 35.99% | 94,873 | 28.03% | 338,529 |
|---|---|---|---|---|---|---|---|---|---|---|---|---|---|---|---|---|---|---|
| Clark | **106,878** | **61.21%** | 67,733 | 38.79% | 39,145 | 22.42% | 174,611 | |||||||||||
| Cowlitz | **29,102** | **66.71%** | 14,523 | 33.29% | 14,579 | 33.42% | 43,625 | |||||||||||
| Lewis | **19,745** | **59.03%** | 13,705 | 40.97% | 6,040 | 18.06% | 33,450 | |||||||||||
| Pacific | **7,706** | **72.57%** | 2,913 | 27.43% | 4,793 | 45.14% | 10,619 | |||||||||||
| Skamania (part) | **2,309** | **60.19%** | 1,527 | 39.81% | 782 | 20.39% | 3,836 | |||||||||||
| Thurston (part) | **49,456** | **70.50%** | 20,699 | 29.50% | 28,757 | 40.99% | 70,155 | |||||||||||
| Wahkiakum | **1,505** | **67.40%** | 728 | 32.60% | 777 | 34.80% | 2,233 |
District 4
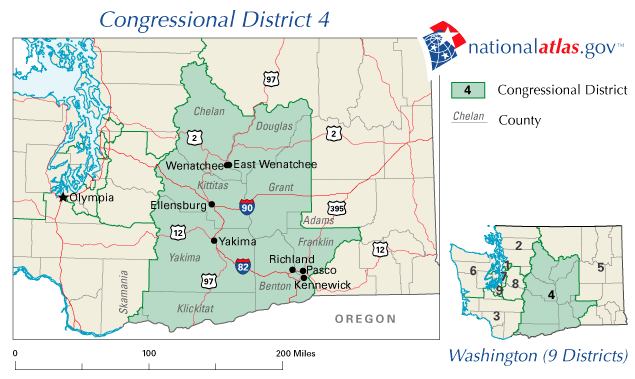
Incumbent Republican Doc Hastings has represented the 4th district in Congress since 1995. Hastings won in the 2006 election with 60% of the vote. He was opposed by Democratic candidate George Fearing. Republican Gordon Allen Pross was eliminated in the primary.
Primary results
General election
Predictions
| Source | Ranking | As of |
|---|---|---|
| The Cook Political Report | November 6, 2008 | |
| Rothenberg | November 2, 2008 | |
| Sabato's Crystal Ball | November 6, 2008 | |
| Real Clear Politics | November 7, 2008 | |
| CQ Politics | November 6, 2008 |
Results
By county
| County | Doc Hastings | George Fearing | Margin | Total votes | # | % | # | % | # | % | Totals | 169,940 | 63.09% | 99,430 | 36.91% | 70,510 | 26.18% | 269,370 |
|---|---|---|---|---|---|---|---|---|---|---|---|---|---|---|---|---|---|---|
| Adams (part) | **1,522** | **67.08%** | 747 | 32.92% | 775 | 34.16% | 2,269 | |||||||||||
| Benton | **46,603** | **65.23%** | 24,838 | 34.77% | 21,765 | 30.47% | 71,441 | |||||||||||
| Chelan | **20,270** | **65.49%** | 10,681 | 34.51% | 9,589 | 30.98% | 30,951 | |||||||||||
| Douglas | **10,108** | **68.52%** | 4,644 | 31.48% | 5,464 | 37.04% | 14,752 | |||||||||||
| Franklin | **12,408** | **64.06%** | 6,960 | 35.94% | 5,448 | 28.13% | 19,368 | |||||||||||
| Grant | **18,460** | **69.17%** | 8,227 | 30.83% | 10,233 | 38.34% | 26,687 | |||||||||||
| Kittitas | **10,095** | **58.57%** | 7,142 | 41.43% | 2,953 | 17.13% | 17,237 | |||||||||||
| Klickitat | **5,603** | **57.25%** | 4,184 | 42.75% | 1,419 | 14.50% | 9,787 | |||||||||||
| Skamania (part) | **717** | **52.11%** | 659 | 47.89% | 58 | 4.22% | 1,376 | |||||||||||
| Yakima | **44,154** | **58.48%** | 31,348 | 41.52% | 12,806 | 16.96% | 75,502 |
District 5

Incumbent Republican Cathy McMorris Rodgers has represented the 2nd district in Congress since 2005. Rodgers was elected in 2006 with 56% of the vote. She was opposed by Democratic candidate Mark Mays. Barbara Lampert of the Democratic party, Republican Kurt Erickson, Libertarian John Beck and Constitution candidate Randall Yearout were eliminated in the primary.
Primary results
General election
Predictions
| Source | Ranking | As of |
|---|---|---|
| The Cook Political Report | November 6, 2008 | |
| Rothenberg | November 2, 2008 | |
| Sabato's Crystal Ball | November 6, 2008 | |
| Real Clear Politics | November 7, 2008 | |
| CQ Politics | November 6, 2008 |
Results
By county
| County | Cathy McMorris Rodgers | Mark Mays | Margin | Total votes | # | % | # | % | # | % | Totals | 211,305 | 65.28% | 112,382 | 34.72% | 98,923 | 30.56% | 323,687 |
|---|---|---|---|---|---|---|---|---|---|---|---|---|---|---|---|---|---|---|
| Adams (part) | **1,964** | **82.45%** | 418 | 17.55% | 1,546 | 64.90% | 2,382 | |||||||||||
| Asotin | **6,422** | **67.96%** | 3,028 | 32.04% | 3,394 | 35.92% | 9,450 | |||||||||||
| Columbia | **1,795** | **81.78%** | 400 | 18.22% | 1,395 | 63.55% | 2,195 | |||||||||||
| Ferry | **2,448** | **71.60%** | 971 | 28.40% | 1,477 | 43.20% | 3,419 | |||||||||||
| Garfield | **1,081** | **80.91%** | 255 | 19.09% | 826 | 61.83% | 1,336 | |||||||||||
| Lincoln | **4,586** | **78.10%** | 1,286 | 21.90% | 3,300 | 56.20% | 5,872 | |||||||||||
| Okanogan | **11,082** | **67.37%** | 5,367 | 32.63% | 5,715 | 34.74% | 16,449 | |||||||||||
| Pend Oreille | **4,426** | **69.62%** | 1,931 | 30.38% | 2,495 | 39.25% | 6,357 | |||||||||||
| Spokane | **134,228** | **62.79%** | 79,531 | 37.21% | 54,697 | 25.59% | 213,759 | |||||||||||
| Stevens | **16,068** | **73.14%** | 5,902 | 26.86% | 10,166 | 46.27% | 21,970 | |||||||||||
| Walla Walla | **16,713** | **70.62%** | 6,954 | 29.38% | 9,759 | 41.23% | 23,667 | |||||||||||
| Whitman | **10,492** | **62.34%** | 6,339 | 37.66% | 4,153 | 24.67% | 16,831 |
District 6
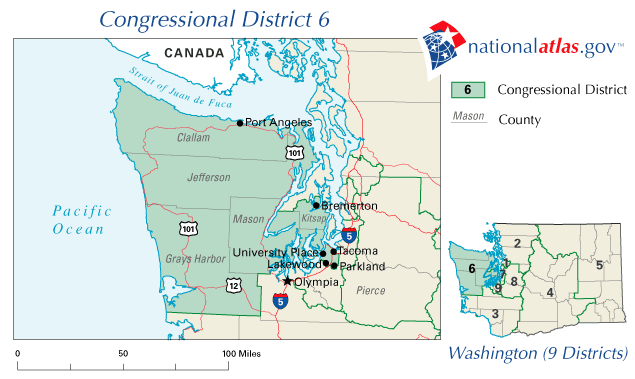
Incumbent Democrat Norm Dicks has represented the 6th district in Congress since 1977. Dicks won in the 2006 election with 71% of the vote. He was opposed by Republican candidate Doug Cloud. Green candidate Gary Murrell and Democrat Paul Richmond also entered the primary.
Primary results
General election
Predictions
| Source | Ranking | As of |
|---|---|---|
| The Cook Political Report | November 6, 2008 | |
| Rothenberg | November 2, 2008 | |
| Sabato's Crystal Ball | November 6, 2008 | |
| Real Clear Politics | November 7, 2008 | |
| CQ Politics | November 6, 2008 |
Results
By county
| County | Norm Dicks | Doug Cloud | Margin | Total votes | # | % | # | % | # | % | Totals | 205,991 | 66.86% | 102,081 | 33.14% | 103,910 | 33.73% | 308,072 |
|---|---|---|---|---|---|---|---|---|---|---|---|---|---|---|---|---|---|---|
| Clallam | **20,745** | **55.72%** | 16,489 | 44.28% | 4,256 | 11.43% | 37,234 | |||||||||||
| Grays Harbor | **18,783** | **66.64%** | 9,403 | 33.36% | 9,380 | 33.28% | 28,186 | |||||||||||
| Jefferson | **13,462** | **70.23%** | 5,706 | 29.77% | 7,756 | 40.46% | 19,168 | |||||||||||
| Kitsap (part) | **39,404** | **67.77%** | 18,736 | 32.23% | 20,668 | 35.55% | 58,140 | |||||||||||
| Mason | **17,710** | **64.11%** | 9,915 | 35.89% | 7,795 | 28.22% | 27,625 | |||||||||||
| Pierce (part) | **95,887** | **69.63%** | 41,832 | 30.37% | 54,055 | 39.25% | 137,719 |
District 7

Incumbent Democrat Jim McDermott has represented the 7th district in Congress since 1989. McDermott won in the 2006 election with 79% of the vote in the most Democratic district in the state. He was opposed by Republican candidate Steve Beren. Democrats Donovan Rivers and Goodspaceguy entered the primary, as well as independents Mark Goldman and Al Schaefer.
Primary results
General election
Predictions
| Source | Ranking | As of |
|---|---|---|
| The Cook Political Report | November 6, 2008 | |
| Rothenberg | November 2, 2008 | |
| Sabato's Crystal Ball | November 6, 2008 | |
| Real Clear Politics | November 7, 2008 | |
| CQ Politics | November 6, 2008 |
Results
By county
| County | Jim McDermott | Steve Beren | Margin | Total votes | # | % | # | % | # | % | Totals | 291,963 | 83.65% | 57,054 | 16.35% | 234,909 | 67.31% | 349,017 |
|---|---|---|---|---|---|---|---|---|---|---|---|---|---|---|---|---|---|---|
| King (part) | **291,963** | **83.65%** | 57,054 | 16.35% | 234,909 | 67.31% | 349,017 |
District 8

Incumbent Republican Dave Reichert has represented the 8th district in Congress since 2005. Reichert won in the 2006 election with 51.5% of the vote. He was opposed by Democratic candidate Darcy Burner. The primary also included Democrats James Vaughn and Keith Arnold, and Independents Richard Todd and Boleslaw Orlinski.
The District 8 race was considered competitive: it voted for Obama by a large margin and had a Cook PVI of D+2. It was rated "toss up" by Cook, "no clear favorite" by CQ Politics and "toss up/tilt Republican" by Rothenberg.
Primary results
General election
Predictions
| Source | Ranking | As of |
|---|---|---|
| The Cook Political Report | November 6, 2008 | |
| Rothenberg | November 2, 2008 | |
| Sabato's Crystal Ball | November 6, 2008 | |
| Real Clear Politics | November 7, 2008 | |
| CQ Politics | November 6, 2008 |
Results
By county
| County | Dave Reichert | Darcy Burner | Margin | Total votes | # | % | # | % | # | % | Totals | 191,568 | 52.78% | 171,358 | 47.22% | 20,210 | 5.57% | 362,926 |
|---|---|---|---|---|---|---|---|---|---|---|---|---|---|---|---|---|---|---|
| King (part) | **147,170** | **51.22%** | 140,165 | 48.78% | 7,005 | 2.44% | 287,335 | |||||||||||
| Pierce (part) | **44,398** | **58.73%** | 31,193 | 41.27% | 13,205 | 17.47% | 75,591 |
District 9
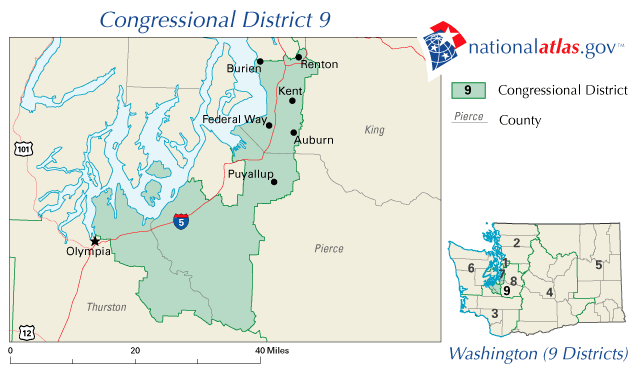
Incumbent Democrat Adam Smith has represented the 9th district in Congress since 1997. Smith won in the 2006 election with 66% of the vote. He was opposed by Republican candidate James Postma.
Primary results
General election
Predictions
| Source | Ranking | As of |
|---|---|---|
| The Cook Political Report | November 6, 2008 | |
| Rothenberg | November 2, 2008 | |
| Sabato's Crystal Ball | November 6, 2008 | |
| Real Clear Politics | November 7, 2008 | |
| CQ Politics | November 6, 2008 |
Results
By county
| County | Adam Smith | James Postma | Margin | Total votes | # | % | # | % | # | % | Totals | 176,295 | 65.45% | 93,080 | 34.55% | 83,215 | 30.89% | 269,375 |
|---|---|---|---|---|---|---|---|---|---|---|---|---|---|---|---|---|---|---|
| King (part) | **82,368** | **69.66%** | 35,877 | 30.34% | 46,491 | 39.32% | 118,245 | |||||||||||
| Pierce (part) | **62,448** | **60.81%** | 40,254 | 39.19% | 22,194 | 21.61% | 102,702 | |||||||||||
| Thurston (part) | **31,479** | **65.00%** | 16,949 | 35.00% | 14,530 | 30.00% | 48,428 |
References
References
- [http://www.secstate.wa.gov/elections/Top2PrimaryFAQ.aspx Top 2 Primary: FAQs for Voters] ''Washington Secretary of State''
- Reed, Sam. (August 19, 2008). "U.S. Congressional District 1 - Representative". [[Secretary of State of Washington]].
- (6 November 2006). "2008 Competitive House Race Chart". [[The Cook Political Report with Amy Walter.
- (2 November 2006). "2008 House Ratings". The Rothenberg Political Report.
- (6 November 2008). "2008 House". Sabato's Crystal Ball.
- (7 November 2008). "Battle for the House of Representatives". Real Clear Politics.
- "Race Ratings Chart: House". Congressional Quarterly Inc.
- Reed, Sam. (November 4, 2008). "U.S. Congressional District 1 - Representative". [[Secretary of State of Washington]].
- Reed, Sam. (November 4, 2008). "U.S. Congressional District 1 - Representative - County Results". [[Secretary of State of Washington]].
- Reed, Sam. (August 19, 2008). "U.S. Congressional District 2 - Representative". [[Secretary of State of Washington]].
- Reed, Sam. (November 4, 2008). "U.S. Congressional District 2 - Representative". [[Secretary of State of Washington]].
- Reed, Sam. (November 4, 2008). "U.S. Congressional District 2 - Representative - County Results". [[Secretary of State of Washington]].
- Reed, Sam. (August 19, 2008). "U.S. Congressional District 3 - Representative". [[Secretary of State of Washington]].
- Reed, Sam. (November 4, 2008). "U.S. Congressional District 3 - Representative". [[Secretary of State of Washington]].
- Reed, Sam. (November 4, 2008). "U.S. Congressional District 3 - Representative - County Results". [[Secretary of State of Washington]].
- Reed, Sam. (August 19, 2008). "U.S. Congressional District 4 - Representative". [[Secretary of State of Washington]].
- Reed, Sam. (November 4, 2008). "U.S. Congressional District 4 - Representative". [[Secretary of State of Washington]].
- Reed, Sam. (November 4, 2008). "U.S. Congressional District 4 - Representative - County Results". [[Secretary of State of Washington]].
- Reed, Sam. (August 19, 2008). "U.S. Congressional District 5 - Representative". [[Secretary of State of Washington]].
- Reed, Sam. (November 4, 2008). "U.S. Congressional District 5 - Representative". [[Secretary of State of Washington]].
- Reed, Sam. (November 4, 2008). "U.S. Congressional District 5 - Representative - County Results". [[Secretary of State of Washington]].
- Reed, Sam. (August 19, 2008). "U.S. Congressional District 6 - Representative". [[Secretary of State of Washington]].
- Reed, Sam. (November 4, 2008). "U.S. Congressional District 6 - Representative". [[Secretary of State of Washington]].
- Reed, Sam. (November 4, 2008). "U.S. Congressional District 6 - Representative - County Results". [[Secretary of State of Washington]].
- Reed, Sam. (August 19, 2008). "U.S. Congressional District 7 - Representative". [[Secretary of State of Washington]].
- Reed, Sam. (November 4, 2008). "U.S. Congressional District 7 - Representative". [[Secretary of State of Washington]].
- Reed, Sam. (November 4, 2008). "U.S. Congressional District 7 - Representative - County Results". [[Secretary of State of Washington]].
- [http://www.cookpolitical.com/races/house/chart.php House] {{Webarchive. link. (2010-10-05 ''The Cook Political Report'')
- link. (2008-06-17 ''[[Congressional Quarterly). CQ Politics]]''
- [https://rothenbergpoliticalreport.blogspot.com/2008/07/2008-house-ratings.html 2008 House Ratings] from ''The Rotherberg Political Report'', July 4, 2008
- Reed, Sam. (August 19, 2008). "U.S. Congressional District 8 - Representative". [[Secretary of State of Washington]].
- Reed, Sam. (November 4, 2008). "U.S. Congressional District 8 - Representative". [[Secretary of State of Washington]].
- Reed, Sam. (November 4, 2008). "U.S. Congressional District 8 - Representative - County Results". [[Secretary of State of Washington]].
- Reed, Sam. (August 19, 2008). "U.S. Congressional District 9 - Representative". [[Secretary of State of Washington]].
- Reed, Sam. (November 4, 2008). "U.S. Congressional District 9 - Representative". [[Secretary of State of Washington]].
- Reed, Sam. (November 4, 2008). "U.S. Congressional District 9 - Representative - County Results". [[Secretary of State of Washington]].
This article was imported from Wikipedia and is available under the Creative Commons Attribution-ShareAlike 4.0 License. Content has been adapted to SurfDoc format. Original contributors can be found on the article history page.
Ask Mako anything about 2008 United States House of Representatives elections in Washington — get instant answers, deeper analysis, and related topics.
Research with MakoFree with your Surf account
Create a free account to save articles, ask Mako questions, and organize your research.
Sign up freeThis content may have been generated or modified by AI. CloudSurf Software LLC is not responsible for the accuracy, completeness, or reliability of AI-generated content. Always verify important information from primary sources.
Report