From Surf Wiki (app.surf) — the open knowledge base
1994 Wigan Metropolitan Borough Council election
1994 UK local government election
1994 UK local government election
Elections to the Wigan council were held on Thursday, 5 May 1994, with one third of the seats up for election. Prior to the election, Labour had defended their seats in two by-elections for Abram and Hindley. The election suffered from a mixture of a poor contesting rate and low voter turnout. The number of candidates contesting was just 50, the lowest since 1975, with four wards going unopposed, and Lib Dems back to fighting a half of the seats, and the Conservatives less than two-thirds. The only other opposition standing were three Independent Labour candidates, one of which was the previous - but since deselected - Labour incumbent for the seat being fought in Worsley Mesnes. Voter turnout rose from the previous election's nadir, but at 30.4%, still well below average.
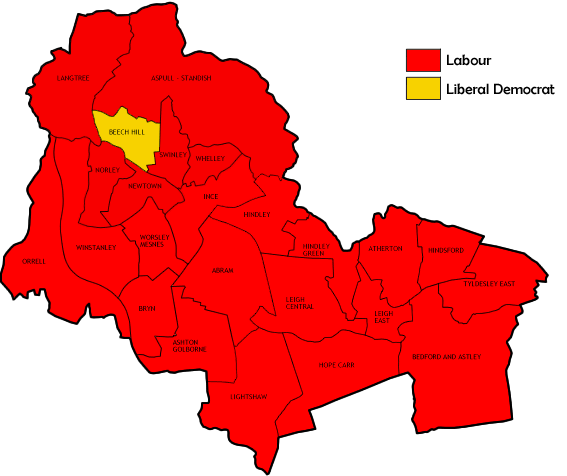
Labour achieved their highest vote share to date, with an overwhelming 70.3% of votes cast. Conversely the Conservatives obtained both their lowest vote share, and lowest vote figure, on record. The Lib Dems, whilst suffering a drop to 16% - a figure below average for results in recent years - witnessed nothing as dramatic. Party seat totals remained unchanged, with Labour and the Lib Dems gaining a seat from each other. The Lib Dem narrowly gained (by just four votes) their third in Beech Hill, turning a ward entirely represented by Labour from the early to mid eighties, into solely Lib Dem for the first time. Labour elsewhere regained a seat in Hope Carr, returning that to entirely Labour.
Election result
|seats % = 95.8 |votes % = 70.3 |plus/minus = +14.6% |seats % = 4.2 |votes % = 16.0 |plus/minus = -4.1% |seats % = 0.0 |votes % = 11.3 |plus/minus = -10.2% |seats % = 0.0 |votes % = 2.3 |plus/minus = +1.4%
This result had the following consequences for the total number of seats on the Council after the elections:
| Party | Previous council | New council | Labour Party (UK)}}; width: 3px;" | Liberal Democrats (UK)}}; width: 3px;" | Conservative Party (UK)}}; width: 3px;" | Independent Labour}}; width: 3px;" | Total | 72 | 72 | Working majority | ||||
|---|---|---|---|---|---|---|---|---|---|---|---|---|---|---|
| Labour | 61 | 61 | ||||||||||||
| Liberal Democrats | 8 | 8 | ||||||||||||
| Conservatives | 2 | 2 | ||||||||||||
| Independent Labour | 1 | 1 |
Ward results
References
References
- "Wigan Council results from 1973 to 2008". wigan.gov.uk.
This article was imported from Wikipedia and is available under the Creative Commons Attribution-ShareAlike 4.0 License. Content has been adapted to SurfDoc format. Original contributors can be found on the article history page.
Ask Mako anything about 1994 Wigan Metropolitan Borough Council election — get instant answers, deeper analysis, and related topics.
Research with MakoFree with your Surf account
Create a free account to save articles, ask Mako questions, and organize your research.
Sign up freeThis content may have been generated or modified by AI. CloudSurf Software LLC is not responsible for the accuracy, completeness, or reliability of AI-generated content. Always verify important information from primary sources.
Report