From Surf Wiki (app.surf) — the open knowledge base
2010 flash crash
U.S. stock market crash lasting 36 minutes in May 6, 2010
U.S. stock market crash lasting 36 minutes in May 6, 2010
The May 6, 2010, flash crash, also known as the crash of 2:45 or simply the flash crash, was a United States trillion-dollar flash crash (a type of stock market crash) which started at 2:32 p.m. EDT and lasted for approximately 36 minutes.
Overview
Stock indices, such as the S&P 500, Dow Jones Industrial Average and Nasdaq Composite, collapsed and rebounded very rapidly. The Dow Jones Industrial Average had its second biggest intraday point decline (from the opening) up to that point, plunging 998.5 points (about 9%), most within minutes, only to recover a large part of the loss. It was also the second-largest intraday point swing (difference between intraday high and intraday low) up to that point, at 1,010.14 points. The prices of stocks, stock index futures, options and exchange-traded funds (ETFs) were volatile, thus trading volume spiked. A CFTC 2014 report described it as one of the most turbulent periods in the history of financial markets.
New regulations put in place following the 2010 flash crash proved to be inadequate to protect investors in the August 24, 2015, flash crash — "when the price of many ETFs appeared to come unhinged from their underlying value" — and ETFs were subsequently put under greater scrutiny by regulators and investors.
On April 21, 2015, nearly five years after the incident, the U.S. Department of Justice laid 22 criminal counts, including fraud and market manipulation, against Navinder Singh Sarao, a British financial trader. Among the charges included was the use of spoofing algorithms; just prior to the flash crash, he placed orders for thousands of E-mini S&P 500 stock index futures contracts which he planned on canceling later. These orders amounting to about "$200 million worth of bets that the market would fall" were "replaced or modified 19,000 times" before they were canceled. Spoofing, layering, and front running are now banned.
The Commodity Futures Trading Commission (CFTC) investigation concluded that Sarao "was at least significantly responsible for the order imbalances" in the derivatives market which affected stock markets and exacerbated the flash crash. Sarao began his alleged market manipulation in 2009 with commercially available trading software whose code he modified "so he could rapidly place and cancel orders automatically". Traders Magazine journalist, John Bates, argued that blaming a 36-year-old small-time trader who worked from his parents' modest stucco house in suburban west London for sparking a trillion-dollar stock market crash is "a little bit like blaming lightning for starting a fire" and that the investigation was lengthened because regulators used "bicycles to try and catch Ferraris". Furthermore, he concluded that by April 2015, traders can still manipulate and impact markets in spite of regulators and banks' new, improved monitoring of automated trade systems.
In May 2014, a CFTC report concluded that high-frequency traders "did not cause the Flash Crash, but contributed to it by demanding immediacy ahead of other market participants".
Some recent peer-reviewed research shows that flash crashes are not isolated occurrences, but have occurred quite often. Gao and Mizrach studied US equities over the period of 1993–2011. They show that breakdowns in market quality (such as flash crashes) have occurred in every year they examined and that, apart from the financial crisis, such problems have declined since the introduction of Reg NMS. They also show that 2010, while infamous for the flash crash, was not a year with an inordinate number of breakdowns in market quality.
Background
On May 6, 2010, U.S. stock markets opened and the Dow was down, and trended that way for most of the day on worries about the debt crisis in Greece. At 2:42 p.m., with the Dow down more than 300 points for the day, the equity market began to fall rapidly, dropping an additional 600 points in 5 minutes for a loss of nearly 1,000 points for the day by 2:47 p.m. Twenty minutes later, by 3:07 p.m., the market had regained most of the 600-point drop. At the time of the flash crash, in May 2010, high-frequency traders were taking advantage of unintended consequences of the consolidation of the U.S. financial regulations into Regulation NMS, designed to modernize and strengthen the United States National Market System for equity securities. The Reg NMS, promulgated and described by the United States Securities and Exchange Commission, was intended to assure that investors received the best price executions for their orders by encouraging competition in the marketplace, but created attractive new opportunities for high-frequency-traders. Activities such as spoofing, layering and front running were banned by 2015. This rule was designed to give investors the best possible price when dealing in stocks, even if that price was not on the exchange that received the order.
Explanation
Early theories
At first, while the regulatory agencies and the United States Congress announced investigations into the crash, no specific reason for the 600-point plunge was identified. Investigators focused on a number of possible causes, including a confluence of computer-automated trades, or possibly an error by human traders. By the first weekend, regulators had discounted the possibility of trader error and focused on automated trades conducted on exchanges other than the NYSE. However, CME Group, a large futures exchange, stated that, insofar as stock index futures traded on CME Group were concerned, its investigation found no evidence for this, or that high-frequency trading played a role, and in fact concluded that automated trading had contributed to market stability during the period of the crash. Others speculate that an intermarket sweep order may have played a role in triggering the crash.
Several plausible theories were put forward to explain the plunge.
- The fat-finger theory: In 2010 immediately after the plunge, several reports indicated that the event may have been triggered by a fat-finger trade, an inadvertent large "sell order" for Procter & Gamble stock, inciting massive algorithmic trading orders to dump the stock; however, this theory was quickly disproved after it was determined that Procter and Gamble's decline occurred after a significant decline in the E-Mini S&P 500 futures contracts. The "fat-finger trade" hypothesis was also disproved when it was determined that existing CME Group and ICE safeguards would have prevented such an error.
- Impact of high frequency traders: Regulators found that high frequency traders exacerbated price declines. Regulators determined that high frequency traders sold aggressively to eliminate their positions and withdrew from the markets in the face of uncertainty. Other theories postulate that the actions of high frequency traders (HFTs) were the underlying cause of the flash crash. One hypothesis, based on the analysis of bid–ask data by Nanex, LLC, is that HFTs send non-executable orders (orders that are outside the bid–ask spread) to exchanges in batches. Though the purpose of these orders is not publicly known, some experts speculate that their purpose is to increase noise, clog exchanges, and outwit competitors. Whatever the reasons behind the existence of these orders, this theory postulates that they exacerbated the crash by overloading the exchanges on May 6. Some have put forth the theory that high-frequency trading was actually a major factor in minimizing and reversing the flash crash.
- Large directional bets: Regulators said a large E-Mini S&P 500 seller set off a chain of events triggering the Flash Crash, but did not identify the firm. Earlier, some investigators suggested that a large purchase of put options on the S&P 500 index by the hedge fund Universa Investments shortly before the crash may have been among the primary causes. Other reports have speculated that the event may have been triggered by a single sale of 75,000 E-Mini S&P 500 contracts valued at around $4 billion by the Overland Park, Kansas, firm Waddell & Reed on the Chicago Mercantile Exchange. Others suspect a movement in the U.S. Dollar to Japanese yen exchange rate.
- Changes in market structure: Some market structure experts speculate that, whatever the underlying causes, equity markets are vulnerable to these sorts of events because of decentralization of trading.
- Technical glitches: An analysis of trading on the exchanges during the moments immediately prior to the flash crash reveals technical glitches in the reporting of prices on the NYSE and various alternative trading systems (ATSs) that might have contributed to the drying up of liquidity. According to this theory, technical problems at the NYSE led to delays as long as five minutes in NYSE quotes being reported on the Consolidated Quotation System (CQS) with time stamps indicating that the quotes were current. However, some market participants (those with access to NYSE's own quote reporting system, OpenBook) could see both correct current NYSE quotes, as well as the delayed but apparently current CQS quotes. At the same time, there were errors in the prices of some stocks (Apple Inc., Sothebys, and some ETFs). Confused and uncertain about prices, many market participants attempted to drop out of the market by posting stub quotes (very low bids and very high offers) and, at the same time, many high-frequency trading algorithms attempted to exit the market with market orders (which were executed at the stub quotes) leading to a domino effect that resulted in the flash crash plunge.
SEC/CFTC report
On September 30, 2010, after almost five months of investigations led by Gregg E. Berman, the U.S. Securities and Exchange Commission (SEC) and the Commodity Futures Trading Commission (CFTC) issued a joint report titled "Findings Regarding the Market Events of May 6, 2010" identifying the sequence of events leading to the flash crash.
The joint 2010 report "portrayed a market so fragmented and fragile that a single large trade could send stocks into a sudden spiral", and detailed how a large mutual fund firm selling an unusually large number of E-Mini S&P contracts first exhausted available buyers, and then how high-frequency traders (HFT) started aggressively selling, accelerating the effect of the mutual fund's selling and contributing to the sharp price declines that day.Sources:
The SEC and CFTC joint 2010 report itself says that "May 6 started as an unusually turbulent day for the markets" and that by the early afternoon "broadly negative market sentiment was already affecting an increase in the price volatility of some individual securities". At 2:32 p.m. (EDT), against a "backdrop of unusually high volatility and thinning liquidity" that day, a large fundamental trader (known to be Waddell & Reed Financial Inc.) "initiated a sell program to sell a total of 75,000 E-Mini S&P contracts (valued at approximately $4.1 billion) as a hedge to an existing equity position". The report says that this was an unusually large position and that the computer algorithm the trader used to trade the position was set to "target an execution rate set to 9% of the trading volume calculated over the previous minute, but without regard to price or time".
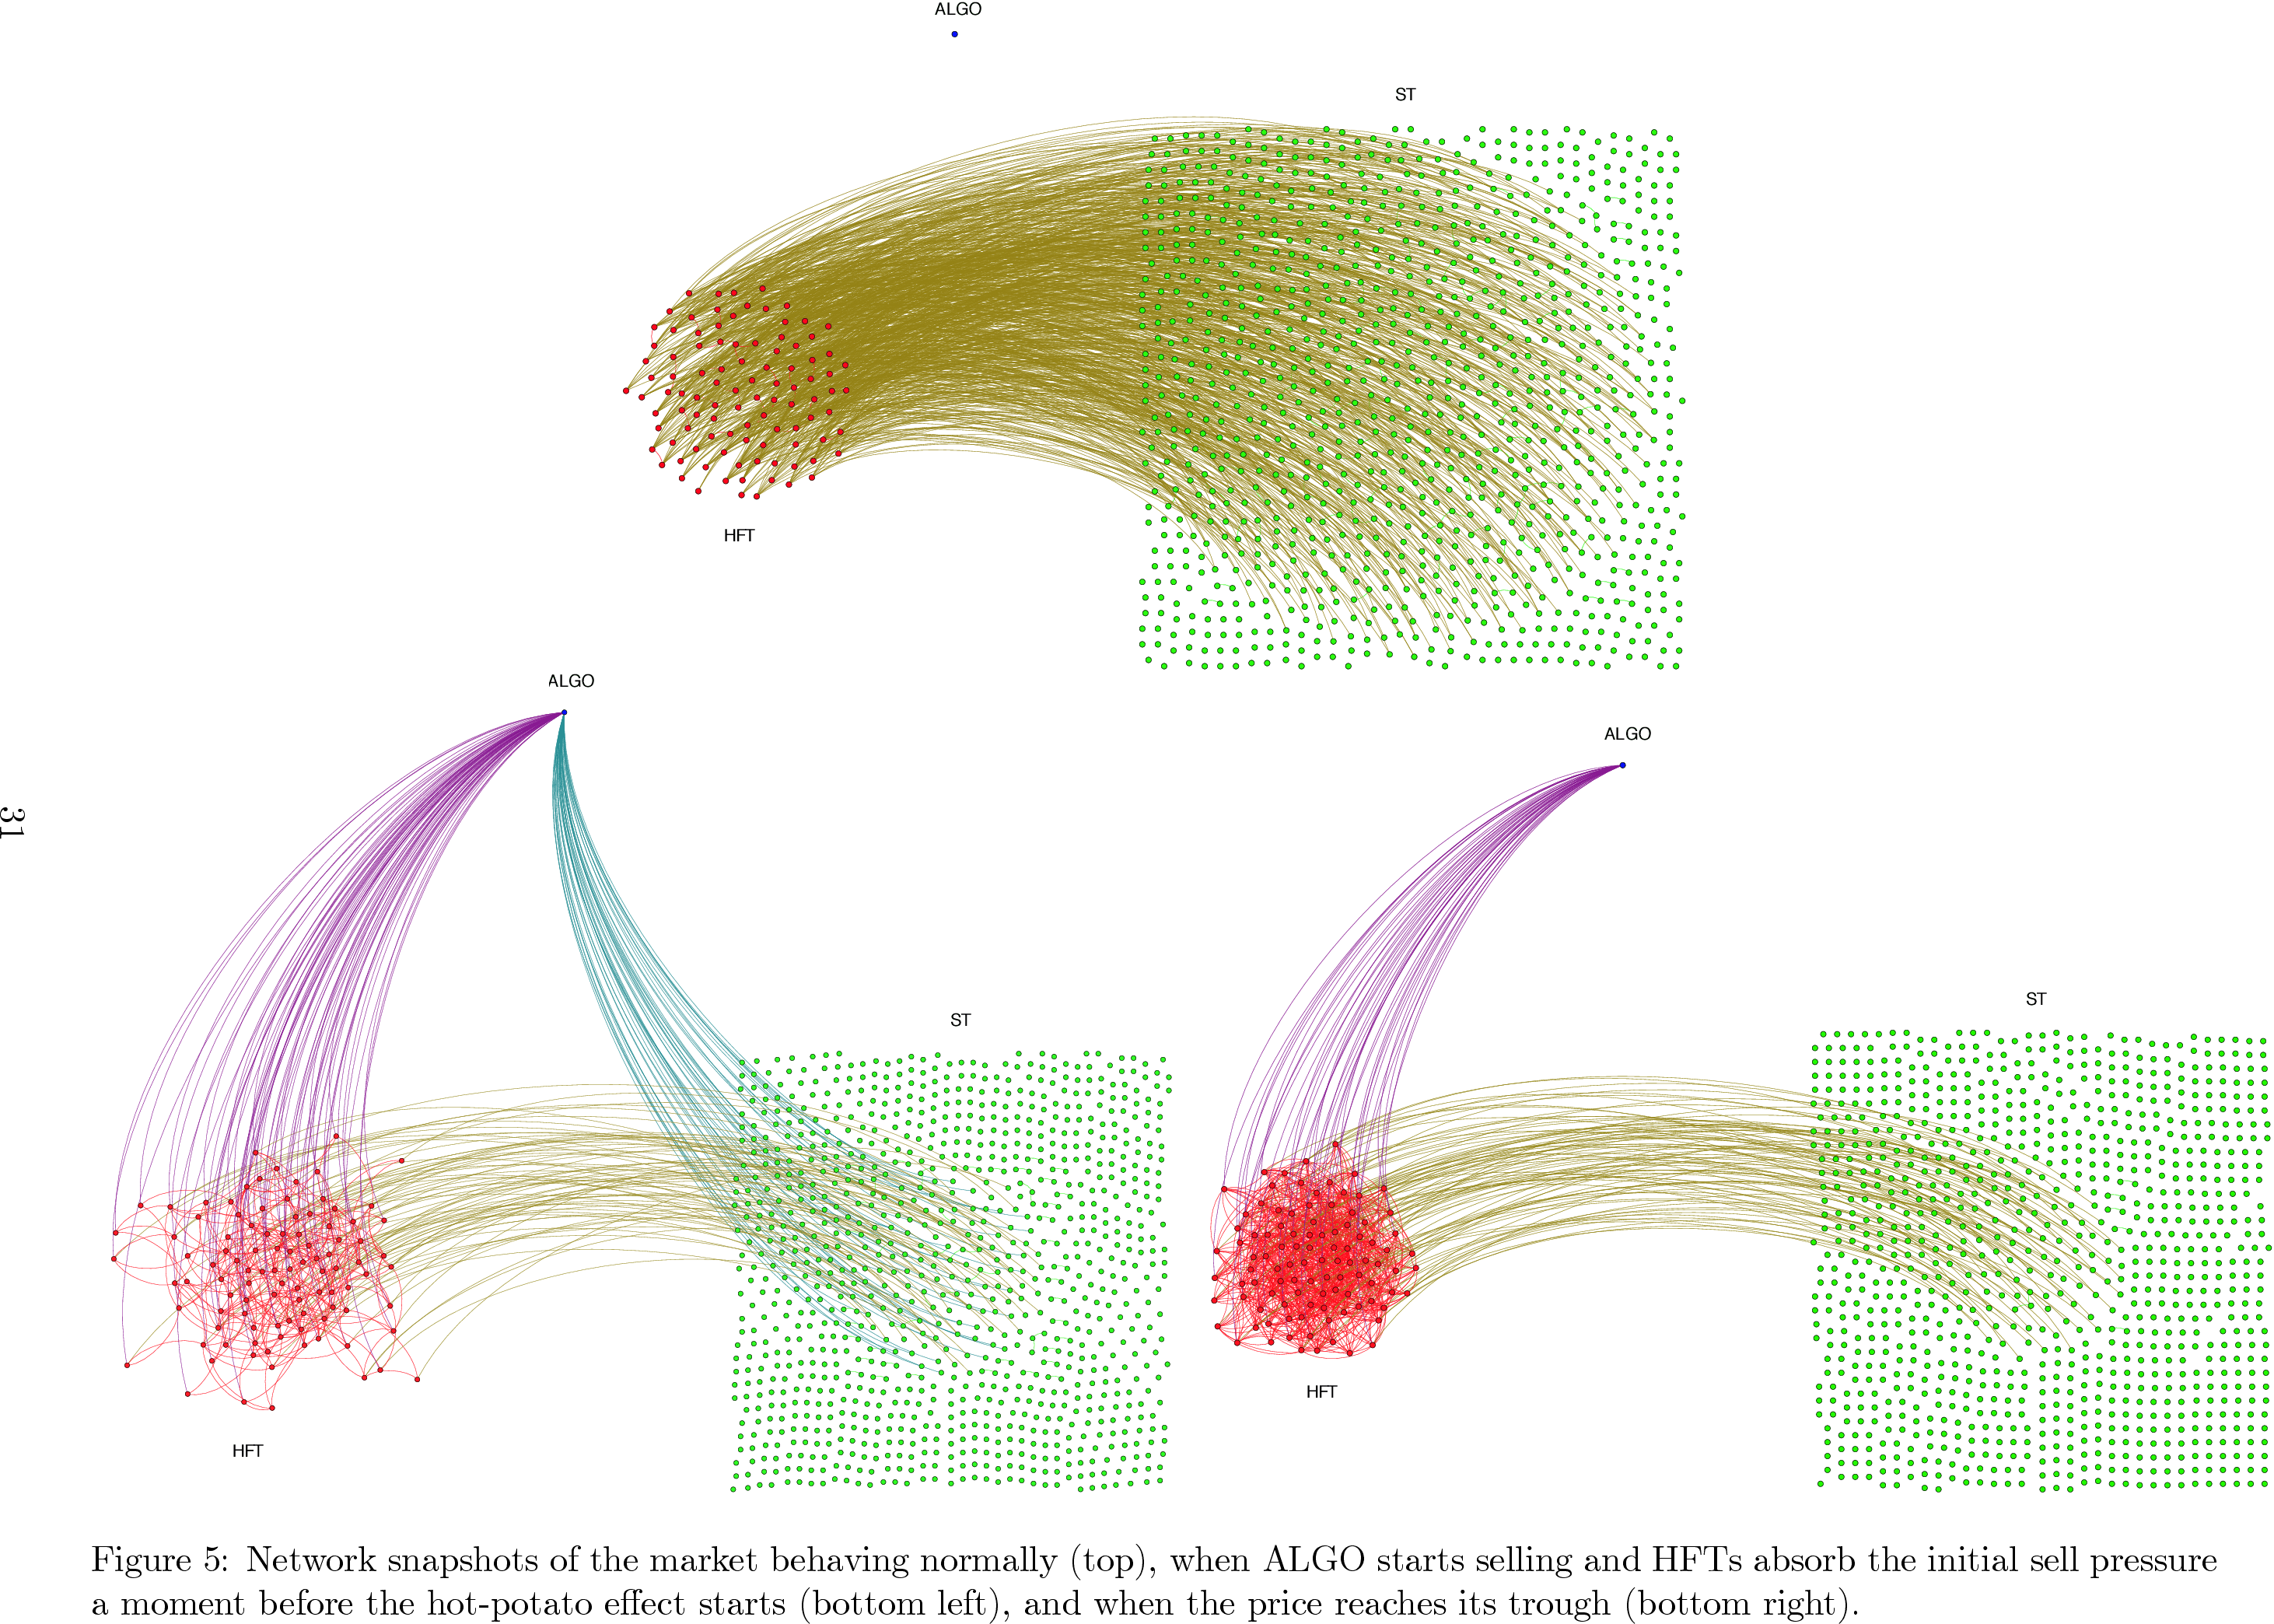
As the large seller's trades were executed in the futures market, buyers included high-frequency trading firms—trading firms that specialize in high-speed trading and rarely hold on to any given position for very long—and within minutes these high-frequency trading firms started trying to sell the long futures contracts they had just picked up from the mutual fund. The Wall Street Journal quoted the joint report, "'HFTs [then] began to quickly buy and then resell contracts to each other—generating a 'hot-potato' volume effect as the same positions were passed rapidly back and forth.'" The combined sales by the large seller and high-frequency firms quickly drove "the E-Mini price down 3% in just four minutes".
From the SEC/CFTC report:
The combined selling pressure from the sell algorithm, HFTs, and other traders drove the price of the E-Mini S&P 500 down approximately 3% in just four minutes from the beginning of 2:41 p.m. through the end of 2:44 p.m. During this same time cross-market arbitrageurs who did buy the E-Mini S&P 500, simultaneously sold equivalent amounts in the equities markets, driving the price of SPY (an exchange-traded fund which represents the S&P 500 index) also down approximately 3%.
Still lacking sufficient demand from fundamental buyers or cross-market arbitrageurs, HFTs began to quickly buy and then resell contracts to each other—generating a “hot-potato” volume effect as the same positions were rapidly passed back and forth. Between 2:45:13 and 2:45:27, HFTs traded over 27,000 contracts, which accounted for about 49 percent of the total trading volume, while buying only about 200 additional contracts net.}}
As prices in the futures market fell, there was a spillover into the equities markets. The computer systems used by most high-frequency trading firms to keep track of market activity decided to pause trading, and those firms then scaled back their trading or withdrew from the markets altogether.Sources:
The New York Times then noted, "Automatic computerized traders on the stock market shut down as they detected the sharp rise in buying and selling". firms that usually trade with customer orders from their own inventory instead of sending those orders to exchanges, "routing 'most, if not all,' retail orders to the public markets—a flood of unusual selling pressure that sucked up more dwindling liquidity".
While some firms exited the market, firms that remained in the market exacerbated price declines because they "'escalated their aggressive selling' during the downdraft". High-frequency firms during the crisis, like other firms, were net sellers, contributing to the crash.
The joint report continued: "At 2:45:28 p.m., trading on the E-Mini was paused for five seconds when the Chicago Mercantile Exchange ('CME') Stop Logic Functionality was triggered in order to prevent a cascade of further price declines. In that short period of time, sell-side pressure in the E-Mini was partly alleviated and buy-side interest increased. When trading resumed at 2:45:33 p.m., prices stabilized and shortly thereafter, the E-Mini began to recover, followed by the SPY". After a short while, as market participants had "time to react and verify the integrity of their data and systems, buy-side and sell-side interest returned and an orderly price discovery process began to function", and by 3:00 p.m., most stocks "had reverted back to trading at prices reflecting true consensus values".
Criticism of the SEC/CFTC report
A few hours after the release of the 104-page SEC/CFTC 2010 report, a number of critics stated that blaming a single order (from Waddell & Reed) for triggering the event was disingenuous. Most prominent of all, the CME issued, within 24 hours, a rare press release in which it argued against the SEC/CFTC explanation:
Futures and options markets are hedging and risk transfer markets. The report references a series of bona fide hedging transactions, totaling 75,000 contracts, entered into by an institutional asset manager to hedge a portion of the risk in its $75 billion investment portfolio in response to global economic events and the fundamentally deteriorating market conditions that day. The 75,000 contracts represented 1.3% of the total E-Mini S&P 500 volume of 5.7 million contracts on May 6 and less than 9% of the volume during the time period in which the orders were executed. The prevailing market sentiment was evident well before these orders were placed, and the orders, as well as the manner in which they were entered, were both legitimate and consistent with market practices. These hedging orders were entered in relatively small quantities and in a manner designed to dynamically adapt to market liquidity by participating in a target percentage of 9% of the volume executed in the market. As a result of the significant volumes traded in the market, the hedge was completed in approximately twenty minutes, with more than half of the participant's volume executed as the market rallied—not as the market declined. Additionally, the aggregate size of this participant's orders was not known to other market participants.
Additionally, the most precipitous period of market decline in the E-Mini S&P 500 futures on May 6 occurred during the 3½ minute period immediately preceding the market bottom that was established at 13:45:28. During that period, the participant hedging its portfolio represented less than 5% of the total volume of sales in the market.}}
David Leinweber, director of the Center for Innovative Financial Technology at Lawrence Berkeley National Laboratory, was invited by The Journal of Portfolio Management to write an editorial, in which he openly criticized the government's technological capabilities and inability to study today's markets. Leinweber wrote:
The heads of the SEC and CFTC often point out that they are running an IT museum. They have photographic evidence to prove it—the highest-tech background that The New York Times (on September 21, 2010) could find for a photo of Gregg Berman, the SEC’s point man on the flash, was a corner with five PCs, a Bloomberg, a printer, a fax, and three TVs on the wall with several large clocks.
A better measure of the inadequacy of the current mélange of IT antiquities is that the SEC/CFTC report on the May 6 crash was released on September 30, 2010. Taking nearly five months to analyze the wildest ever five minutes of market data is unacceptable. CFTC Chair Gensler specifically blamed the delay on the “enormous” effort to collect and analyze data. What an enormous mess it is.}}
Nanex, a leading firm specialized in the analysis of high-frequency data, also pointed out to several inconsistencies in the CFTC study:
Based on interviews and our own independent matching of the 6,438 [[Waddell & Reed
Academic research
As of July 2011, only one theory on the causes of the flash crash was published by a Journal Citation Reports indexed, peer-reviewed scientific journal. It was reported in 2011 that one hour before its collapse in 2010, the stock market registered the highest reading of "toxic order imbalance" in previous history. The authors of this 2011 paper apply widely accepted market microstructure models to understand the behavior of prices in the minutes and hours prior to the crash. According to this paper, "order flow toxicity" can be measured as the probability that informed traders (e.g., hedge funds) adversely select uninformed traders (e.g., market makers). For that purpose, they developed the Volume-Synchronized Probability of Informed Trading (VPIN) Flow Toxicity metric, which delivered a real-time estimate of the conditions under which liquidity is being provided. If the order imbalance becomes too toxic, market makers are forced out of the market. As they withdraw, liquidity disappears, which increases even more the concentration of toxic flow in the overall volume, which triggers a feedback mechanism that forces even more market makers out. This cascading effect has caused hundreds of liquidity-induced crashes in the past, the flash crash being one (major) example of it.
However, independent studies published in 2013 strongly disputed the claim that one hour before its collapse in 2010, the stock market registered the highest reading of "toxic order imbalance" in previous history. In particular, in 2011 Andersen and Bondarenko conducted a comprehensive investigation of the two main versions of VPIN used by its creators, one based on the standard tick-rule (or TR-VPIN)Easley, David and Lopez de Prado, Marcos and O'Hara, Maureen, Flow Toxicity and Volatility in a High Frequency World. Working paper, SSRN, February 2011. and the other based on Bulk Volume Classification (or BVC-VPIN). They find that the value of TR-VPIN (BVC-VPIN) one hour before the crash "was surpassed on 71 (189) preceding days, constituting 11.7% (31.2%) of the pre-crash sample". Similarly, the value of TR-VPIN (BVC-VPIN) at the start of the crash was "topped on 26 (49) preceding days, or 4.3% (8.1%) of the pre-crash sample".
Note that the source of increasing "order flow toxicity" on May 6, 2010, is not determined in Easley, Lopez de Prado, and O'Hara's 2011 publication. Whether a dominant source of toxic order flow on May 6, 2010, was from firms representing public investors or whether a dominant source was intermediary or other proprietary traders could have a significant effect on regulatory proposals put forward to prevent another flash crash. According to Bloomberg, the VPIN metric is the subject of a pending patent application filed by the paper's three authors, Maureen O'Hara and David Easley of Cornell University, and Marcos Lopez de Prado, of Tudor Investment Corporation.
A study of VPIN by scientists from the Lawrence Berkeley National Laboratory cited the 2011 conclusions of Easley, Lopez de Prado and O'Hara for VPIN on S&P 500 futures but provided no independent confirmation for the claim that VPIN reached its historical high one hour before the crash:
Ask Mako anything about 2010 flash crash — get instant answers, deeper analysis, and related topics.
Research with MakoFree with your Surf account
Create a free account to save articles, ask Mako questions, and organize your research.
Sign up freeThis content may have been generated or modified by AI. CloudSurf Software LLC is not responsible for the accuracy, completeness, or reliability of AI-generated content. Always verify important information from primary sources.
Report