From Surf Wiki (app.surf) — the open knowledge base
1978–79 Australian region cyclone season
none
none
| Field | Value |
|---|---|
| Basin | Aus |
| Year | 1979 |
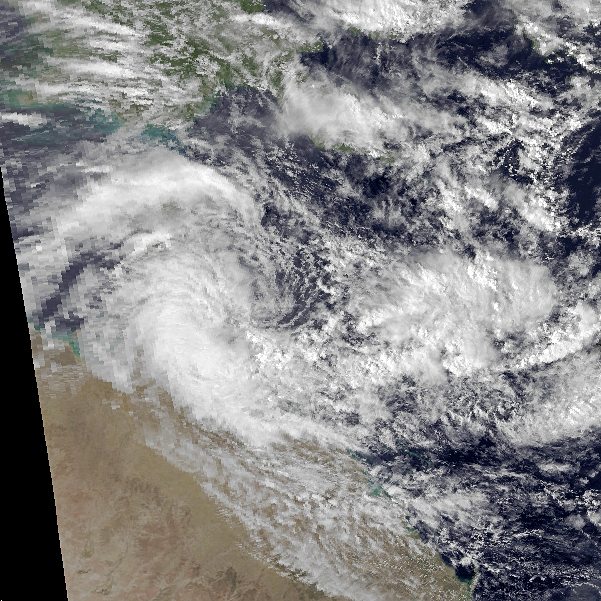
| Track | 1978-1979 Australian cyclone season summary.jpg |
| First storm formed | 19 November 1978 |
| Last storm dissipated | 12 May 1979 |
| Strongest storm name | Hazel |
| Strongest storm pressure | 935 |
| Strongest storm winds | 120 |
| Average wind speed | 10 |
| Total depressions | 13 |
| Total hurricanes | 12 |
| Total intense | 6 |
| Fatalities | 17 |
| Damages | 30 |
| five seasons | 1976–77, 1977–78, 1978–79, 1979–80, 1980–81 |
| South Indian season | 1978–79 South-West Indian Ocean cyclone season |
| Australian season | 1978–79 South Pacific cyclone season |
The 1978–79 Australian region cyclone season was the only season in which a reconnaissance aircraft flew into a tropical cyclone. Operationally, Australia's Bureau of Meteorology (BOM) tracked eleven tropical cyclones, while two additional systems were later added to the United States's Joint Typhoon Warning Center (JTWC) best track. Prior to 1985, the Australian region basin was defined as in the southern hemisphere between 80°E and 160°E, with the modern day season boundaries ranging from 1 November to 30 April of the following year. The first storm, an unnamed system, developed on 19 November 1978. The final cyclone, Kevin, dissipated by 12 May 1979. Tropical cyclones in this area were monitored by three Tropical Cyclone Warning Centres (TCWCs): the BOM in Perth, Darwin, and Brisbane.
Tropical cyclogenesis in the season began when an unnamed tropical cyclone developed well west of Australia on 19 November and lasted until 23 November after moving in a generally southward direction throughout much of its duration. Cyclone Peter developed over the Gulf of Carpentaria on 29 December. During and in the few days after making landfall in Queensland on 31 December, produced heavy precipitation in the state, becoming one of the rainiest tropical cyclones in Australia. Severe flooding occurred in the Cairns area, leaving two fatalities and about $10 million in damage. Gordon became the first system to enter from another basin, entering from the South Pacific on 9 January. The storm dissipated shortly after striking Queensland on 12 January, bringing rainfall and rough seas.
Cyclone Kerry remained in the Australian region from 12 February to 3 March, making it the longest-lived tropical cyclone in the basin on record. Hazel was the most intense tropical cyclone of the season, peaking as a Category 4 on the Australian tropical cyclone intensity scale. The storm brought rough seas and strong winds to Western Australia, resulting in $20 million in damage and 15 deaths after a fishing boat capsized. None of the subsequent tropical cyclones significantly effected land. Tropical cyclogenesis concluded with the formation of Kevin on 2 May, which dissipated on 12 May. Overall, the tropical cyclones of this season collectively caused 17 deaths and over $30 million in damage.
Season summary
ImageSize = width:800 height:200 PlotArea = top:10 bottom:80 right:20 left:20 Legend = columns:3 left:30 top:58 columnwidth:270 AlignBars = early DateFormat = dd/mm/yyyy Period = from:01/11/1978 till:01/06/1979 TimeAxis = orientation:horizontal ScaleMinor = grid:black unit:month increment:1 start:01/11/1978 Colors = id:canvas value:gray(0.88) id:GP value:red id:TL value:rgb(0.43,0.76,0.92) legend:Tropical_Low_=_ id:C1 value:rgb(0.3,1,1) legend:Category_1_=63–88_km/h(39-55_mph) id:C2 value:rgb(0.75,1,0.75) legend:Category_2_=89–117_km/h(55-73_mph) id:C3 value:rgb(1,0.85,0.55) legend:Category_3_=118–159_km/h(73-99_mph) id:C4 value:rgb(1,0.45,0.54) legend:Category_4_=160–199_km/h(99-124_mph) id:C5 value:rgb(0.55,0.46,0.9) legend:Category_5_=≥200_km/h(≥124_mph)
Backgroundcolors = canvas:canvas
BarData = barset:Hurricane bar:Month
PlotData= barset:Hurricane width:11 align:left fontsize:S shift:(4,-4) anchor:till from:19/11/1978 till:23/11/1978 color:C1 text:"01S (C1)" from:20/12/1978 till:24/12/1978 color:C1 text:"03S (C1)" from:29/12/1978 till:04/01/1979 color:C3 text:"Peter (C3)" from:08/01/1979 till:13/01/1979 color:C1 text:"Greta (C1)" from:09/01/1979 till:12/01/1979 color:C1 text:"Gordon (C1)" from:12/02/1979 till:04/03/1979 color:C3 text:"Rosa (C3)" from:15/02/1979 till:05/03/1979 color:C4 text:"Kerry (C4)" barset:break from:06/03/1979 till:14/03/1979 color:C4 text:"Hazel (C4)" from:16/03/1979 till:21/03/1979 color:C2 text:"Ivan (C2)" from:06/04/1979 till:16/04/1979 color:C1 text:"Stan (C1)" from:09/04/1979 till:14/04/1979 color:C2 text:"Jane (C2)" from:13/04/1979 till:20/04/1979 color:C4 text:"Idylle (C4)" from:02/05/1979 till:12/05/1979 color:C2 text:"Kevin (C2)" barset:break
bar:Month width:6 align:center fontsize:S shift:(0,-20) anchor:middle color:canvas from:01/11/1978 till:01/12/1978 text:November from:01/12/1978 till:31/12/1978 text:December from:01/01/1979 till:31/01/1979 text:January from:01/02/1979 till:28/02/1979 text:February from:01/03/1979 till:31/03/1979 text:March from:01/04/1979 till:30/04/1979 text:April from:01/05/1979 till:01/06/1979 text:May
TextData = pos:(569,23) text:"(For further details, please see" pos:(713,23) text:"scales)"
Under the modern day boundaries, a season lasts from 1 November to 30 April of the following year, while a tropical cyclone year is defined as from 1 July to 30 June of the next year. Thirteen cyclones entered or formed in the Australian region, which was equal to the 1970–71 to 2001–02 average of 13 per season. By region, three cyclones developed over the Perth TCWC, three formed in the Darwin TCWC, and just one originated over the Brisbane area. Thus, seven cyclones developed in the Australian region – defined as the southern hemisphere between 80°E and 160°E – until Météo-France's Réunion area of responsibility and BOM adjusted the boundary eastward to 90°E in 1985. This was slightly below the 1952–53 to 1970–71 average of eight per season.
There was a total of eleven coastal crossings, which is either a landfall or a tropical cyclone moving from land to sea. This was well above the 1949–50 to 1974–75 average of five per season. This was the first and only season that reconnaissance aircraft flew into cyclones in this basin. A WP-3D Orion operated by the United States's National Oceanic and Atmospheric Administration (NOAA) flew into Cyclone Kerry on three occasions – 21 February, 22 February, and 4 March. Another flight mission was conducted for observing Cyclone Rosa as the storm was making landfall in Northern Territory on 26 February. Overall, the tropical cyclones of this season resulted in 17 deaths and slightly more than $30 million in damage.
Activity began in November 1978, when Tropical Cyclone 01S formed the Australian region in the Perth TCWC area on 18 November. The next cyclone, later designated as 03S, developed about a month later on 20 December. In addition, Peter formed on 29 December. January also featured two more cyclones, Greta and Gordon, the latter of which entered the basin from the South Pacific on 9 January. Likewise, there were two tropical cyclones in the month of February, Rosa and Kerry, both of which existed simultaneously for almost three weeks. Hazel and Ivan originated in March. The former was the most intense tropical cyclone of the season, peaking with 10-minute maximum sustained winds of 220 km/h and a minimum barometric pressure of 935 mbar. April was the most active, with three cyclones originating or entering the basin during that month. The last storm, Kevin existed in May between 2 May and 12 May, after the end of the modern day season, which is 30 April.
Systems
Cyclone 01S
| 1-min winds = 40 An unnamed cyclone, later designated as 01S, developed about 185 km north of North Keeling on 19 November at 12:00 UTC. After six hours, the storm intensified into a Category 1 cyclone on the Australian tropical cyclone intensity scale. The cyclone headed southwestward and intensified further on 20 November, peaking with 1-minute sustain winds of 75 km/h by 06:00 UTC. Early on 21 November, the system curved west-southwestward, before turning on the following day. Thereafter, the storm began weakening and dissipated early on 23 November, while situated about 1,210 km southwest of Cocos Islands.
Cyclone 03S
| 1-min winds = 55 Another unnamed cyclone, designated as 03S, developed on 20 December while located about 1,055 km west-northwest of North Keeling. The storm strengthened and became a Category 1 cyclone about twelve hours later. After initially moving east-southeastward, the system re-curved to the west-southwest by 21 December. Further intensification occurred, and by 00:00 UTC on 22 December, the storm peaked with maximum sustained winds of 85 km/h. Thereafter, the cyclone slowly weakened and fell to tropical depression intensity on 24 December. Several hours later, the system entered the southwest Indian Ocean basin, where it dissipated on 26 December.
Severe Tropical Cyclone Peter
| 10-min winds = 80 | 1-min winds = 50 Main article: Cyclone Peter
A weak low-pressure area over the Arafura Sea developed into Cyclone Peter on 29 December. Peter moved southeastward and deepened while brushing Arnhem Land. Initially a tropical low, it strengthened into a Category 1 cyclone by 12:00 UTC on 29 December. Peter intensified further on 30 December and became a Category 2 cyclone. On the following day, the cyclone peaked with maximum sustained winds of 110 km/h. Peter weakened to a Category 1 cyclone before making landfall near the mouth of the Edward River in Queensland. While crossing the Cape York Peninsula, the storm weakened slowly. After reaching the Pacific Ocean near Cooktown, the storm decelerated and meandered offshore, but dissipated about 105 km north of Cape Melville.
While trekking slowly offshore the east coast of Queensland, the storm dropped very heavy rainfall, peaking at 1,947 mm at Mount Bellenden Ker, making it the wettest tropical cyclone in Australia at the time until Cyclone Jasper of 2023. Severe flooding occurred, especially in the Cairns area. The most severe damage was dealt to sugar cane, which suffered 70 to 90 percent destruction. Some flights were canceled at the Cairns Airport due to standing water. Floodwaters forced at least 50 people to flee their homes in Cairns. A number of roads, including major highways, were flooded throughout coastal areas of Far North Queensland. Rainfall and winds also resulted in many power and telephone service outages through the region. There were two fatalities and damage reached approximately $10 million.
Tropical Cyclone Greta
| 10-min winds = 50 | 1-min winds = 55 A weak low-pressure area associated with the remnants of Peter developed into a tropical disturbance over the Gulf of Carpentaria on 8 January. After six hours, the disturbance intensified into a tropical low, which was named Greta. Moving east-northeast, the system strengthened into a Category 1 cyclone late on 9 January. By 00:00 UTC the next day, Greta became a Category 2 and peaked with maximum sustained winds of 95 km/h. A few hours later, the system made landfall to the south of Weipa, Queensland. The city of Weipa recorded a barometric pressure of 986 mbar, the lowest in relation to Greta. While traversing the Cape York Peninsula, the cyclone weakened, falling to Category 1 intensity by midday on 10 January.
Eventually, Greta curved southward and briefly moved offshore, before making another landfall near Princess Charlotte Bay early on 11 January. The storm curved west-southwestward and soon weakened to a tropical low. After re-emerging into the Gulf of Carpentaria again on 12 January, Greta almost immediately weakened to a tropical disturbance. The storm then meandered offshore Gulf Country before dissipating around 00:00 UTC on 13 January. Greta brought rainfall to portions of the Cape York Peninsula flooded during the passage of Cyclone Peter, but the former resulted in much less damage than the latter.
Tropical Cyclone Gordon
| 10-min winds = 45 | 1-min winds = 45 Cyclone Gordon developed over the South Pacific basin on 2 January, where it peaked as a Category 3 cyclone with maximum sustained winds of 130 km/h and a minimum barometric pressure of 965 mbar on 7 January. However, between 7 January and 8 January, satellite imagery indicated a significant weakening trend. Upon reaching the Australian region early on 9 January, Gordon had deteriorated to a Category 1. Around that time, the cyclone attained its peak intensity while in the basin, with maximum sustained winds of 75 km/h and a minimum barometric pressure of 990 mbar.
Weakening continued, with Gordon decreasing to a tropical low on 10 January, following by to tropical disturbance intensity on 11 January. Several hours later, Gordon made landfall near Proserpine, Queensland, and promptly dissipated. Some coastal towns in Queensland observed up to 50 mm in a 24‑hour period. However, there was no flood damage. Rough seas and strong winds resulted in some beach erosion.
Severe Tropical Cyclone Rosa
| 10-min winds = 80 | 1-min winds = 95 A persistent cluster of clouds over the South Pacific basin developed into a tropical low, named Rosa, near the Solomon Islands on 12 February. Shortly thereafter, Rosa entered the Australian region. Initially, the system remained weak and moved across the Cape York Peninsula on 16 February. Upon reaching the Gulf of Carpentaria, the storm slowly strengthened and moved in an erratic motion. Early on 26 February, Rosa peaked with maximum sustained winds of 150 km/h and a minimum barometric pressure of 955 mbar. A reconnaissance flight into the cyclone recorded winds of 170 km/h at an altitude of 540 m, while located about 35 km northeast of the eye early on 26 February. The cyclone then made landfall near Bing Bong. Northern Territory, at the same intensity. Rosa moved west-southwestward across Australia and dissipated offshore Western Australia near Exmouth on 4 March.
Observation stations in the southwest Gulf of Carpentaria reported abnormally high tides. At Bing Bong, the water level rose an estimated 2 m above the spring high tide mark. On Groote Eylandt island, a tide gauge was washed away. These weather stations suffered thousands of dollars in damage. Trees in extensive tracts of forests were felled, especially in the Roper-McArthur district, which stretches from the Roper to McArthur rivers. On North Island, located within the Sir Edward Pellew Group of Islands, a stranded light aircraft was destroyed.
Severe Tropical Cyclone Kerry
| 10-min winds = 100 | 1-min winds = 105 Kerry developed over the South Pacific basin from a low-pressure area on 12 February. After later striking Makira in the Solomon Islands on 15 February, Kerry reached the Bureau of Meteorology's area of responsibility on 16 February as a Category 2 cyclone. Shortly thereafter, the system became a Category 3 cyclone. Reaching Category 4 on 18 February, the storm peaked with maximum sustained winds of 185 km/h. After peak intensity, the storm began to move erratically, executing multiple cyclonic loops and decelerating between 20 February and 25 February. At that time, Kerry weakened significantly due to dry air, falling to Category 3 on 21 February and Category 2 on 24 February. The storm curved southwestward by 26 February and deteriorated to a Category 1 later that day. Shortly thereafter, Kerry turned westward and began approaching the east coast of Queensland.
Late on 28 February, the cyclone struck the Whitsunday Islands as a Category 1 and later made multiple landfalls on the mainland as a tropical low on 1 March. Kerry curved northward several hours later and re-emerged into the Pacific Ocean. The storm reintensified into a Category 1 on 2 March, before a trough forced the cyclone to curve southeastward. Kerry again weakened while traversing above the Great Barrier Reef and finally dissipated on 5 March. In Queensland, much of the damage occurred in the vicinity of Mackay, where a wind gust of 141 km/h was observed. Twenty-seven homes were damaged, one severely, and a warehouse lost a large section of its roof. Wave heights up to 4.02 m in the city caused about $1 million (1979 AUD) in damage to boats at the harbor. On Brampton Island, the resort's staff quarters building was deroofed and many trees were downed throughout the island.
Severe Tropical Cyclone Hazel
| 10-min winds = 105 | 1-min winds = 100
Hazel grazed the Western Australia coast on March 13, 1979. Fifteen crewmen drowned when their fishing boat sank during the storm. The storm caused $41 million in damage, among the costliest Western Australian cyclones.
Tropical Cyclone Ivan
| 10-min winds = 49 | 1-min winds = 60
Ivan was the second cyclone to form in the Western Region. Satellite imagery showed that Ivan wasn't an intense storm, but the central pressure dropped to 988 hPa on 18 March. Gales were likely confined to within 100 km of the centre.
Tropical Cyclone Jane
| 10-min winds = 50 | 1-min winds = 45 A tropical disturbance formed about 220 mi (135 mi) west-southwest of Cocos Island early on 8 April. Early on the next day, the disturbance strengthened into a tropical low, which was named Jane. The storm only intensified slightly further and later peaked with a minimum barometric pressure of 988 mbar. Jane dissipated by 14 April.
Tropical Cyclone Stan
| 10-min winds = 40 | 1-min winds = 40 A tropical low formed over the northern Coral Sea on 6 April, reaching the Gulf of Carpentaria on 8 April. The system remained stationary between 11 and 12 April, with a central pressure of 1000 hPa. By 13 April, the system developed to tropical cyclone intensity. The system attained its lowest estimated central pressure reading at 995 mbar. Also on 14 April, the cyclone accelerated as it approached the Queensland coast. It started to lose intensity as it crossed the Cape York peninsula and into the Coral Sea, until it became unrecognizable on 16 April.
The highest wind speed associated with Stan was recorded at 74 km/h on 12 April in Cape Wessel, Queensland. The highest 24-hour rainfall associated with Stan was 233 mm in Iron Range, Queensland on 15 April, with other reports including 127 mm in Moreton, Queensland, and 84 mm in Weipa, Queensland. No damage, loss of life, or significant flooding occurred.
Severe Tropical Cyclone Idylle
| 10-min winds = 130 | 1-min winds = 130
Tropical Cyclone Kevin
| 10-min winds = 50 | 1-min winds = 50
Kevin existed from 2 May to 12 May. As it churned in open ocean, it took an unusual "zig-zag" path. Kevin did not strengthen much and dissipated out to sea.
References
References
- (9 September 2011). "Worldwide Tropical Cyclone Centers". [[National Oceanic and Atmospheric Administration]].
- (2008). "Terminologies used in the region of South-West Pacific Ocean". [[World Meteorological Organization]].
- L. W. Broadbridge. (May 1980). "The Australian Tropical Cyclone Season 1978–79". [[Bureau of Meteorology]].
- Philippe Caroff. (June 2011). "Operational procedures of TC satellite analysis at RSMC La Réunion". World Meteorological Organization.
- "Severe Tropical Cyclone Kerry". Bureau of Meteorology.
- (2012). "JTWC Best Track for Cyclone 01S". Joint Typhoon Warning Center.
- (2012). "JTWC Best Track for Cyclone 03S". Joint Typhoon Warning Center.
- (2012). "JTWC Best Track for Cyclone 05S". Joint Typhoon Warning Center.
- "Tropical Cyclone Peter". Bureau of Meteorology.
- "Climate Education: Flood". Bureau of Meteorology.
- "Tropical Cyclone Jasper: December 2023". JBA Risk Management.
- (January 7, 1979). "Damage to sugar cane 'in millions'". [[The Canberra Times]].
- (January 3, 1979). "Telephone, roads cut by cyclone". The Canberra Times.
- (January 4, 1979). "Flooding, food shortages in north Qld". The Canberra Times.
- "Tropical Cyclone Greta". Bureau of Meteorology.
- (2012). "JTWC Best Track for Cyclone 08S". Joint Typhoon Warning Center.
- (2012). "JTWC Best Track for Cyclone 06S". Joint Typhoon Warning Center.
- Bureau of Meteorology (1992). ''Climate of Queensland'', Commonwealth of Australia {{ISBN. 978-0-644-24331-5
- "Central/South-Western, WA: Cyclone". ema.gov.au.
- (2010). "Tropical Cyclones in Western Australia – Extremes". Australian Bureau of Meteorology.
- "THE AUSTRALIAN TROPICAL CYCLONE SEASON 1978-79".
- (2012). "JTWC Best Track for Cyclone 26S". Joint Typhoon Warning Center.
- "THE AUSTRALIAN TROPICAL CYCLONE SEASON 1978-79".
- "Severe Tropical Cyclone Idylle".
This article was imported from Wikipedia and is available under the Creative Commons Attribution-ShareAlike 4.0 License. Content has been adapted to SurfDoc format. Original contributors can be found on the article history page.
Ask Mako anything about 1978–79 Australian region cyclone season — get instant answers, deeper analysis, and related topics.
Research with MakoFree with your Surf account
Create a free account to save articles, ask Mako questions, and organize your research.
Sign up freeThis content may have been generated or modified by AI. CloudSurf Software LLC is not responsible for the accuracy, completeness, or reliability of AI-generated content. Always verify important information from primary sources.
Report